Method, device and system for creating graphical user interface, and FPGA (Field Programmable Gate Array)
A graphical user interface and data technology, applied in the direction of program control devices, instruments, electrical digital data processing, etc., can solve the problems of no graphics acceleration function, data cannot be displayed more efficiently, etc., and achieve the effect of efficient display
- Summary
- Abstract
- Description
- Claims
- Application Information
AI Technical Summary
Problems solved by technology
Method used
Image

Examples
Embodiment 1
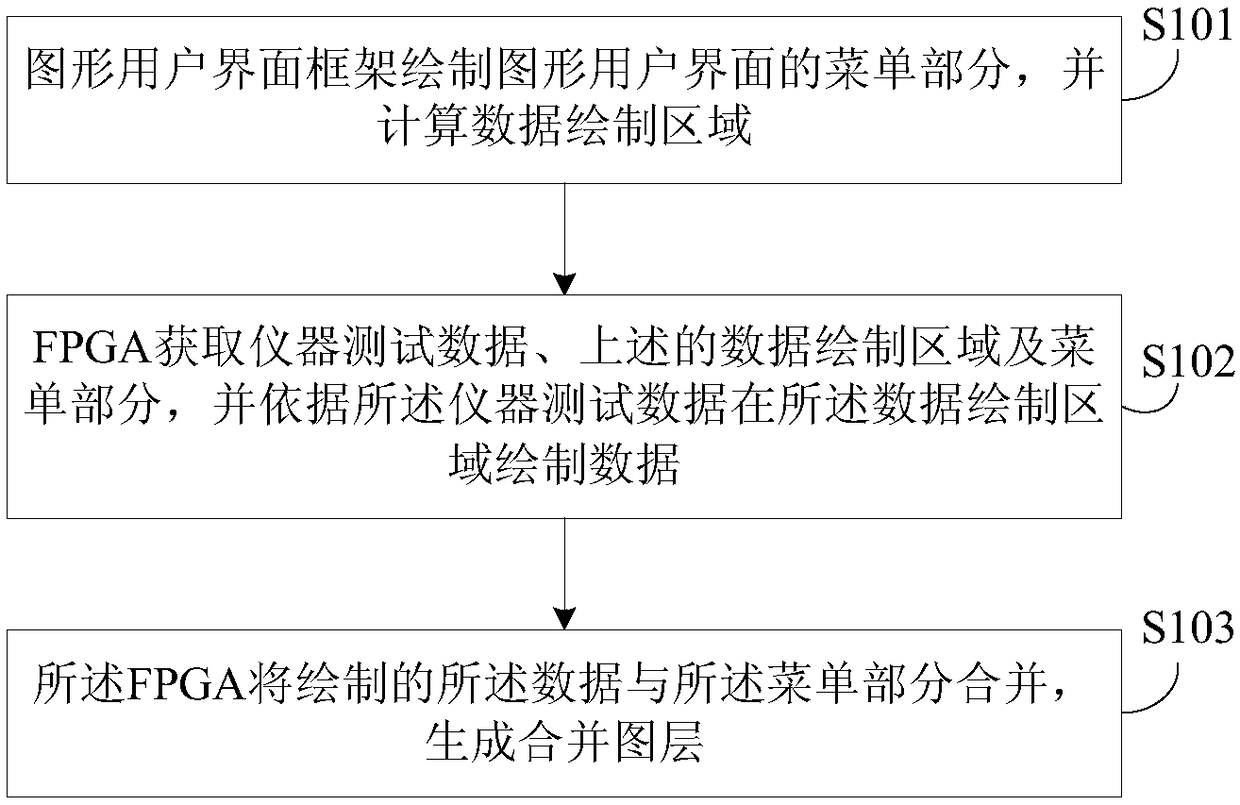
[0045] figure 1 Create a method flow chart for the graphical user interface of the embodiment of the present invention, such as figure 1 As shown, the GUI creation method includes:
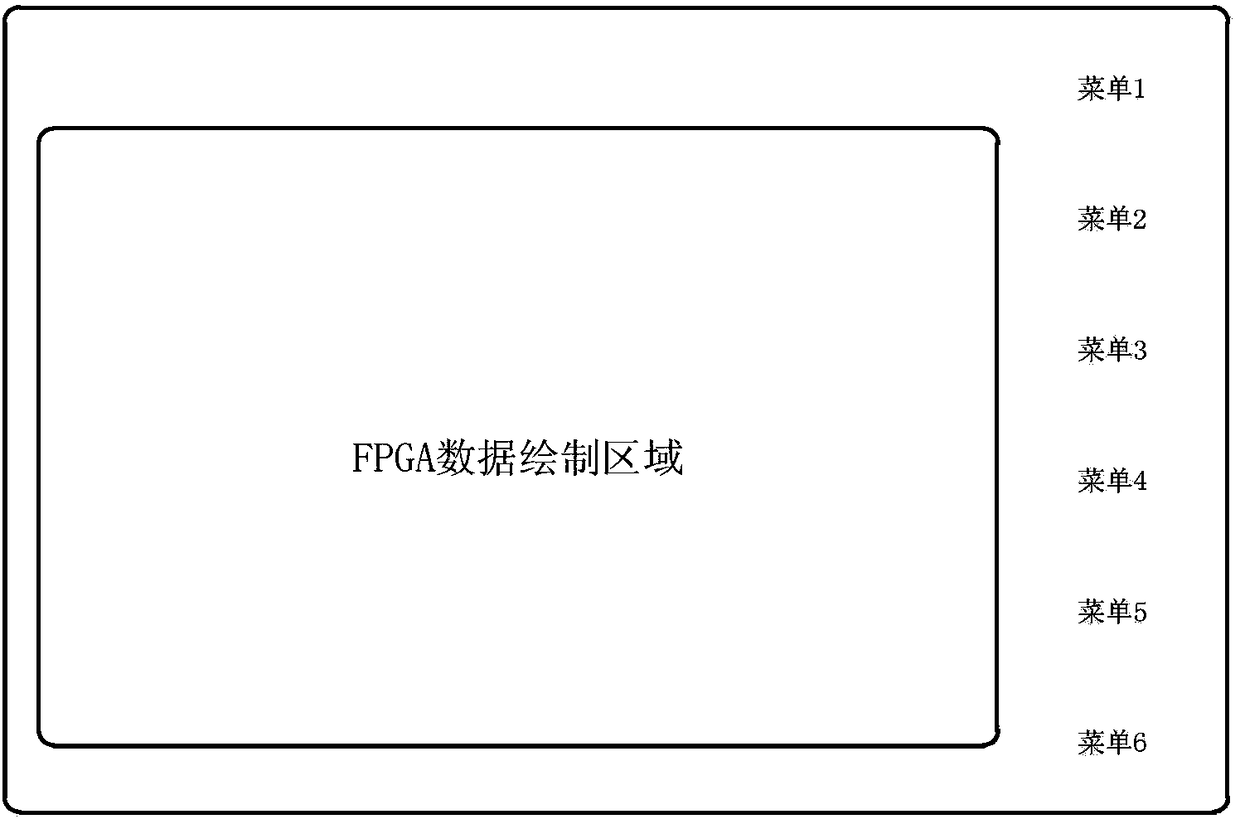
[0046] S101: the graphical user interface framework draws the menu part of the graphical user interface, and calculates the data drawing area;
[0047] S102: Field-Programmable Gate Array (Field-Programmable Gate Array, FPGA for short) acquires instrument test data, the above-mentioned data drawing area and menu part, and draws data in the data drawing area according to the instrument test data;
[0048] S103: The FPGA merges the drawn data with the menu part to generate a merged layer.
[0049] Depend on figure 1 As can be seen from the shown flow process, the present invention uses the GUI frame to draw the menu part of the GUI, and calculates the data drawing area; uses the FPGA to draw data in the data drawing area according to the instrument test data, and merges the drawn data with the me...
Embodiment 2
[0059] Embodiment 2 of the present invention also provides a graphical user interface creation device, which can be applied to testing instruments and meters. Since the problem-solving principle of the graphical user interface creation device is similar to the method in embodiment 1, its For specific implementation, reference may be made to the implementation of the method in Embodiment 1, and repeated descriptions will not be repeated.
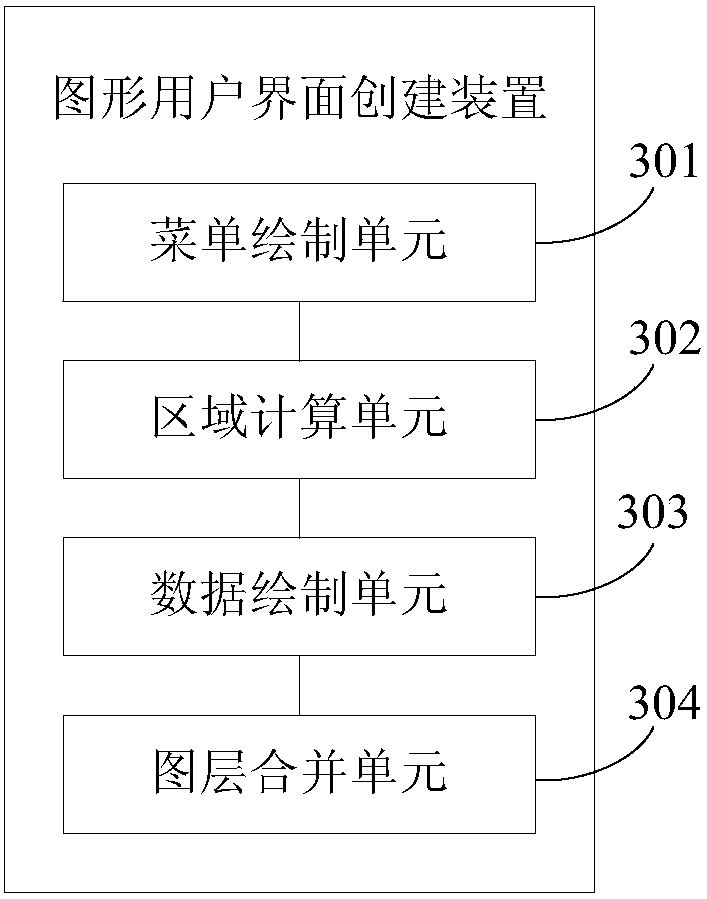
[0060] image 3 It is a schematic structural diagram of an apparatus for creating a graphical user interface according to an embodiment of the present invention. like image 3 As shown in , the GUI creation device includes: a menu drawing unit 301 , an area calculation unit 302 , a data drawing unit 303 and a layer merging unit 304 .
[0061] A menu drawing unit 301, configured to draw the menu part of the graphical user interface;
[0062] an area calculation unit 302, configured to calculate a data drawing area;
[0063] A data drawing ...
Embodiment 3
[0069] Figure 5 Create a method flow chart for the graphical user interface of the embodiment of the present invention, such as Figure 5 As shown, the GUI creation method includes:
[0070] S501: Obtain the menu part, data drawing area and instrument test data of the GUI, the menu part is drawn by the GUI framework, and the data drawing area is calculated by the GUI framework;
[0071] S502: Draw data in the data drawing area according to the instrument test data;
[0072] S503: Merge the drawn data with the menu part to generate a merged layer.
[0073] The execution subject of the method for creating a graphical user interface in this embodiment is FPGA. Depend on Figure 5 As can be seen from the flow shown, the FPGA acquires the menu part of the graphical user interface, the instrument test data and the data drawing area, and then draws data in the data drawing area according to the instrument test data, and finally merges the drawn data with the menu part to generat...
PUM
 Abstract
Description
Claims
Application Information
 - R&D
- Intellectual Property
- Life Sciences
- Materials
- Tech Scout
- Unparalleled Data Quality
- Higher Quality Content
- 60% Fewer Hallucinations
Browse by: Latest US Patents, China's latest patents, Technical Efficacy Thesaurus, Application Domain, Technology Topic, Popular Technical Reports.
© 2025 PatSnap. All rights reserved.Legal|Privacy policy|Modern Slavery Act Transparency Statement|Sitemap|About US| Contact US: help@patsnap.com