
Data UE visual design system

A design system and data technology, applied in the field of data visualization, can solve the problems of lack of customer industry application cases, not good at data application, high learning cost, balance ease of use and complexity, accurately analyze trends, and clearly display data. Effect

Pending Publication Date: 2020-05-22
天津浪淘科技股份有限公司
View PDF7 Cites 19 Cited by
  • Summary
  • Abstract
  • Description
  • Claims
  • Application Information

AI Technical Summary

Problems solved by technology

[0006] (2) High labor cost
[0007] At present, most of the suppliers or solution providers who can provide professional industry applications have unique industry expertise, but many of them are not good at data applications. They have high costs of designing and developing data applications by themselves, no accumulation, unprofessionalism, and changing needs. high cost problem
[0008] (3) New Value Point Challenge
[0009] Traditional software suppliers are being baptized by big data thinking. Such suppliers need to try to provide users with new value points in the era of big data. However, at present, data applications derived from BI scale are not easy to use, high learning costs, and expensive. Expensive question, somewhat slows down the trial and error cycle
[0010] (4) Extremely cool personalized appeal
[0012] (5) The cost of designing and developing visualization applications by oneself is high, without accumulation, unprofessional, and the cost of demand changes is high
[0013] (6) The existing tools are not easy to use, the learning cost is high, and the price is expensive
[0014] (7) Most of the analysis reports are biased, and there are few tools that focus on display, that is, there is a lack of professional data display tools
[0016] (9) The lack of industry application cases where customers are located cannot meet the individual needs of industry users

Method used


Image

  • Data UE visual design system
  • Data UE visual design system
  • Data UE visual design system

Examples


Embodiment Construction

[0071] Embodiments of the present invention are described in detail below, examples of which are shown in the drawings, wherein the same or similar reference numerals designate the same or similar elements or elements having the same or similar functions throughout. The embodiments described below by referring to the figures are exemplary and are intended to explain the present invention and should not be construed as limiting the present invention.

[0072] The present invention proposes a data UE visualization design system, which provides a complete set of solutions, can effectively integrate the existing data in the enterprise, quickly and accurately provide reports and propose decision-making basis, and help the enterprise to make wise business Business decisions. The data UE visualization design system of the present invention is a set of analytical application-oriented business intelligence system, which serves as a collection of visualization tools for analysis and pre...


PUM


Abstract

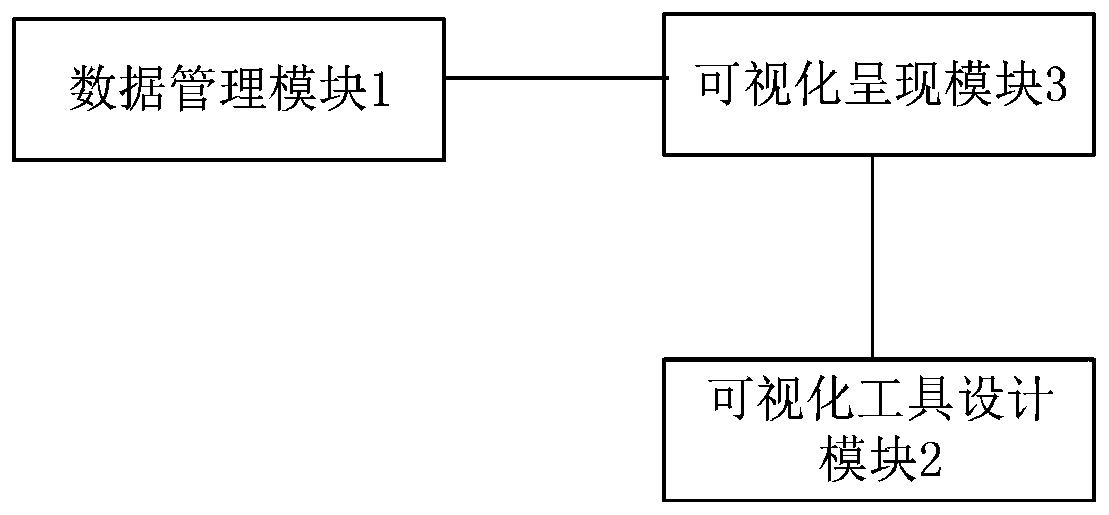
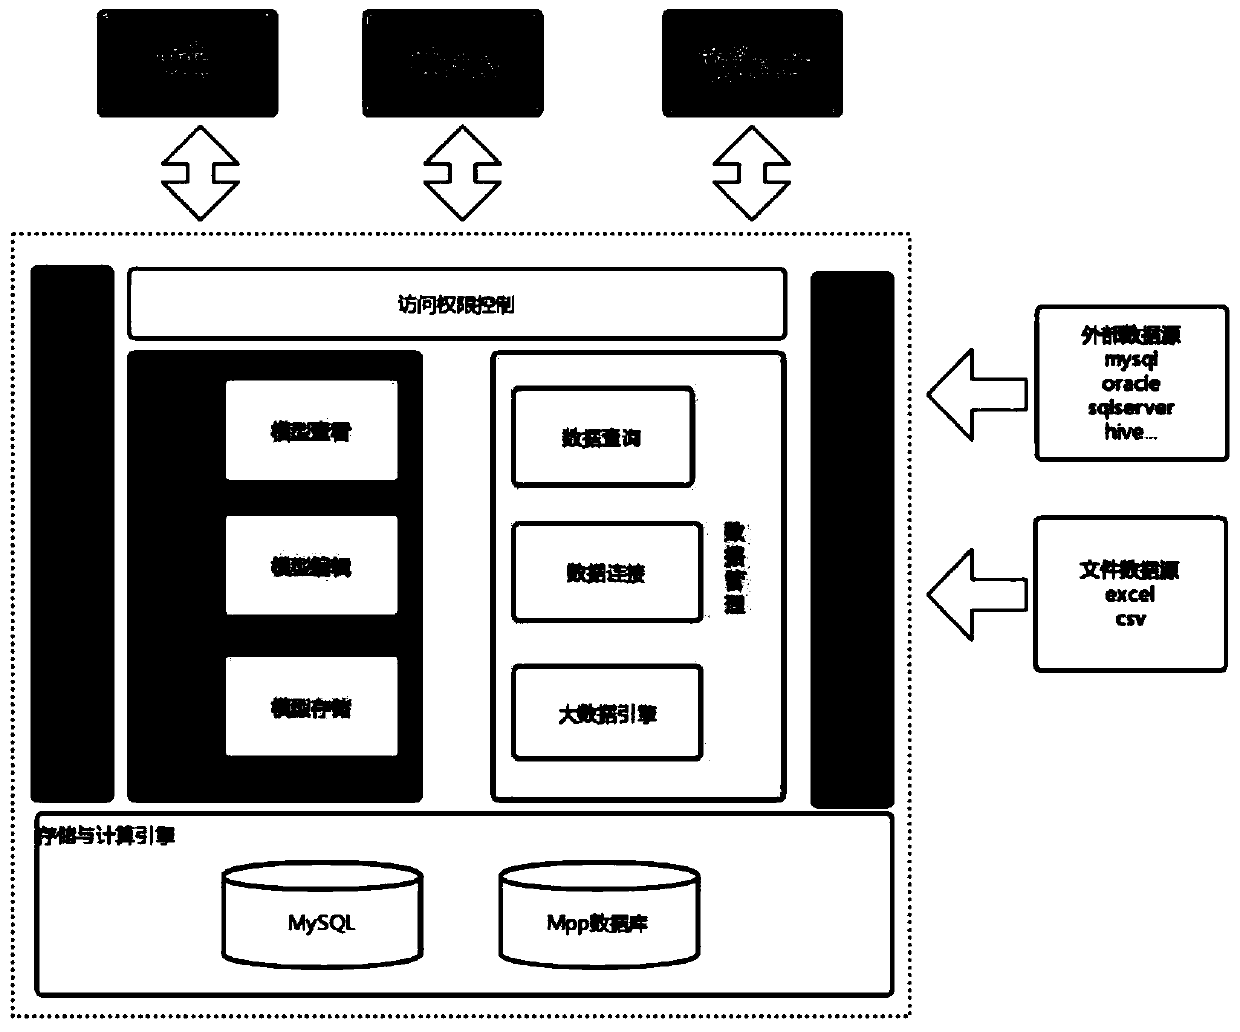
The invention provides a data UE visual design system, which comprises a data management module used for obtaining source data through a local file uploading mode or a far-end database extraction mode, selecting a database needing to be configured with data connection, generating new data connection information, and then storing the collected source data into the database; a visual tool design module used for designing a visual interactive chart editing tool to serve as a display board for displaying data; a billboard editing module used for importing a billboard installation package from theoutside and installing a corresponding billboard; and a visual presentation module used for receiving an operation instruction of a user on a visual tool, dragging the corresponding interactive chartediting tool according to the operation instruction, and carrying out real-time updating presentation on the created data in a designed billboard style. According to the method, the usability is ensured, meanwhile, powerful data visual analysis, visual exploration and display functions are provided, and all requirements of organizations for data processing and operation analysis are fully met.

Description

technical field [0001] The invention relates to the technical field of data visualization, in particular to a data UE visualization design system. Background technique [0002] Big data has become a national strategy and another national core asset besides land power, sea power, and air power. Big data awareness has also penetrated into national thinking and corporate thinking. With the vigorous development of big data infrastructure, big data technology and big data applications in recent years, the complexity, technical barriers and implementation difficulties of big data are decreasing year by year. Whether it is policy-oriented implementation or enterprise-level solutions, data applications are both There are many practices and new challenges: [0003] The existing visual design system has the following defects: [0004] (1) Wide range of application scenarios [0005] From the traditional Internet, mobile Internet to the increasingly mature Internet of Things, from t...

Claims


Application Information

Patent Timeline
Patent Type & Authority Applications(China)
IPC IPC(8): G06F8/38G06F8/34G06F16/25
CPCG06F8/38G06F8/34G06F16/254
Inventor 张卫民
Owner 天津浪淘科技股份有限公司
Learn More