Electrocardiographic scatter point display method and display device
A technology of ECG scatter and scatter diagrams, which is applied in medical science, sensors, diagnostic recording/measurement, etc., can solve problems such as poor interactive performance, single display mode of ECG scatter points, and visual confusion of users, so as to improve The effect of diagnostic efficiency
- Summary
- Abstract
- Description
- Claims
- Application Information
AI Technical Summary
Problems solved by technology
Method used
Image
Examples
Embodiment 1
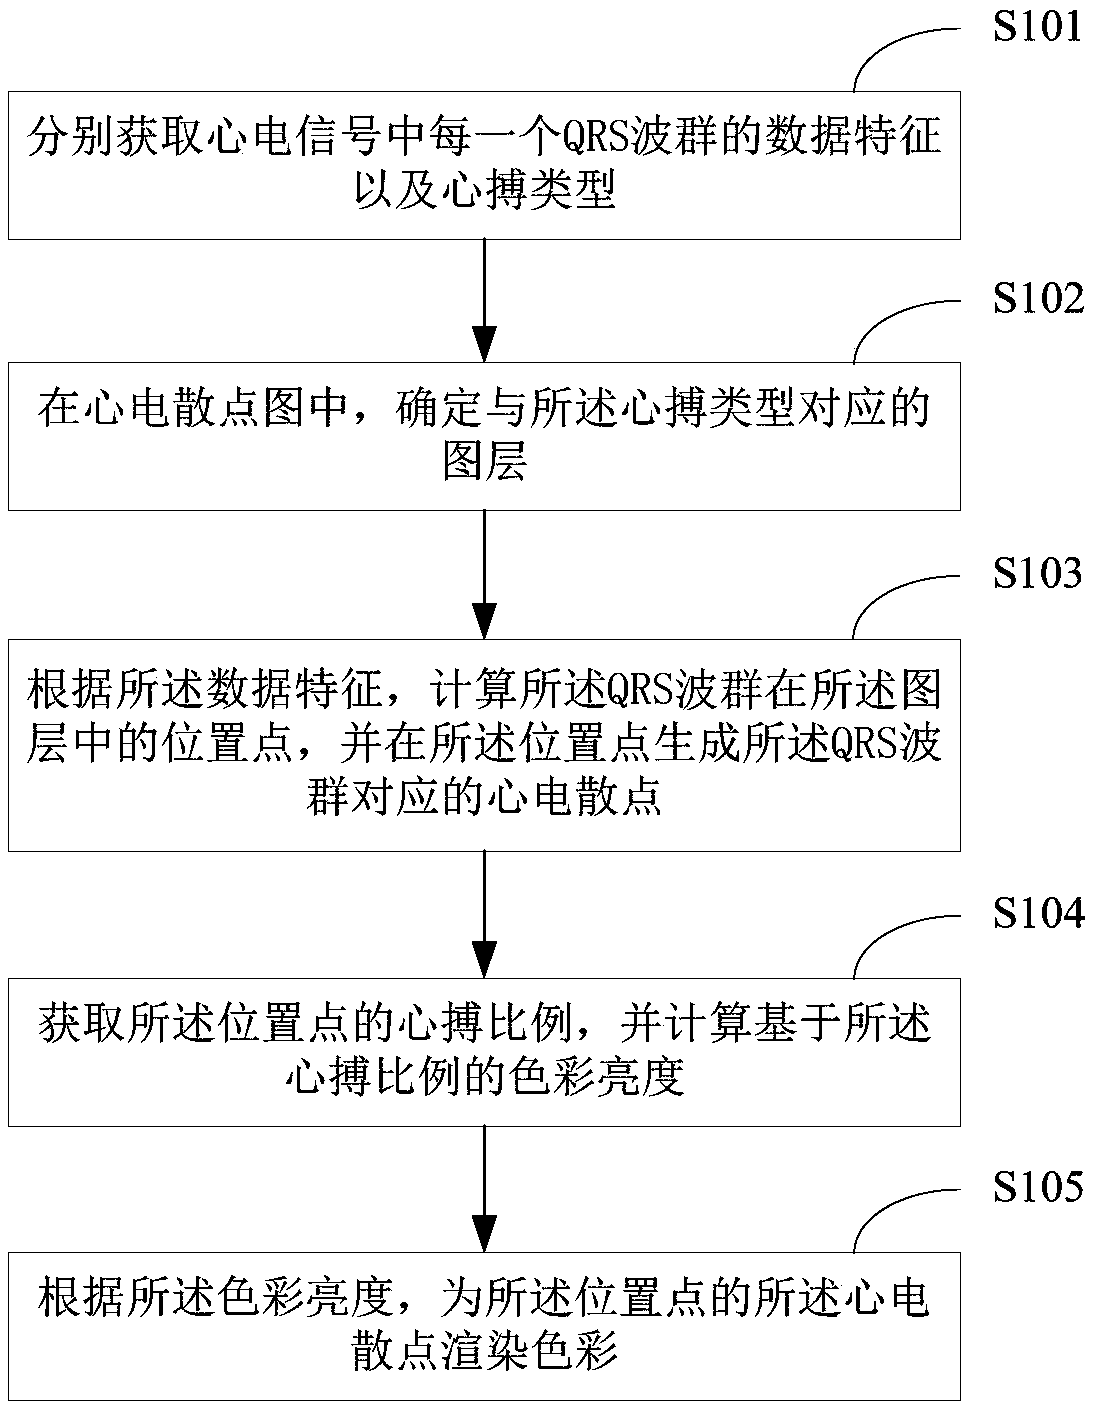
[0032] figure 1 The implementation flow of the method for displaying ECG scattered points provided by Embodiment 1 of the present invention is shown, and the details are as follows:
[0033] In S101, the data feature and heartbeat type of each QRS complex in the ECG signal are obtained respectively.
[0034] In this embodiment, the electrocardiographic signal is a physiological signal, including the electrocardiographic signal of a human body and the electrocardiographic signal of an animal body. By placing the measuring electrodes in the signal acquisition device on a certain part of the surface of the organism, a series of ECG data can be collected. The ECG data records the regular voltages that occur in each part of the body in each cardiac cycle. The ECG data describing the dynamic change of the voltage is the ECG signal, which is displayed in the signal acquisition device or the electrocardiogram device in the form of an ECG waveform.
[0035] Preferably, the collection...
Embodiment 2
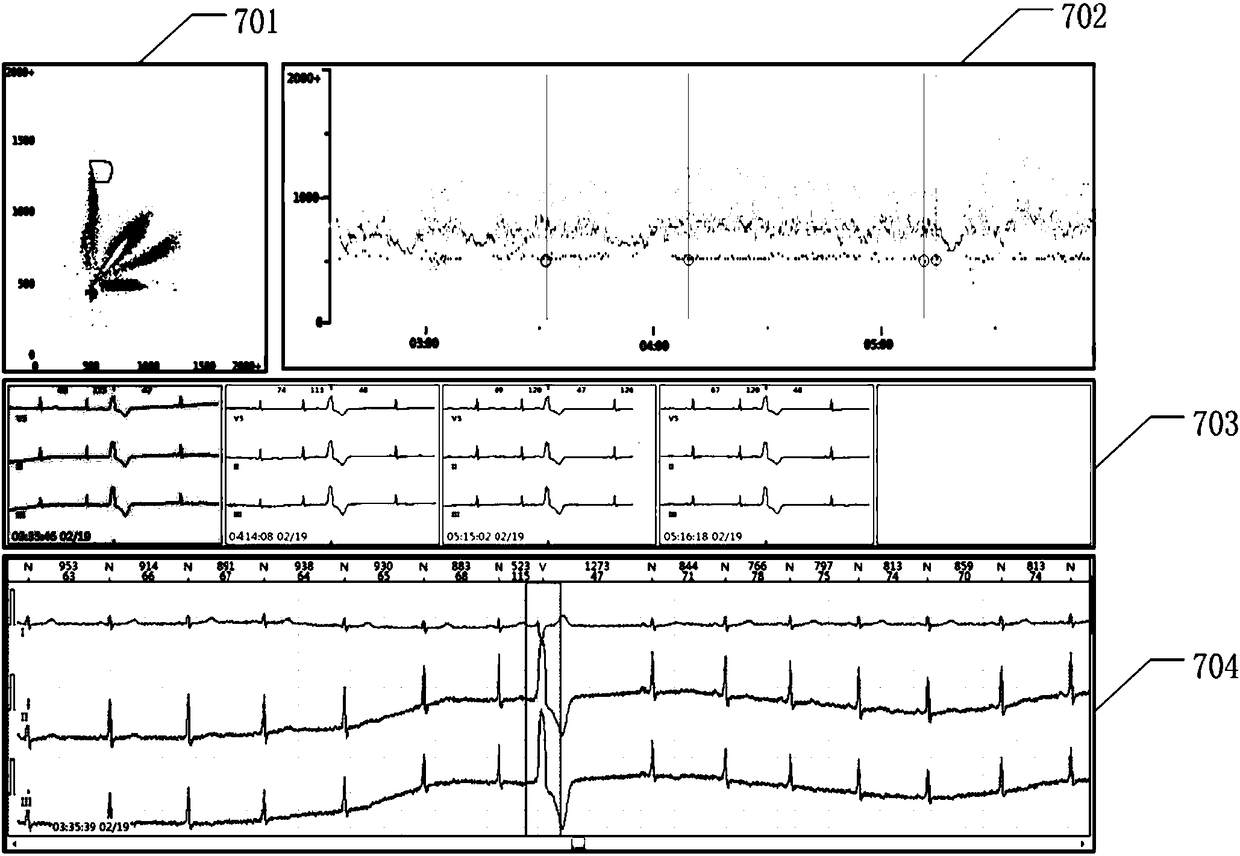
[0073] In this embodiment, on the basis of Embodiment 1 of the present invention, the display mode of the ECG scattered points is further limited, as follows Figure 5 Shown:
[0074] In S501, in the ECG scatter diagram, one or more ECG scatter points selected by a user are acquired.
[0075] When it is detected that the pattern drawn by the user in the Lorenz scatter diagram or the time RR scatter diagram is a closed curve containing one or more ECG scatter points, it can be determined that the ECG scatter points selected by the user are closed curves ECG scattered point; or, when receiving the selection instruction of the location of the ECG scattered point, the ECG scattered point selected by the user can also be determined.
[0076] In S502, the ECG signal segment corresponding to each ECG scatter point selected by the user is displayed in the first window, and the ECG signal segment includes the QRS complex corresponding to the ECG scatter point.
[0077] In this embodi...
Embodiment 3
[0081] In this embodiment, on the basis of the second embodiment of the present invention, the display modes of the first window, the second window and the ECG scattergram are further limited, as follows Image 6 shown, including:
[0082] In S601, the ECG signal is displayed in a second window.
[0083] In this embodiment, the second window may be called an ECG waveform window. The original ECG signals used to generate the above ECG scattered points are displayed in the second window, and the second window has a preset scroll bar. By default, because the ECG signal has a relatively long time length, only a part of the ECG signal is displayed, and this part of the segment contains the ECG signal segment selected by the user in the first window above. QRS complex, and locate the QRS complex in the form of a marked box.
[0084] When the scroll bar dragging instruction sent by the user is received, the remaining segments in the ECG signal will be displayed. Therefore, the use...
PUM
 Abstract
Description
Claims
Application Information
 - R&D
- Intellectual Property
- Life Sciences
- Materials
- Tech Scout
- Unparalleled Data Quality
- Higher Quality Content
- 60% Fewer Hallucinations
Browse by: Latest US Patents, China's latest patents, Technical Efficacy Thesaurus, Application Domain, Technology Topic, Popular Technical Reports.
© 2025 PatSnap. All rights reserved.Legal|Privacy policy|Modern Slavery Act Transparency Statement|Sitemap|About US| Contact US: help@patsnap.com


