

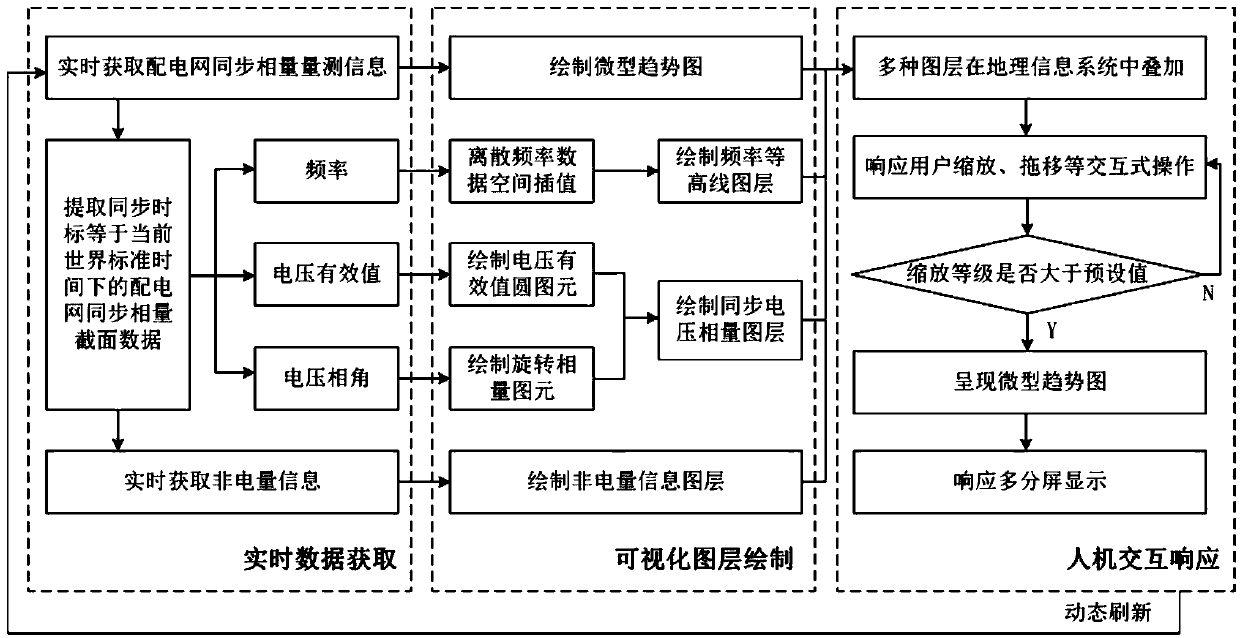
Visualization method for real-time state monitoring of synchronous phasor of power distribution network
A synchrophasor and real-time state technology, applied in the direction of measuring electrical variables, measuring electricity, measuring devices, etc., can solve problems such as lack of solutions, and achieve the effect of easy drawing, simple and intuitive graphic elements, and efficient production
- Summary
- Abstract
- Description
- Claims
- Application Information
AI Technical Summary
Problems solved by technology
Method used
Image


Examples
Embodiment Construction
[0057] It should be pointed out that the following detailed description is exemplary and intended to provide further explanation to the present application. Unless defined otherwise, all technical and scientific terms used herein have the same meaning as commonly understood by one of ordinary skill in the art to which this application belongs.
[0058] It should be noted that the terminology used here is only for describing specific implementations, and is not intended to limit the exemplary implementations according to the present application. As used herein, unless the context clearly dictates otherwise, the singular is intended to include the plural, and it should also be understood that when the terms "comprising" and / or "comprising" are used in this specification, they mean There are features, steps, operations, means, components and / or combinations thereof.
[0059] The purpose of the present invention is to solve the problem that distribution network synchrophasor data...
PUM
 Abstract
Description
Claims
Application Information