Method and system for predicting and statistically analyzing passenger flow of station

A technology of statistical analysis and passenger flow, applied in the field of passenger flow prediction and statistical analysis of stations, which can solve the problems of not being able to arrive and handle in time, restricting the development of railway transportation, and increasing manpower.

Inactive Publication Date: 2018-12-07
北京万相融通科技股份有限公司
View PDF9 Cites 5 Cited by
  • Summary
  • Abstract
  • Description
  • Claims
  • Application Information

AI Technical Summary

Problems solved by technology

[0002] With the rapid development of railway transportation such as bullet trains and high-speed railways, railways have always been the main means of transportation for people to travel with the advantages of safety, speed, comfort and low price. According to official data released, the passenger flow of national railway spring travel in 2013 reached 240 million , an increase of 12.1% year-on-year. In 2014, the national railway Spring Festival passenger flow reached 266 million, and the passenger flow increased year by year. In 2015, the national railway Spring Festival passenger flow reached 295 million, and the passenger flow reached more than 8 million in a single day. The railway station is also overcrowded, which has brought enormous pressure to the railway work. In order to maintain the order of passengers in the station and ensure the safety of passengers, and increase manpower and material resources to guide them, monitoring equipment is generally installed in the station, and the monitoring equipment will be real-time. It is transmitted to the central control room, but when the staff finds an area that needs to be evacuated from the central control room, when notifying other staff in the station to deal with it, it is often impossible to arrive and deal with it in time due to too many passengers, especially when illegal incidents occur. It was solved in a timely manner; the passenger flow could not be evacuated in time, which made the station staff and passengers exhausted, restricting the development of railway transportation

Method used


Image

  • Method and system for predicting and statistically analyzing passenger flow of station
  • Method and system for predicting and statistically analyzing passenger flow of station
  • Method and system for predicting and statistically analyzing passenger flow of station

Examples


Embodiment 1

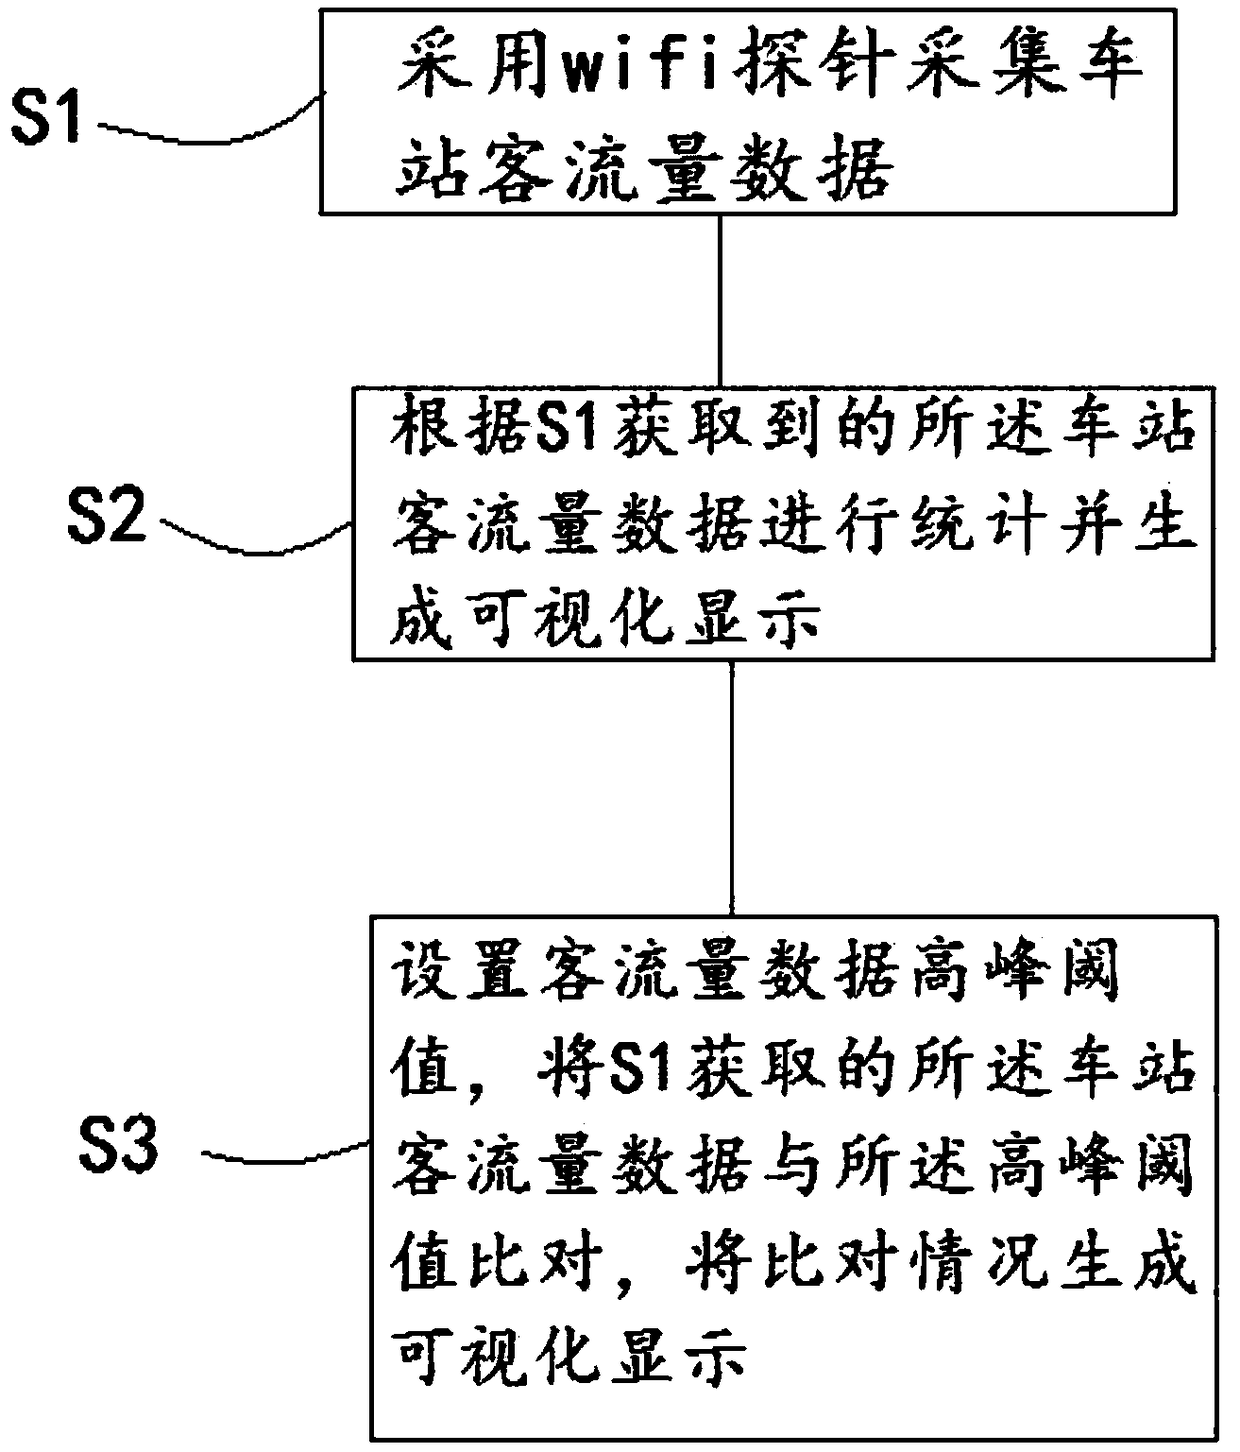
[0052] Embodiment one: a kind of station passenger flow prediction and the method for statistical analysis provided by the present invention, refer to figure 1 shown, including the following steps:

[0053] S1, using wifi probes to collect station passenger flow data;

[0054] S2. Perform statistics and generate a visual display according to the station passenger flow data obtained in S1;

[0055] S3. Setting a peak threshold of passenger flow data, comparing the station passenger flow data obtained in S1 with the peak threshold, and generating a visual display of the comparison.

[0056] When the method of the present invention is actually applied, wifi probes are arranged in each area of ​​the station, such as the ticket checking machine entering the station, the waiting room, and each shop in the station. signal, the probe message will carry the mac address of the WiFi chip of the mobile terminal. Since the mac address is unique, statistical analysis can be performed base...

Embodiment 2

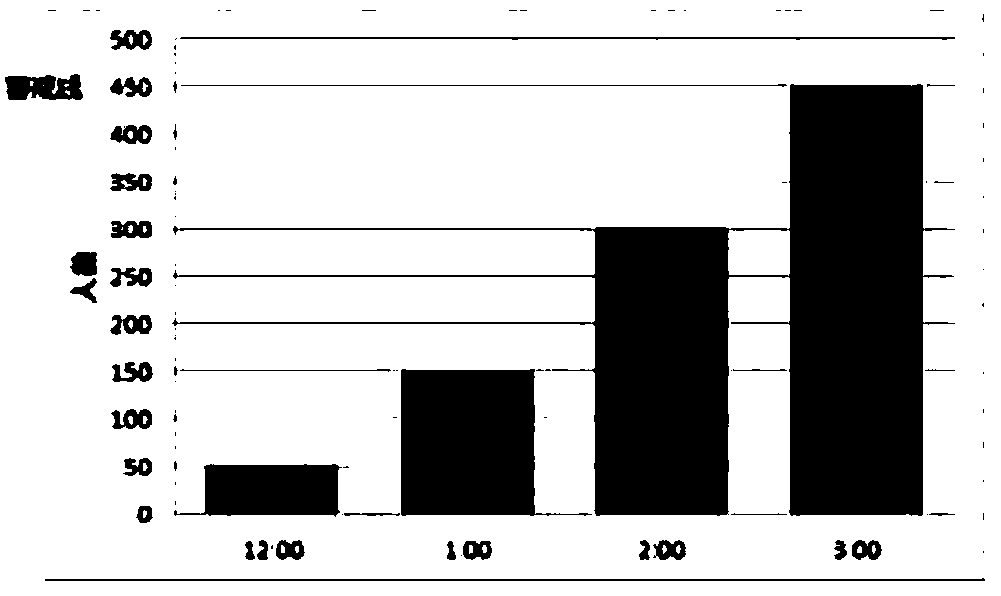
[0061] Embodiment 2: In addition to the method of the present invention disclosed in Embodiment 1, in order to further optimize the present invention, the passenger flow data of the station acquired by S1 is stored in the S2, and the distribution of the historical passenger flow data in the whole station is counted and summarized. Generate a visual display. According to the stored historical passenger flow data, the passenger flow data of each area of ​​the station can be counted, so that the station staff can clearly understand which area of ​​the station has the most passenger flow in the past time.

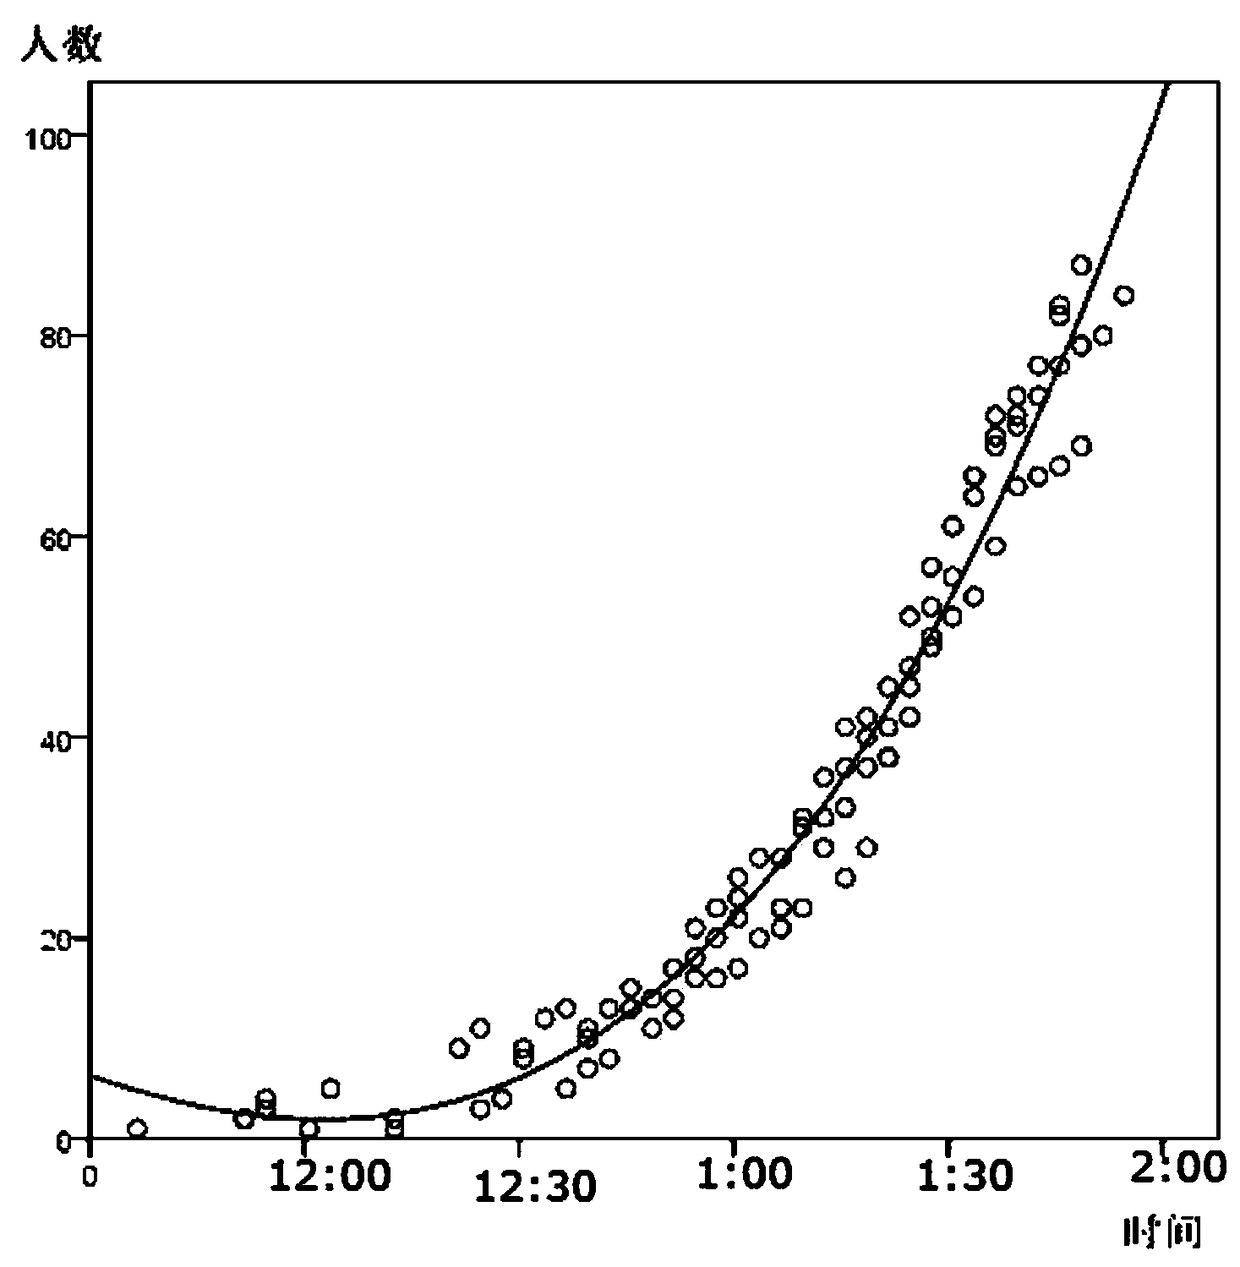
[0062] Further, said S2 also includes establishing a functional relationship between time and passenger flow data according to the historical station passenger flow data, and generating a visual display.

[0063] In said S2, according to the functional relationship between time and passenger flow data, the passenger flow data at a future moment is predicted. For example imag...

Embodiment 3

[0065] Embodiment 3: In addition to the content disclosed in Embodiment 1 and Embodiment 2, in order to further optimize the present invention, the method also includes S4, generating a visual display of the passenger movement path according to the wifi probe sites used in S1. When the Wifi probe searches for the signal of the mobile terminal, it will record the mac address of the mobile terminal. Due to the uniqueness of the mac address, when the same mobile terminal is detected at the installation place of the wifi probe, the location of the mobile terminal can be recorded, for example, it is installed at the ticket gate The wifi probe at the gate detects a mobile terminal carried by a passenger, and when the passenger moves to the waiting room, the wifi probe installed in the waiting room will search for the passenger's mobile terminal again, and the method of the present invention can record the passenger's mobile terminal. Passengers move from the ticket gate to the waitin...


PUM


Abstract

The invention discloses a method for predicting and statistically analyzing a passenger flow of a station. The method comprises: S1, collecting passenger flow data of a station by using a wifi probe;S2, performing statistics according to the passenger flow data obtained by the S1 and generating visual displaying; and S3, setting a peak value of the passenger flow data, comparing the passenger flow data obtained by the S1 of the station with the peak value of the passenger flow data and carrying out visual displaying on the comparison situation. The method has the following advantages: passenger flow data of all periods of time can be obtained in real time; various statistic analyses are carried out on the passenger flow data according to the needs; the workload of the staff is reduced; the station staff can understand the passenger flow information timely and clearly and thus the manpower and materials are adjusted timely; the passenger flow can be evacuated effectively; and the station works stably in an order.

Description

technical field [0001] The invention belongs to the technical field of railway intelligent monitoring, and specifically relates to a method for predicting and statistically analyzing passenger flow at a station. Background technique [0002] With the rapid development of railway transportation such as bullet trains and high-speed railways, railways have always been the main means of transportation for people to travel with the advantages of safety, speed, comfort and low price. According to official data released, the passenger flow of national railway spring travel in 2013 reached 240 million , an increase of 12.1% year-on-year. In 2014, the national railway Spring Festival passenger flow reached 266 million, and the passenger flow increased year by year. In 2015, the national railway Spring Festival passenger flow reached 295 million, and the passenger flow reached more than 8 million in a single day. The railway station is also overcrowded, which has brought enormous pres...

Claims


Application Information

Patent Timeline
Patent Type & Authority Applications(China)
IPC IPC(8): H04W24/08H04W4/029H04W4/02H04W64/00H04L12/26
CPCH04L43/045H04W4/023H04W24/08H04W64/006H04W4/029
Inventor 闫少建李霈马玉田周聪王建军杜秋超赵金龙张景利
Owner 北京万相融通科技股份有限公司
Why Eureka
Try Eureka