Application method for automatic statistics and multi-dimensional visualization display of power network dispatch data

A technology for grid scheduling and application methods, applied in data processing applications, computing, information technology support systems, etc., can solve problems such as low efficiency, heavy workload for manual data transmission, and difficulty in ensuring accuracy, so as to improve work efficiency Effect

Inactive Publication Date: 2019-01-08
GUANGDONG POWER GRID CO LTD +1
View PDF7 Cites 5 Cited by
  • Summary
  • Abstract
  • Description
  • Claims
  • Application Information

AI Technical Summary

Problems solved by technology

[0003] In the traditional way, power grid operators need to obtain point-by-point queries through the SCADA (Supervisory Control And Data Acquisition, SCADA) system, and analyze them manually, which requires a lot of manpower and material resources, and the efficiency is low, which seriously restricts the level of power grid management
At the same time, when the functional management departments of the power grid, such as equipment, marketing, and planning departments need power grid-related data, they need to extract relevant data through SCADA through the power grid dispatching department, and then integrate and analyze the relevant data before exporting relevant data to relevant departments. Manual transmission of

Method used


Image

  • Application method for automatic statistics and multi-dimensional visualization display of power network dispatch data

Examples


Embodiment 1

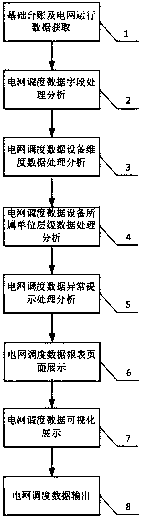
[0037] Such as figure 1 As shown, an application method for automatic statistics and multi-dimensional visualization display of power grid dispatching data includes the following steps:

[0038] S1: Obtain basic grid data;

[0039] S2: Analyzing and processing the data obtained in step S1;

[0040] S3: Multi-dimensional visual display of the result of step S2.

[0041] The specific process of step S1 is:

[0042] (1) By establishing a data interface with the SCADA system, obtain the operation data of the power grid operation equipment, including the voltage and current data of the equipment;

[0043] (2) By establishing a data interface with the power grid production system, obtain the grid equipment ledger, including the relationship between the regional bureau and power supply station to which the equipment or site belongs; through the data association with the power grid production system, automatically match power outage maintenance, fault tripping, and peak-shift power...


PUM


Abstract

The invention provides an application method for automatic statistics and multi-dimensional visualization display of power network dispatching data. The method obtains power network basic account dataand power network operation data by establishing a data interface with a SCADA system and a power network production system. After the data is obtained, and combs the running data fields. The main operation data fields are: day, month, annual maximum current, month, annual maximum current time and year-on-year comparison, day, month, annual maximum load time and year-on-year comparison, day, month, annual maximum load rate, day, month, annual load rate, month, annual minimum current and time, allowable current load, daily current curve, day, month, electricity quantity, month and year-on-yearcomparison, etc. At the same time, when the power network operation data changes abnormally, the red prompt will appear automatically, and all kinds of data have the function of modification.

Description

technical field [0001] The invention relates to the field of power system management, and more specifically, to an automatic statistics and multi-dimensional visualization display application method for power grid dispatching data. Background technique [0002] Power grid equipment in operation generates a large amount of operation scheduling data all the time, such as voltage, current, load, power and other operating data generated by the equipment in real time; at the same time, a lot of operational statistical data will be derived from the real-time data, such as the highest interval voltage and minimum voltage, the highest and lowest current in the interval, the highest and lowest load in the interval, the accumulated electricity in the interval, the highest and lowest load ratio in the interval, the average load ratio and load ratio in the interval, and other data; in addition, the above data need to pass through different Statistics are carried out at different levels,...

Claims


Application Information

Patent Timeline
IPC IPC(8): G06Q50/06G06Q10/06
CPCG06Q10/06G06Q50/06Y04S10/50
Inventor 汤志锐邱桂华吴海江唐鹤何炎宋永禄聂家荣
Owner GUANGDONG POWER GRID CO LTD
Why Eureka
Try Eureka