
Multi-modal data fusion method based on moving complex correlation coefficients

A complex correlation coefficient and data fusion technology, applied in character and pattern recognition, instruments, computer components, etc., can solve problems such as ignoring local data and features, fuzzy and uncertain factors to be analyzed, and weak correlation

Inactive Publication Date: 2019-02-22
BEIJING NORMAL UNIVERSITY
View PDF0 Cites 0 Cited by
  • Summary
  • Abstract
  • Description
  • Claims
  • Application Information

AI Technical Summary

Problems solved by technology

[0005] 1) The overall calculation method is adopted, ignoring the local data and features
[0006] 2) It is only for the overall correlation calculation between two factors, ignoring the "one-to-many" local space calculation, which may lead to the weakening of the correlation under the joint action of certain factors
[0007] 3) Data fusion only considers the compression of data in dimensions, which makes the factors to be analyzed blurred and uncertain

Method used


Image

  • Multi-modal data fusion method based on moving complex correlation coefficients
  • Multi-modal data fusion method based on moving complex correlation coefficients
  • Multi-modal data fusion method based on moving complex correlation coefficients

Examples


specific Embodiment approach

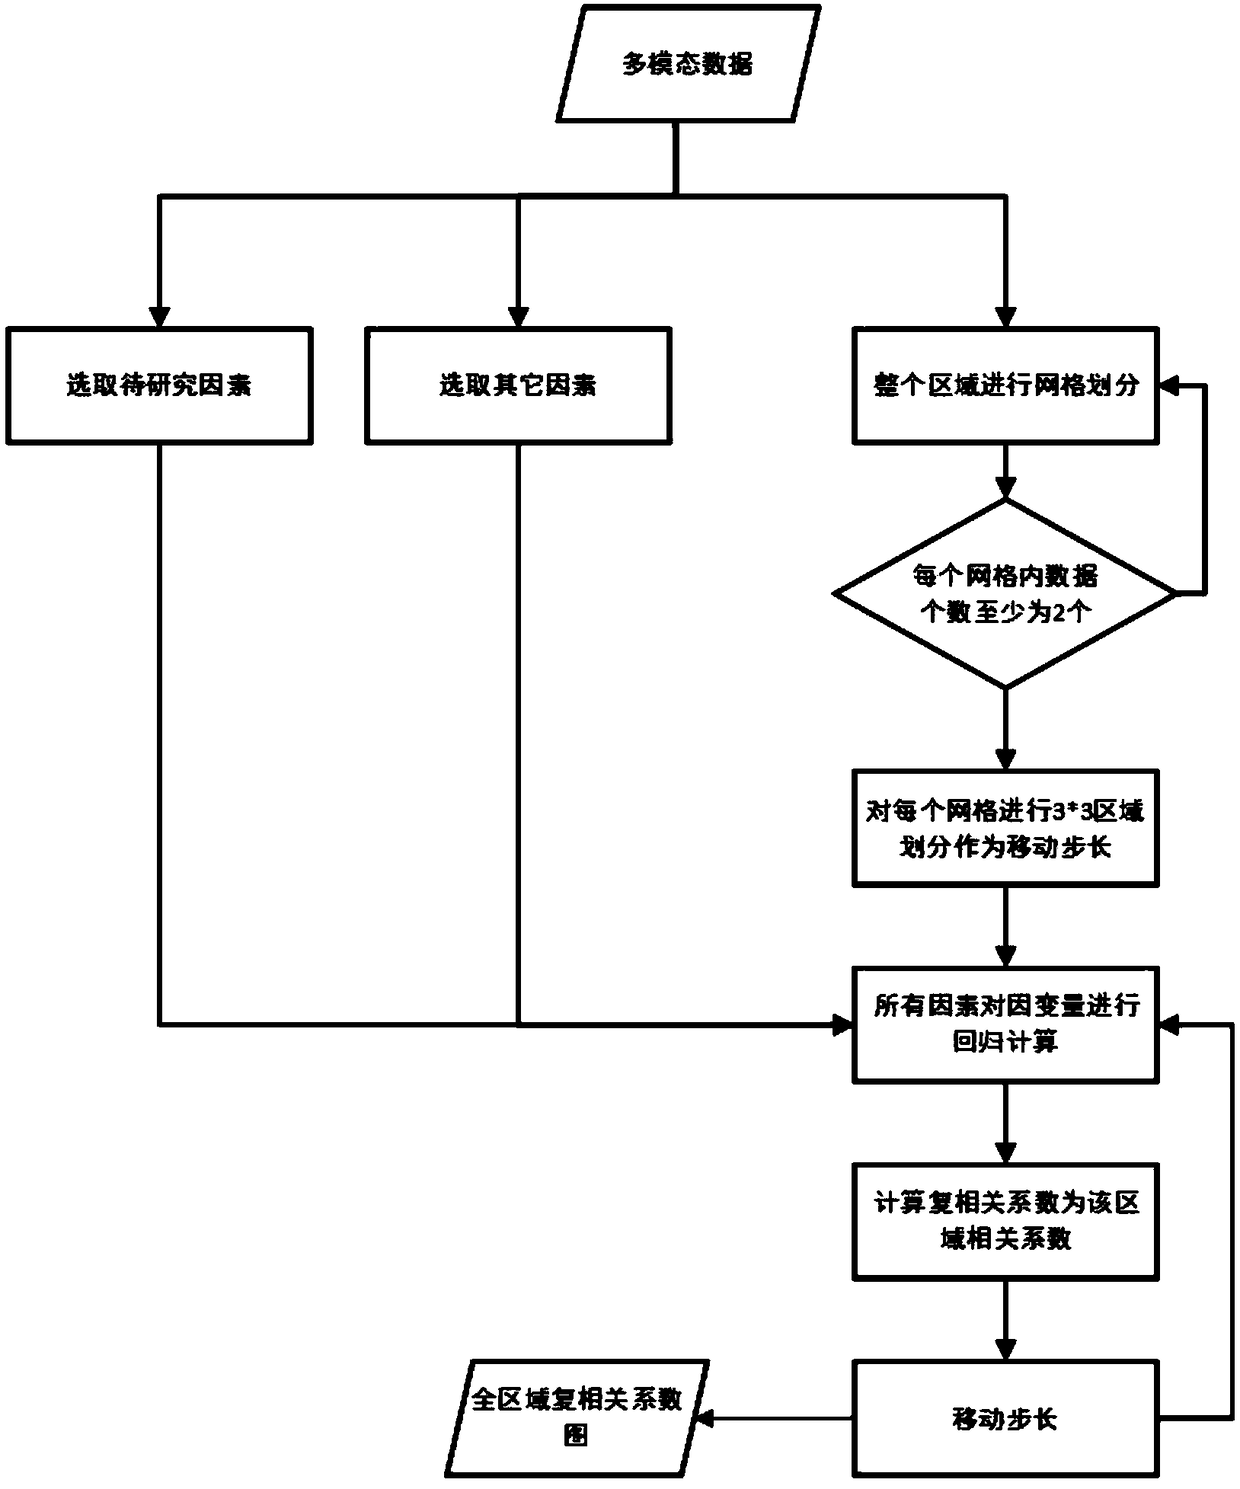
[0014] 1) Map each source data value to the plane through coordinate mapping, grid the plane data, and convert the gridded data into a matrix.

[0015] 2) Define a window representing the local range on the basis of the grid, and read the values ​​of all sampling factors in the grid, each factor is recorded as X 1 , X 2 …X n , where the factor to be analyzed is y, and the other factors are X 1 , X 2 …X n

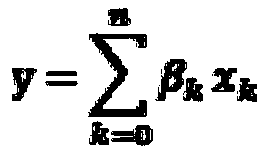
[0016] 3) For n types of factors, y is the dependent variable and the rest are independent variables, use the following formula to perform regression.

[0017]

[0018] 4) Use the following formula to calculate the multiple correlation coefficient between y and other factors.

[0019]

[0020] 5) Replace the correlation coefficient value of the local window with this coefficient

[0021] 6) Traverse the entire sampling area and calculate the complex correlation coefficient of each window

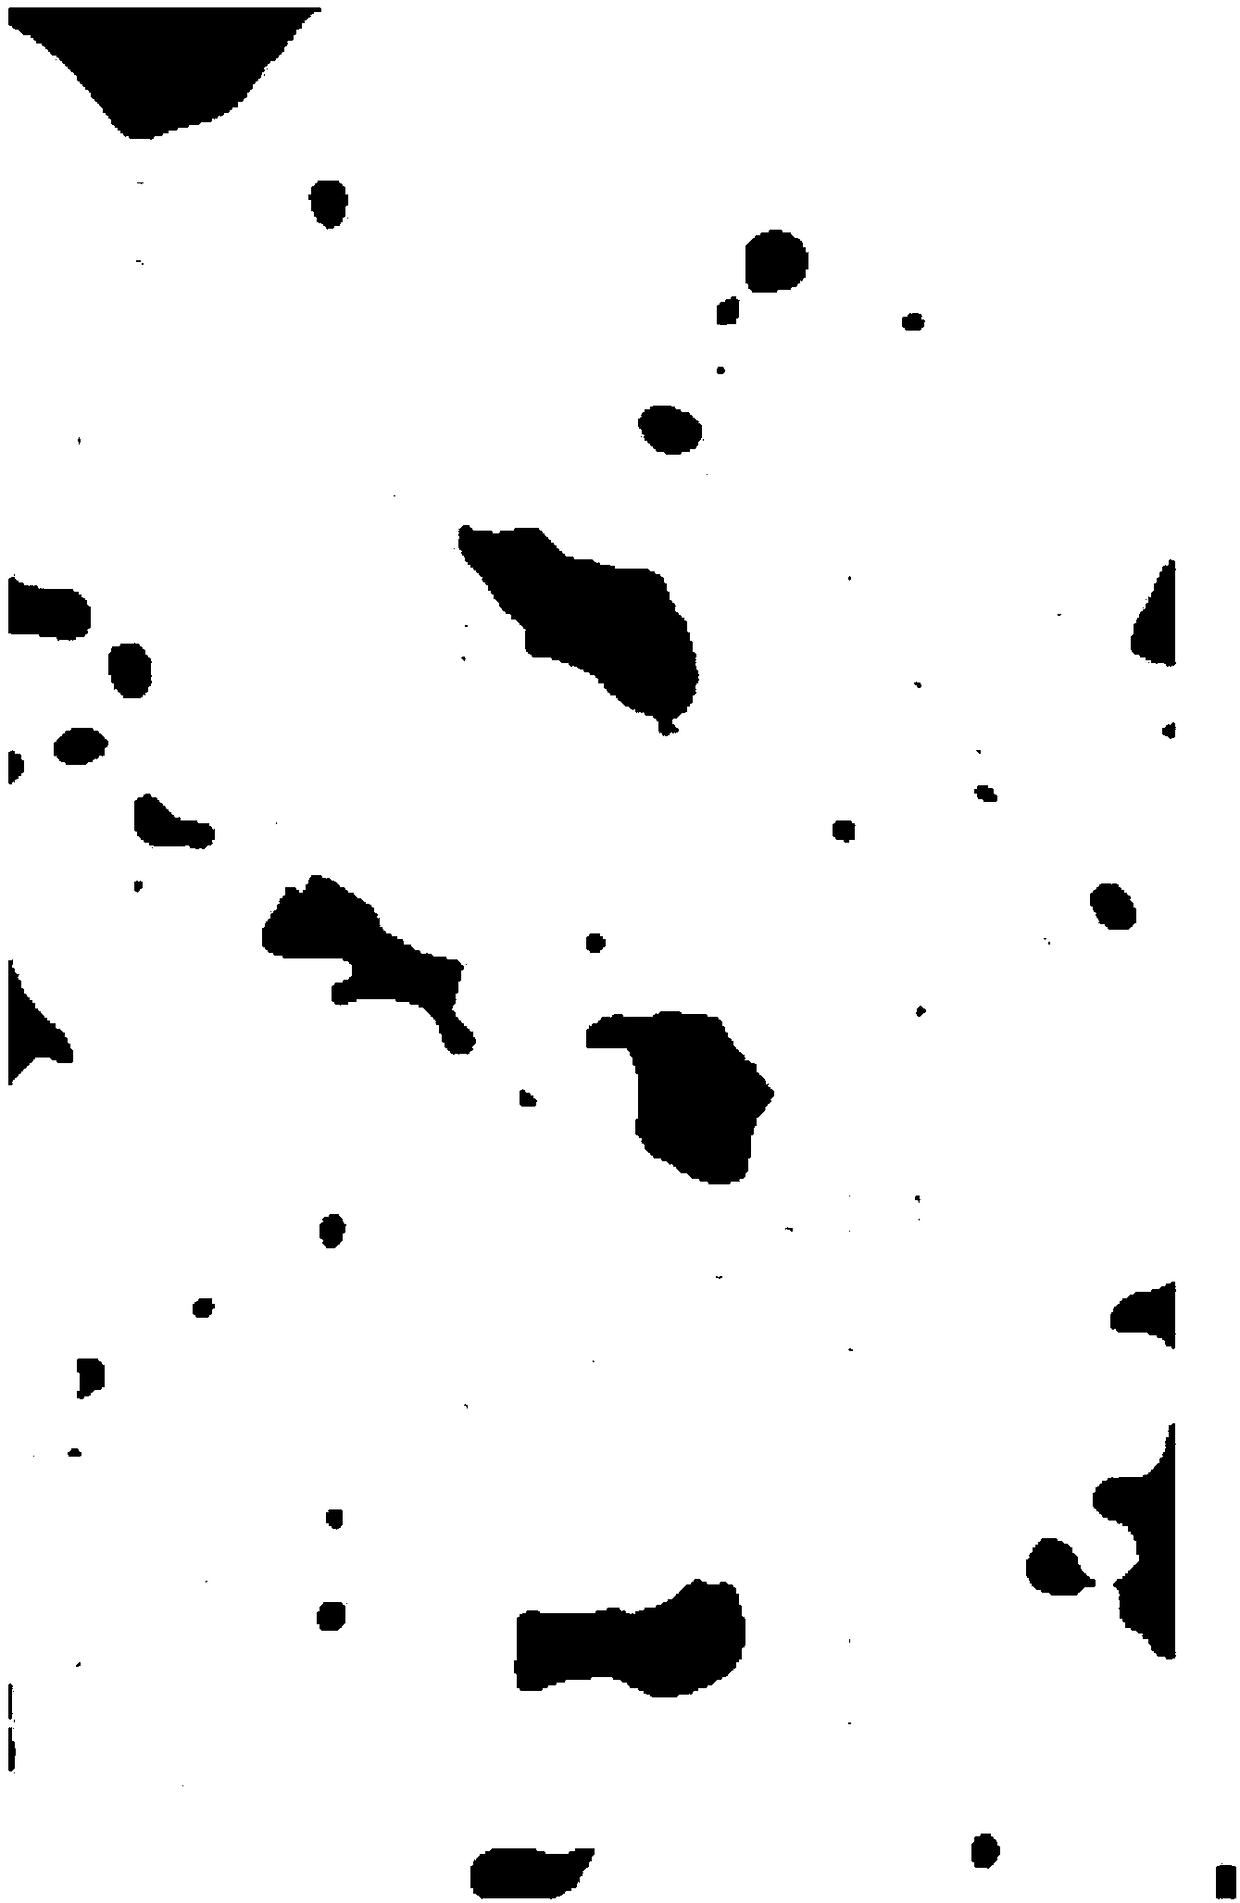
[0022] 7) Draw a graph to show the correlation coefficient results.


PUM


Abstract

The invention discloses a multimodal data fusion method based on moving complex correlation coefficient, belonging to a spatial data fusion analysis method. In a certain spatial range of data, one thing is often affected by a variety of other data factors, and is related to the spatial location within a specific range. Traditional methods only focus on the measurement of the correlation between two factors to thereby ignore the correlation between one factor and many factors, and the global scope of the analysis is easy to make local. Therefore, the method proposes a multi-modal data local correlation analysis method based on moving complex correlation coefficients. The method comprises defining the calculation window, calculating the complex correlation coefficient between one factor andall other factors in the window area, traversing the sampling area to form the complex correlation coefficient matrix, and analyzing the correlation between one factor and other factors. The method introduces the local spatial feature of the data, and shows the one-to-many correlation among the multi-modal data through the calculation of the local complex correlation coefficients.

Description

Technical field: [0001] The invention belongs to a space data fusion analysis method with position information, and relates to the correlation analysis of multiple factors in the same space area. Background technique: [0002] For a thing, there are observation data from multiple sources, that is, the data has multiple modes, and the same thing is also affected by multiple indicators. At the same time, for data in a specific space, it is more meaningful to analyze the data correlation in a local area than the global analysis. Therefore, analyzing multimodal data fusion methods within a certain spatial range is crucial to comprehensively analyze the correlation between things. [0003] The combination relationship between things within a certain space range is often reflected by the correlation relationship between different factors, and the relationship often exists within the same space range. In the existing correlation analysis methods, the researchers only considered t...

Claims


Application Information

Patent Timeline
IPC IPC(8): G06K9/62
CPCG06F18/25
Inventor 余先川武康姚旺
Owner BEIJING NORMAL UNIVERSITY
Learn More