A method for monitoring micro-leakage of a gas meter

A gas meter and tiny technology, which is applied in the direction of instruments, measuring devices, testing/calibrating devices, etc., can solve the problems of insensitivity and inaccuracy in micro leak detection, and achieve the effect of reduced maintenance content, low power consumption and good detection effect

Active Publication Date: 2020-05-29
GOLDCARD HIGH TECH
View PDF10 Cites 0 Cited by
  • Summary
  • Abstract
  • Description
  • Claims
  • Application Information

AI Technical Summary

Problems solved by technology

[0004] The technical problem to be solved by the present invention is to provide a method for monitoring micro-leakage by a gas meter, which solves the problem of insensitivity and inaccuracy in the detection of micro-leakage existing in the prior art

Method used


Image

  • A method for monitoring micro-leakage of a gas meter
  • A method for monitoring micro-leakage of a gas meter
  • A method for monitoring micro-leakage of a gas meter

Examples


Embodiment 1

[0031] This embodiment adopts a short-time real-time detection method, and compares the sampling statistical data with a preset threshold to monitor whether there is a tiny leak.

[0032] A method for monitoring tiny leaks with a gas meter, comprising the following steps:

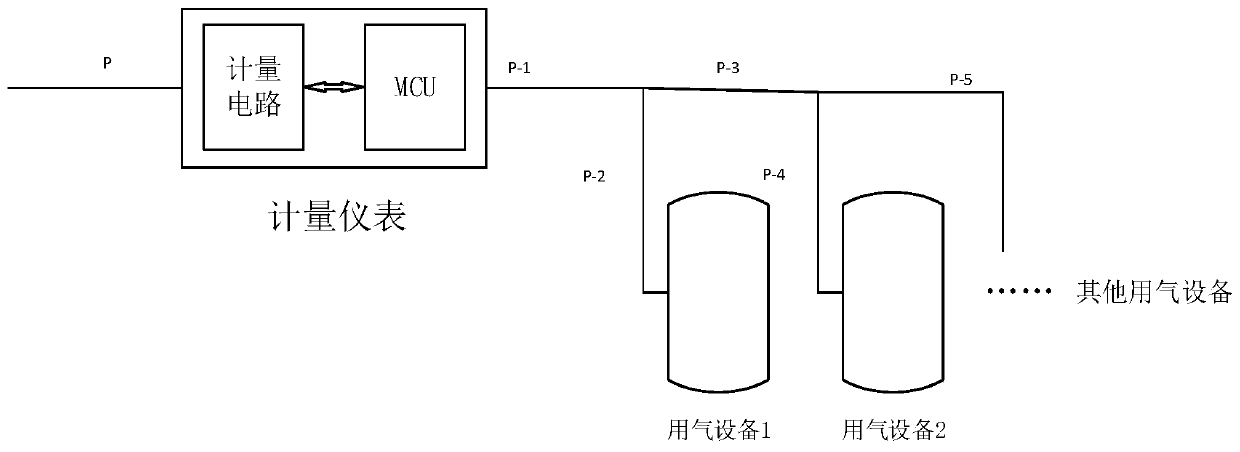
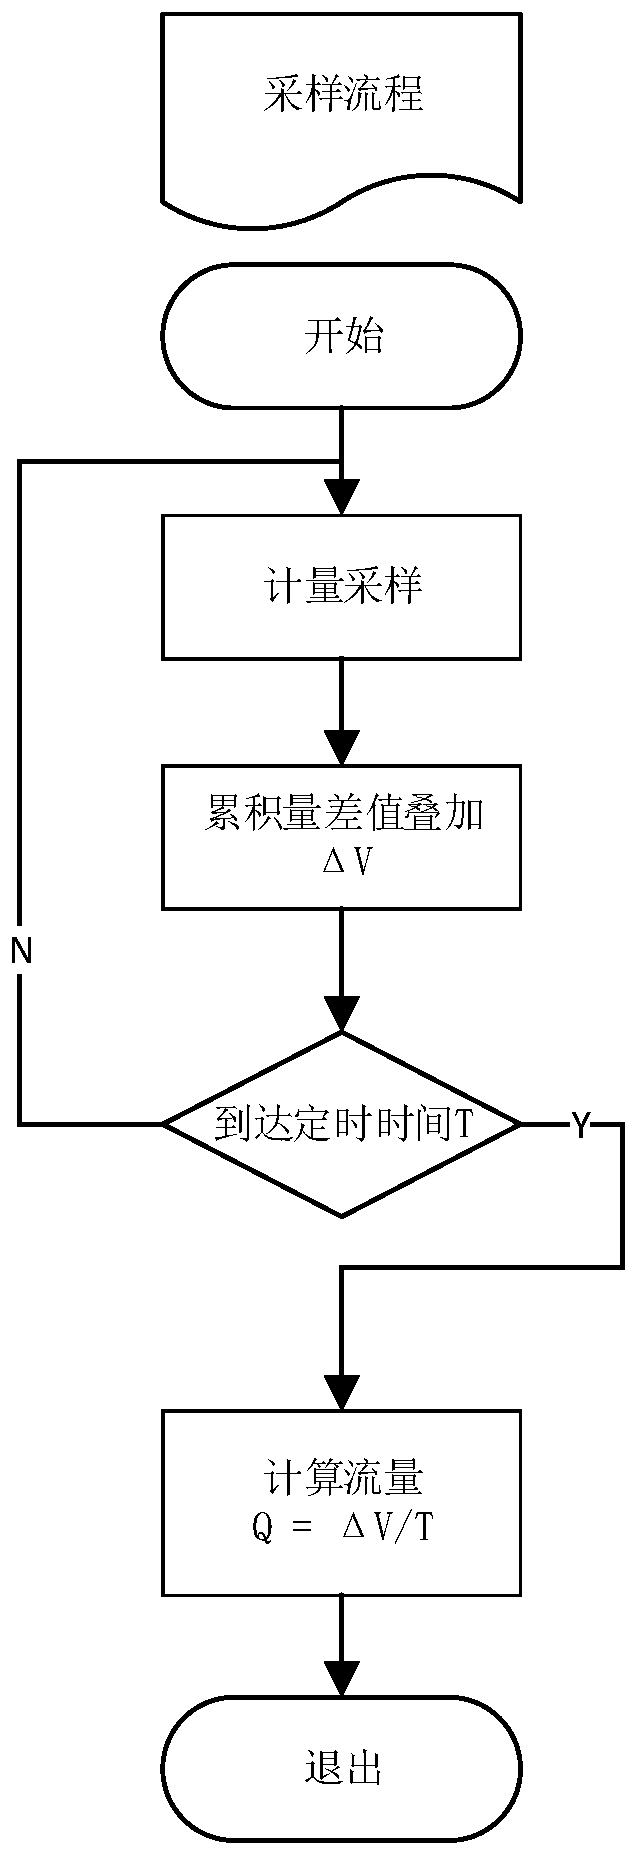
[0033] Step 1: The metering circuit collects gas consumption statistics within the time period △t1, and the processor converts the flow value Q1 within the time period △t1 through the formula: flow = cumulative amount within the time period △t1 / △t1, and completes a flow information records, the process is as follows figure 2 shown.

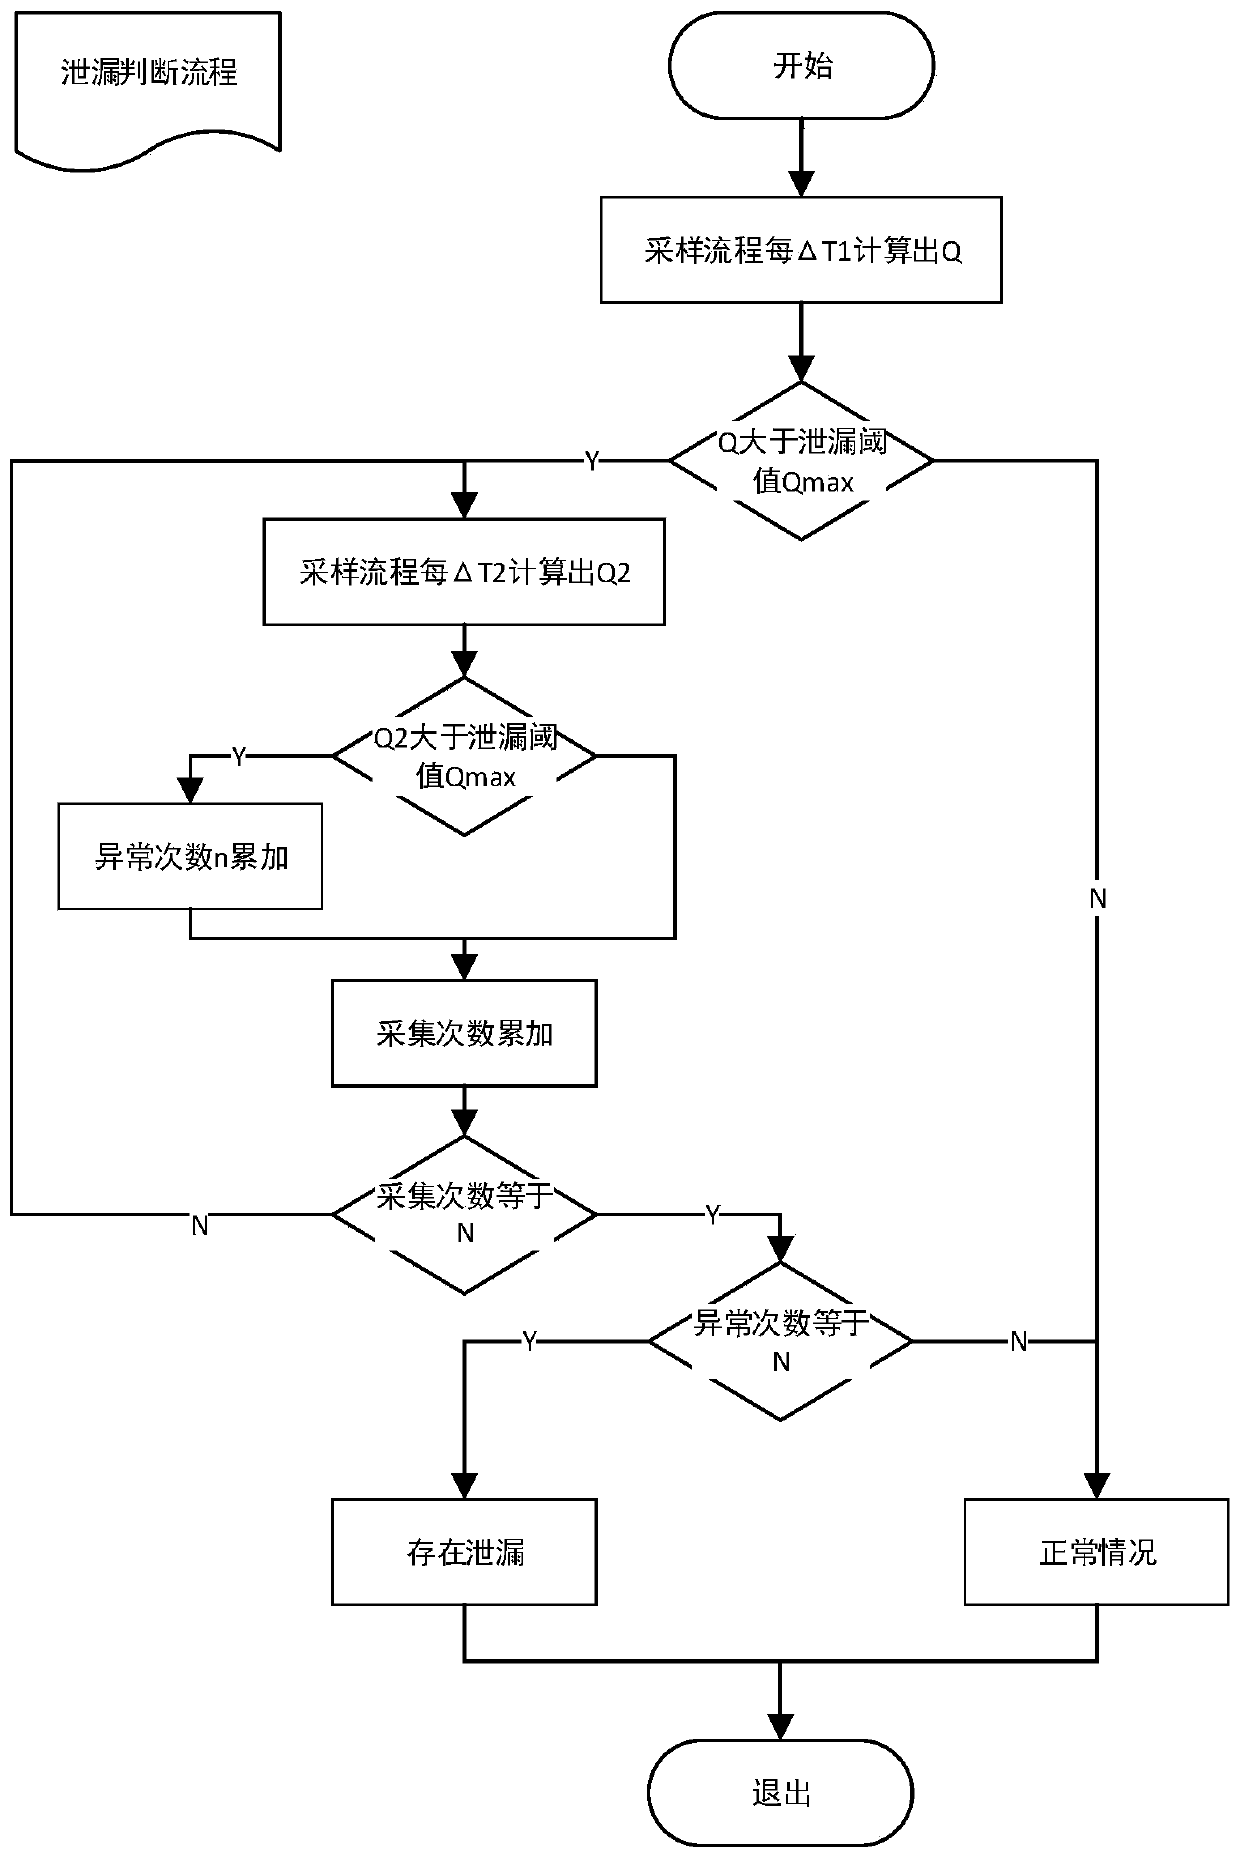
[0034] Step 2: Comparing the calculated flow value Q1 with the leakage threshold Qmax, and when the flow value Q1 is greater than the leakage threshold Qmax, go to step 3.

[0035] Step 3: Perform acceleration detection, the metering circuit continuously collects the gas consumption in the time period △t2 for N times, where △t2 is less than △t1, the processor calculates the ...

Embodiment 2

[0043] Embodiment two, refer to Figure 4 As shown, this embodiment adopts the variance value and average price comparison method, and uses the gas meter to monitor the flow in real time to improve safety and detection efficiency.

[0044] A method for monitoring tiny leaks with a gas meter, comprising the following steps:

[0045] Step S1, the metering circuit collects the gas consumption at the set time every day, and the processor calculates the flow value samples {Q1,...,Qn} within a day according to the formula: Q=△V / △t, where △V means Set the gas volume for the time, △t means the length of the set time, n means the nth sample, and calculate the variance value S and the average value M of the n samples;

[0046] Step S2, keep the variance value and average value calculated every day to obtain a set of data {(S1,M1),(S2,M2),...,(Sx,Mx)}, where x represents the xth day ;

[0047] Step S3, compare the variance values ​​Sa and Sb of any two days, where a and b represent sp...

Embodiment 3

[0053] Embodiment 3, this embodiment combines Embodiment 1 and Embodiment 2, that is, the two detection methods in Embodiment 1 and Embodiment 2 are carried out at the same time, as long as any detection method detects a leak, the valve is closed and processed. Sound the alarm. Since the two detection methods are integrated, the advantages of the two detection methods can be combined, and the disadvantages of the two detection methods can be avoided, so that the detection effect is better and the safety is higher.


PUM


Abstract

The invention discloses a method for monitoring micro-leakage by a gas meter. The gas meter includes a metering circuit and a processor. The method for monitoring micro-leakage includes the following steps: step S1, the metering circuit collects gas consumption at a set time every day, and the processor according to Formula: Q=△V / △t calculates the flow value samples {Q1,...,Qn} within a day, where △V indicates the gas consumption at the set time, △t indicates the length of the set time, and n indicates the nth samples, and calculate the variance value S and average value M of n samples; step S2, keep the variance value and average value calculated every day, and obtain a set of data {(S1,M1),(S2,M2 ),...,(Sx,Mx)}, wherein x represents the xth day; step S3, comparing the variance values ​​Sa and Sb of any two days wherein a and b represent specific dates, if Sa=Sb, it is considered that the gas is used If the habits are the same, then compare the average values ​​Ma and Mb of the corresponding two days. If Ma>Mb and a>b, it means that there is a static deviation on the basis of the same gas usage habits of the user, that is, there is a small leak. The invention can improve the sensitivity and accuracy of micro leak detection.

Description

technical field [0001] The invention relates to gas safety technology, in particular to a method for monitoring tiny leakage of a gas meter. Background technique [0002] Gas safety is the top priority of the gas industry. At present, for the leakage caused by the aging and looseness of the hose in the user's home, and the leakage caused by forgetting to turn off the gas equipment, the common solution is to monitor the flow through the display data. Implement leak detection. However, there is a problem in this method. If the user or maintenance personnel modifies the display data in the middle of the test, it will cause an error in the calculation of the usage rate, for example: R(t)=(v(t)–v(t-Δt) ) / Δt, in the middle of the calculation, due to personnel operation, the display data at time t is changed to: v(t)+Δt. At this time, the calculated R(t) is wrong, and false alarms are likely to occur. [0003] In the prior art, for the detection of micro-flow leakage, the purpose...

Claims


Application Information

Patent Timeline
Patent Type & Authority Patents(China)
IPC IPC(8): G01F25/00
CPCG01F25/15
Inventor 杨金龙李忠园张文学胡中卫崔艳
Owner GOLDCARD HIGH TECH
Why Eureka
Try Eureka