Temperature distortion spectrum inverse design method based on discrete sequence
A discrete sequence and anti-design technology, applied in computer-aided design, design optimization/simulation, calculation, etc., to shorten the test cycle, avoid waste of manpower and material resources, and reduce test costs
- Summary
- Abstract
- Description
- Claims
- Application Information
AI Technical Summary
Problems solved by technology
Method used
Image

Examples
Embodiment Construction
[0023] The following embodiments will further illustrate the present invention in conjunction with the accompanying drawings.
[0024] Embodiments of the present invention include the following steps:
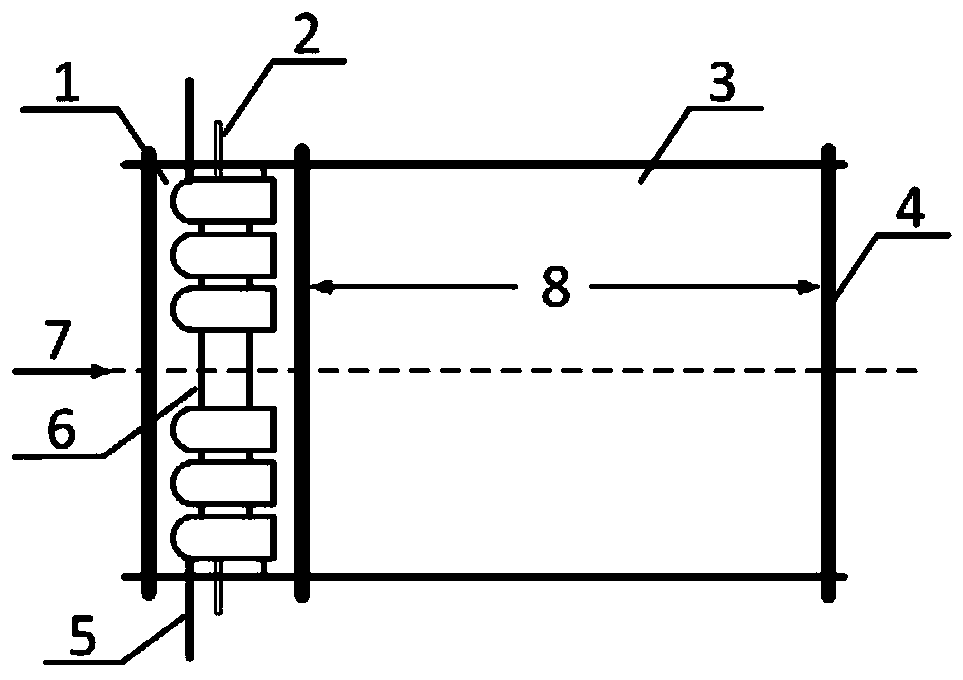
[0025] 1) Determine the incoming flow velocity and the distance between the upstream distortion section and the downstream map section according to the given measurement section temperature map distribution;
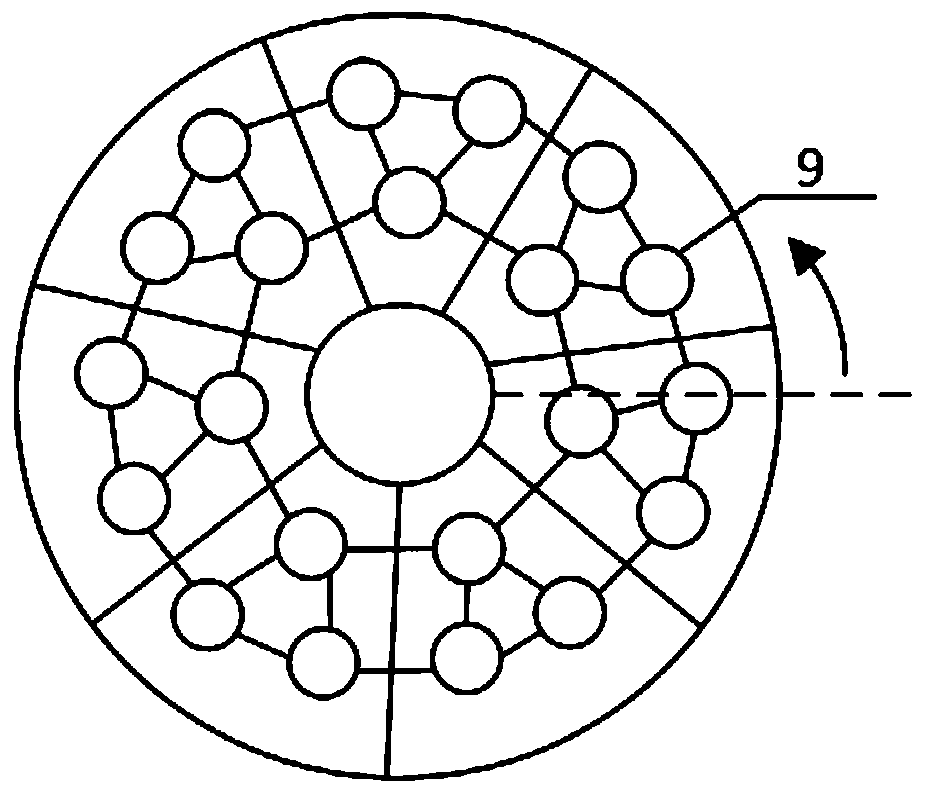
[0026] 2) Generate the nozzle number M and nozzle distribution according to the temperature, number the arrangement and distribution of the nozzles sequentially, and set the heat flow combination sequence of each nozzle as a vector α;
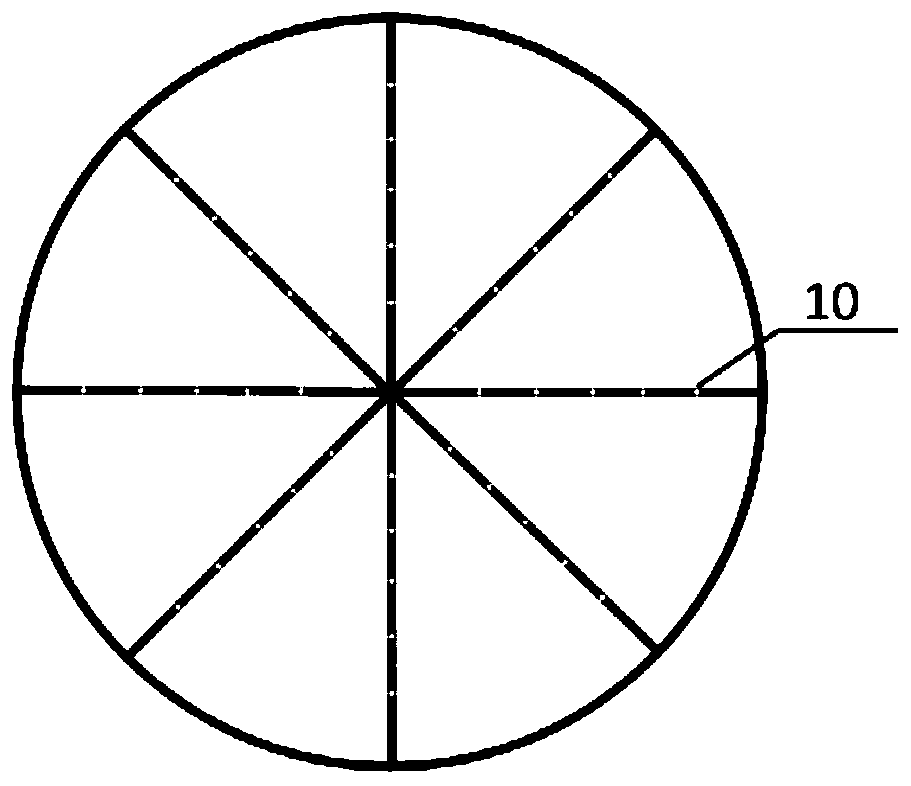
[0027] 3) Divide the downstream target map section into units of magnitude N, and use the horizontal direction as the zero-angle line to sort the micro-units outward, and use interpolation based on the temperature distortion map The way to assign temperature to N units, and record it as the map column vector β;
[0028] 4) Construct the ...
PUM
 Abstract
Description
Claims
Application Information
PatSnap Eureka turns technology decisions into work you can execute. Powered by our Innovation Knowledge Graph, it runs expert workflows across engineering, life sciences, materials and intellectual property. Get your review-ready output in minutes.


