Method for calculating and displaying beam-Kriging information flow through multi-scale sliding window

An information flow, multi-scale technology, applied in the field of data analysis, can solve problems such as difficult evaluation, long time series, and difficult verification of preconditions

Active Publication Date: 2019-12-06
THE FIRST INST OF OCEANOGRAPHY SOA +1
View PDF0 Cites 2 Cited by
  • Summary
  • Abstract
  • Description
  • Claims
  • Application Information

AI Technical Summary

Problems solved by technology

Its shortcoming is that for those time series with a certain period, we cannot determine the leading and lagging problems, so we cannot determine who is the cause and who is the effect of the two dynamic processes; (2) Granger causality test (Granger Causality Analysis): The disadvantage of this method is that it only gives two sequences who is the cause and who is the effect, and lacks quantification; moreover, the preconditions to be met by this method are often difficult to verify
(3) Transfer entropy: This method requires a long time series, and it is difficult to evaluate the results
(4) Information flow (information flow / information transfer): This method not only gives the direction of two time series information propagation, but also gives the size, so it is considered to be a suitable causal measurement method; but its measurement is based on based on empirical or semi-empirical formulas, without a solid theoretical basis

Method used


Image

  • Method for calculating and displaying beam-Kriging information flow through multi-scale sliding window
  • Method for calculating and displaying beam-Kriging information flow through multi-scale sliding window
  • Method for calculating and displaying beam-Kriging information flow through multi-scale sliding window

Examples


Embodiment Construction

[0020] The present invention will be described in detail below in combination with specific embodiments.

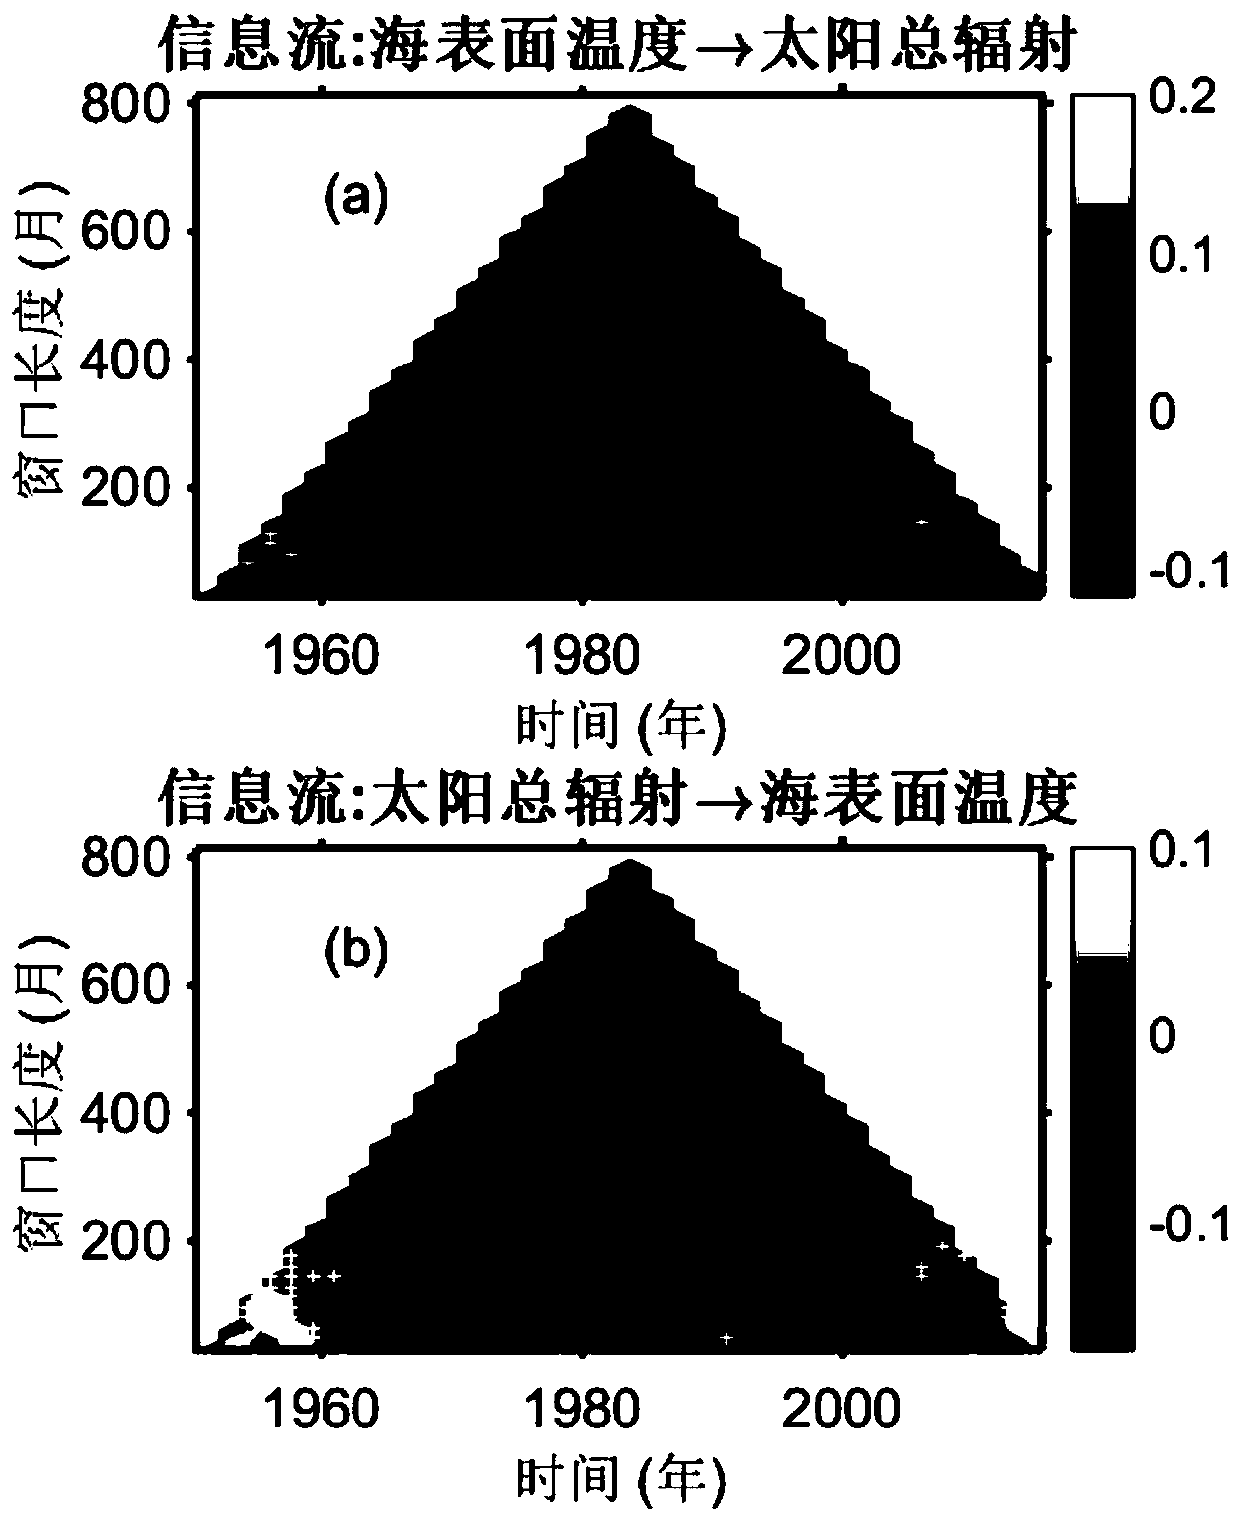
[0021] Step 1: Select the minimum window length, slide the window, and calculate the Liang-Kleeman information flow.

[0022] The smallest window is the smallest timescale we want to consider. If the window length is too small, the change of the time series in this time scale will be relatively small, lacking enough useful information. For this method, we need to calculate the correlation of two time series. If the amount of data is too small, it will also affect the confidence of the correlation coefficient. Therefore, the minimum window size should contain more than 30 sampling points.

[0023] Note that the two time series are X 1 and x 2 , then from X 2 Flow X 1 information flow T 2->1 Can be expressed as:

[0024]

[0025] where C=(C ij ) represents the sequence X 1 and x 2 The covariance matrix of C i,dj for sequence X i and x j The covariance matri...


PUM


Abstract

The invention discloses a method for calculating and displaying a beam-Kriging information flow through a multi-scale sliding window, and the method comprises the steps: selecting the minimum window length and the sliding window, and calculating the beam-Kriging information flow; calculating a multi-scale information flow; carrying out reliability inspection; carrying out confidence check on the information flow obtained through calculation; and performing three-dimensional display of the multi-scale beam-Kriging information flow along with time change. The method has the beneficial effects that the beam-Kriging causality is displayed more comprehensively, and one parameter selected by experience of the method is reduced.

Description

technical field [0001] The invention belongs to the technical field of data analysis, and relates to a method for calculating and displaying Liang-Kleeman (Liang-Kleeman) information flow with a multi-scale sliding window. Background technique [0002] Both the natural science system and the social science system pay great attention to the causal relationship among several dynamic processes within the system. Dynamical processes are usually understood through time series. Therefore, it is particularly important to study the causal relationship between two time series. However, this is a very difficult problem. So far, the methods commonly used to explore causality are: (1) Lead-lag correlation: Although correlation does not imply causation, some fields (such as climatology) still use this method. Its shortcoming is that for those time series with a certain period, we cannot determine the leading and lagging problems, so we cannot determine who is the cause and who is the ...

Claims


Application Information

Patent Timeline
Patent Type & Authority Applications(China)
IPC IPC(8): G06F17/16
CPCG06F17/16
Inventor 王刚乔方利
Owner THE FIRST INST OF OCEANOGRAPHY SOA
Why Eureka
Try Eureka