A Sensitivity Analysis Method for Comparing Circuit Sweep Simulation Increments
A sensitivity analysis and circuit comparison technology, which is applied in CAD circuit design, electrical digital data processing, instruments, etc., can solve the problems of resource consumption and time consumption increase, and achieve the effects of eliminating differences, fast calculation, and simple form
- Summary
- Abstract
- Description
- Claims
- Application Information
AI Technical Summary
Problems solved by technology
Method used
Image
Examples
Embodiment 1
[0057] In an embodiment of the present invention, the scanning simulation condition factor (e.g., voltage, temperature, etc.) may be given by -by Points or -byStep two ways, the former method directly specifies a specific discrete scanning point, generally disordered, unequal interval characteristics; the latter way indirectly specifies the start point, end point and step length of the scan, to input an ordered and equally spaced discrete scanning point. Spice simulation can obtain many types of scan simulation data, and combine the scan simulation condition factors to complete subsequent calculations and analysis. Incremental calculations and incremental conversions eliminate the differences between multiple types of data in a very simple way, making them directly comparable to each other, and are also conducive to the calculation of sensitivity factors and the visual analysis of the scanning simulation process.
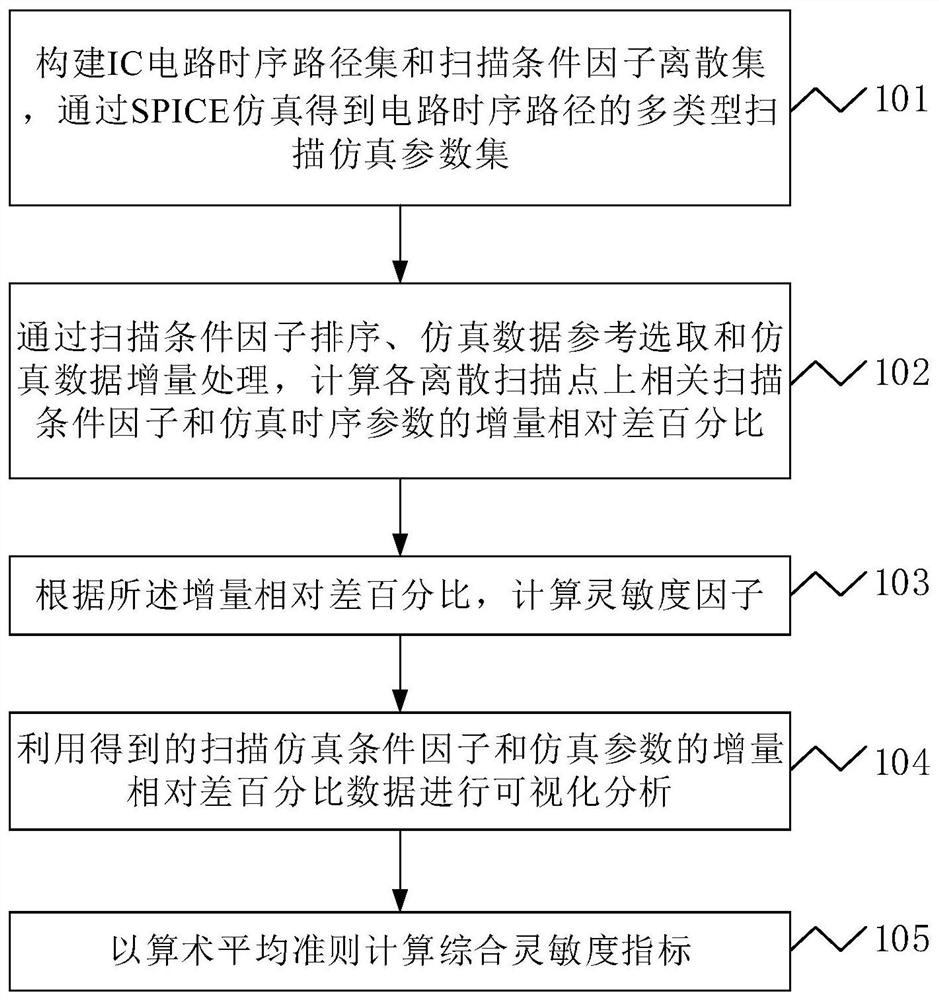
[0058] Figure 1For a flowchart of a sensitivity analysis method f...
Embodiment 2
[0084] Figure 2 Schematic diagram of a sensitivity analysis system for simulating increments of a comparative circuit scan according to the present invention, e.g., Figure 2 As shown, the sensitivity analysis system of the comparative circuit sweep simulation increment of the present invention, comprising, a scanning module 201, a SPICE simulation module 202, an incremental processing module 203, a sensitivity factor calculation module 204, and a visual analysis module 205, wherein,
[0085] Scanning module 201, which scans the input simulation condition factor.
[0086] In at least one embodiment of the present invention, the scanning simulation condition factor (e.g., voltage, temperature, etc.) may be given by -byPoints or -by Step two ways, the former method directly specifies a particular discrete scanning point, generally disordered, unequal interval characteristics; the latter way indirectly specifies the start point, end point and step length of the scan, to input an order...
Embodiment 3
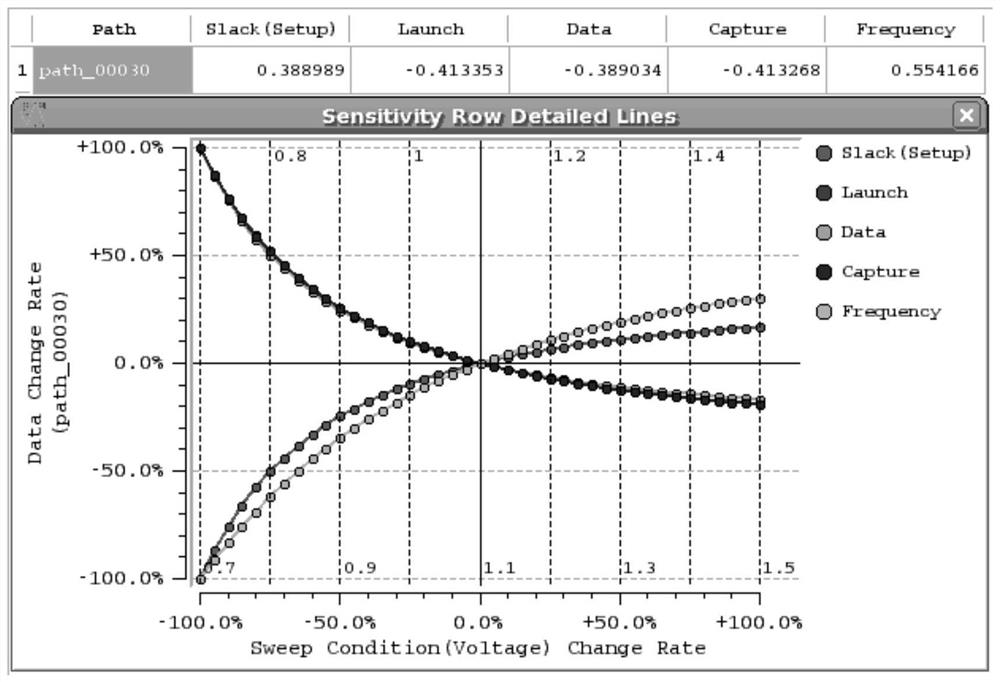
[0107] Figure 3 For a comparison of the sensitivity analysis method of the circuit sweep simulation increment according to the present invention of the sensitive graph of the embodiment of the sensitive curve, such as Figure 3 As shown, the technical process proposed in the present invention can be completed to complete the calculation of the corresponding sensitivity factor and the drawing of the sensitivity curve. In this case, the scanning factor is the voltage value (-by Step: Start 0.7V; End 1.5V; Step 0.02V), from the sensitive curve chart, the sensitivity factor of each scan point is the slope of the corresponding data point and the origin connection (except for special points), the vector indicates the relative direction and size of the simulation timing parameter increment on the data point, effectively expressing the change trend and degree of change information on the data point. When the change trend of the simulation timing parameters is relatively stable (that is, t...
PUM
 Abstract
Description
Claims
Application Information
 - R&D
- Intellectual Property
- Life Sciences
- Materials
- Tech Scout
- Unparalleled Data Quality
- Higher Quality Content
- 60% Fewer Hallucinations
Browse by: Latest US Patents, China's latest patents, Technical Efficacy Thesaurus, Application Domain, Technology Topic, Popular Technical Reports.
© 2025 PatSnap. All rights reserved.Legal|Privacy policy|Modern Slavery Act Transparency Statement|Sitemap|About US| Contact US: help@patsnap.com


