Visualization method based on natural environment factor data

A technology of natural environment and environmental factors, applied in the computer field, can solve problems such as opaque communication, improper material selection and protection, imperfect application service mode, etc., and achieve the effect of intuitive expression and precise response

Active Publication Date: 2020-04-21
NO 59 RES INST OF CHINA ORDNANCE IND
View PDF11 Cites 4 Cited by
  • Summary
  • Abstract
  • Description
  • Claims
  • Application Information

AI Technical Summary

Problems solved by technology

[0003] At present, when analyzing complex data sets, traditional visualization methods cannot meet the analysis needs. At this time, higher-level visualization methods are needed to analyze the relationship between data
However, due to the opaque communication of natural environment test and observation data information and the imperfect application service model, the research and development personnel cannot obtain and use these valuable data resources comprehensively and quickly, and can only adopt relevant standards based on experience or equivalent, resulting in improper material selection and protection. 1. The over-design or under-design of product environmental adaptability has seriously affected the normal progress of equipment development work

Method used


Image

  • Visualization method based on natural environment factor data
  • Visualization method based on natural environment factor data
  • Visualization method based on natural environment factor data

Examples


Embodiment 1

[0052] A visualization method based on natural environment factor data, characterized in that: comprising the following steps:

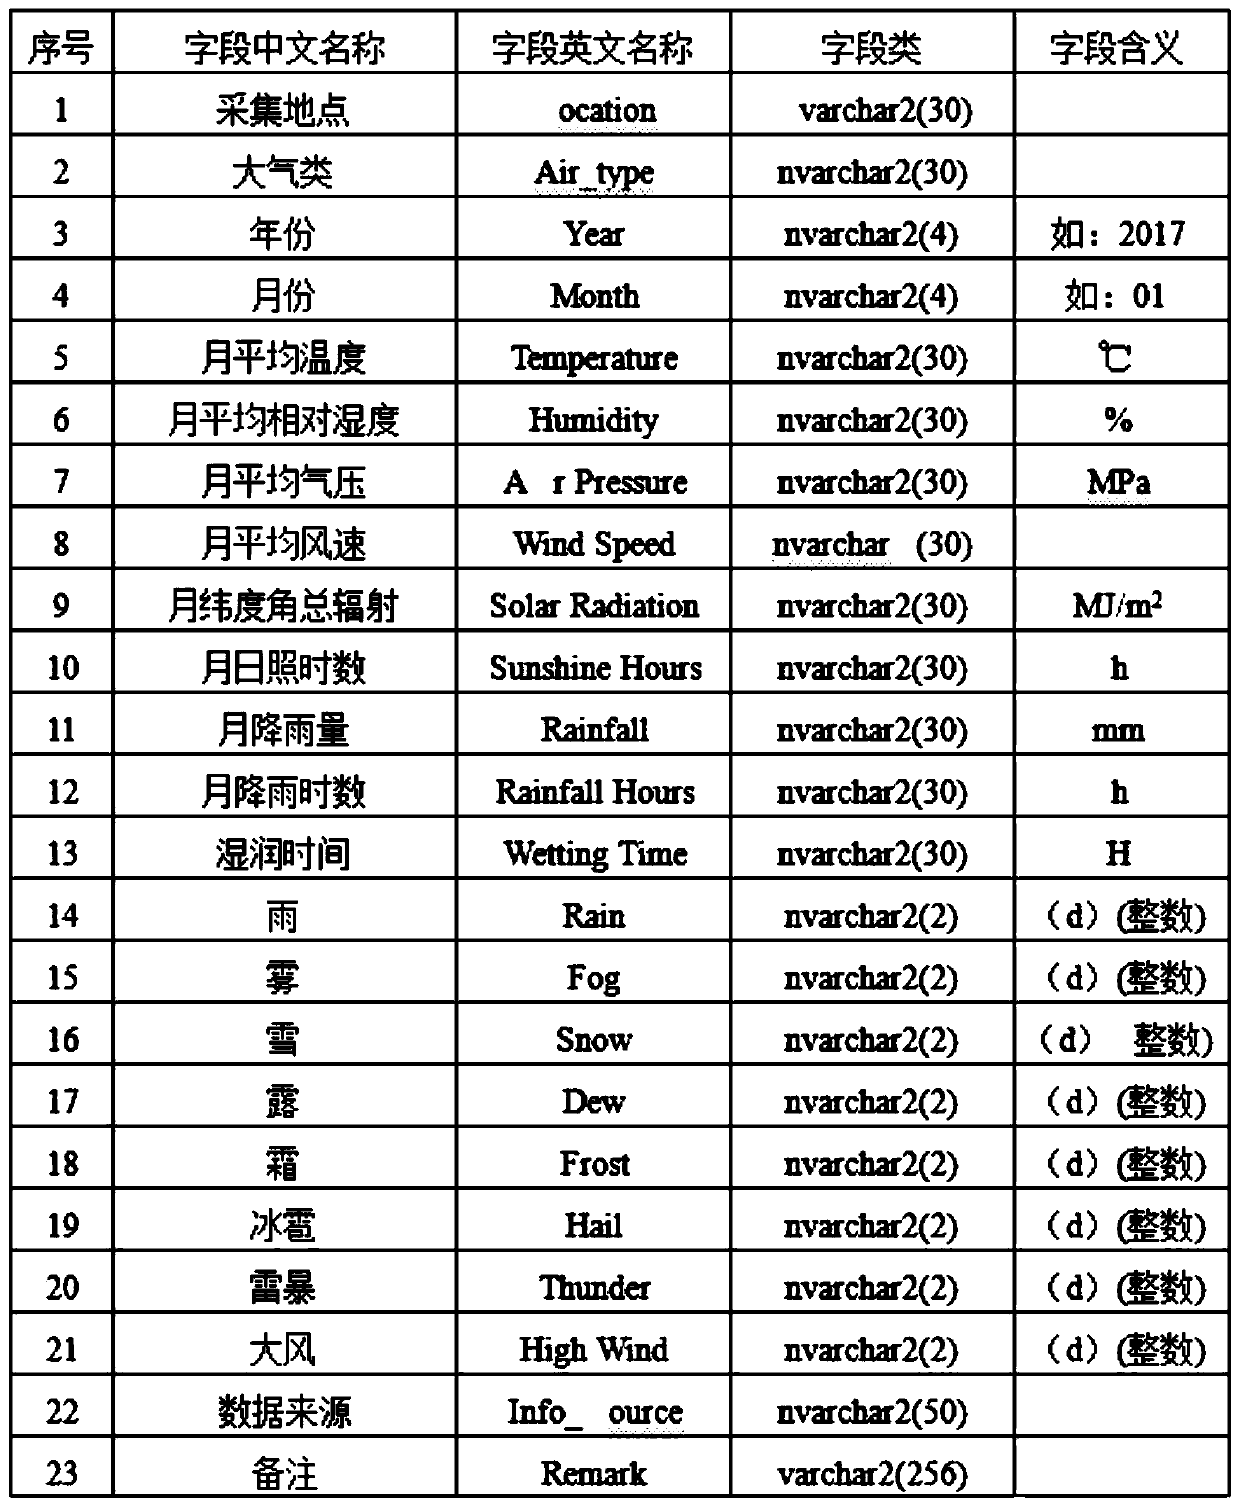
[0053] a. Based on the data distribution, classification, characteristics and application fields of the main natural environmental factors at the present stage, enter the data information into the application layer software, carry out the conceptual design, logical design, physical design, verification design, operation and maintenance design of the database, etc. Environmental factors data repository;

[0054] Then classify the natural environment factor data resource library, build the system structure and overall structure of the natural environment factor database, and establish the natural environment factor database; The architecture design replaces the model design, and the system architecture is built on the basis of services.

[0055] b. According to the environmental factors in the natural environment factor database in step a and the char...


PUM


Abstract

The invention discloses a visualization method based on natural environment factor data. A visual display system is built through the combination of a time sequence change model and a space change model. Mapping from a data space to a graphic space is carried out by utilizing a 2.5-dimensional surface visual design idea and three coordinate conversions, visual display of natural environment factordata is realized, and a function of visually and clearly displaying key environment factor data display is achieved. Meanwhile, the visualization method realizes that multiple views display data frommultiple angles at the same time, and the views are linked, that is, when the views are modified and inquired in one view, information displayed in other views can also be correspondingly changed, sothat the visualization method has timeliness, accuracy and clarity, and is convenient for researchers to evaluate.

Description

technical field [0001] The invention relates to the field of computer technology, in particular to a visualization method based on natural environment factor data. Background technique [0002] Visualization is the theory, method and technology of using computer graphics and image processing technology to convert data into graphics or images and display them on the screen for interactive processing. Scientific computing visualization can turn scientific data, including measured values, images, or digital information involved in calculations into intuitive, graphical image information, physical phenomena or physical quantities that change with time and space, and present them in research. before the observers, enabling them to observe, simulate and compute. [0003] At present, when analyzing complex data sets, traditional visualization methods cannot meet the analysis requirements. At this time, higher-order visualization methods are needed to analyze the relationship betwe...

Claims


Application Information

Patent Timeline
Patent Type & Authority Applications(China)
IPC IPC(8): G06F16/904
CPCG06F16/904Y02A90/10
Inventor 黄强张志明代小强张云谢兰川
Owner NO 59 RES INST OF CHINA ORDNANCE IND
Why Eureka
Try Eureka