A three-dimensional visualization method and device for od relationship in gis

A relational, three-dimensional technology, applied in the field of data visualization, can solve the problems of limited expression information, disordered expression effect, information loss, etc., and achieve the effect of clear content expression and strong visual impact.

Active Publication Date: 2021-09-03
TONGJI UNIV
View PDF7 Cites 0 Cited by
  • Summary
  • Abstract
  • Description
  • Claims
  • Application Information

AI Technical Summary

Problems solved by technology

Since practitioners currently use ready-made and relatively mature software and tools, the effects obtained are often similar, which may attract attention in the early stage, but as more and more people master these tools, similar There are more and more tools, and the display of OD diagrams has become difficult to grasp and study, forming a bright feeling
[0006] (2) Limited expression information
Since the current mainstream OD expression tools are all on the 2D plane, the information expressed cannot be too much. If there is too much information, the OD lines will be complicated and the expression effect will be disordered (ie figure 1 In the situation shown, too many connections make it difficult to effectively and intuitively represent)
[0007] In order to avoid these defects, methods such as deleting information, gradient expression, color distinction, and simulating parabolas by replacing straight lines are generally used, but some methods will also cause information loss to a certain extent
Human perception is three-dimensional, but there is no convenient and easy-to-use tool for three-dimensional expression of OD relationship

Method used


Image

  • A three-dimensional visualization method and device for od relationship in gis
  • A three-dimensional visualization method and device for od relationship in gis
  • A three-dimensional visualization method and device for od relationship in gis

Examples


Embodiment Construction

[0032] In order to make the technical means, creative features, goals and effects achieved by the present invention easy to understand, the method and device for three-dimensional visualization of OD relationship in GIS of the present invention will be described in detail below in conjunction with the embodiments and accompanying drawings.

[0033]

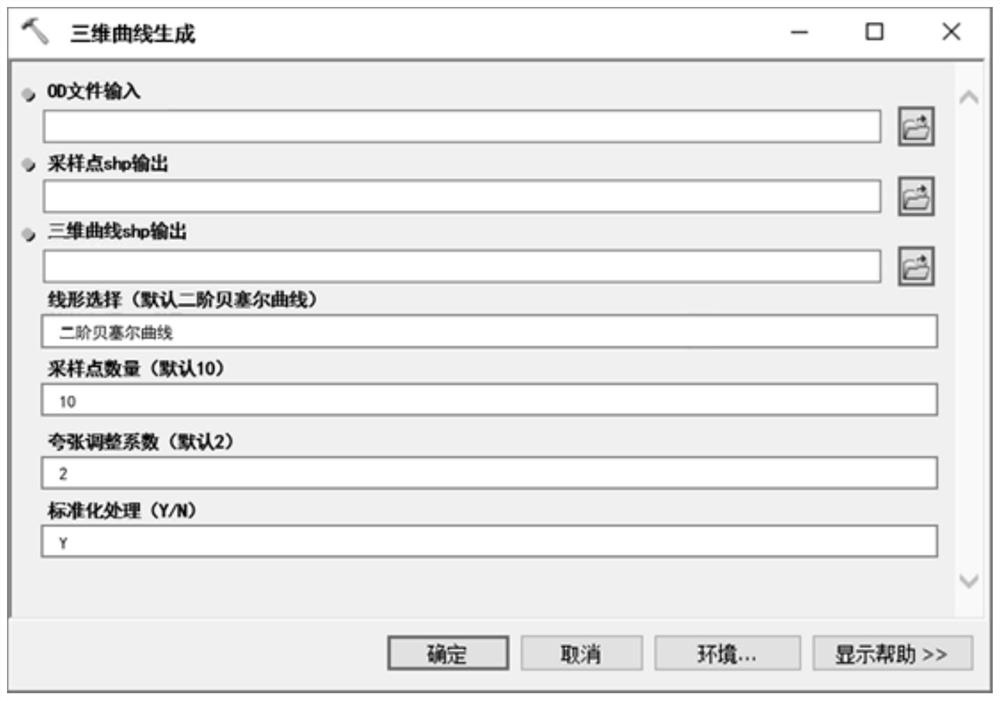
[0034] The ultimate goal of this method is to form a three-dimensional curve between two points. However, because the Arcgis software does not provide the curve function for the time being, this method mainly uses the idea of ​​"replacing the curve with a straight line" for calculation. First determine the line type of the curve, then generate sampling points on the curve, connect the sampling points in order to form a multi-segment polyline, and then approximate the fitting curve.

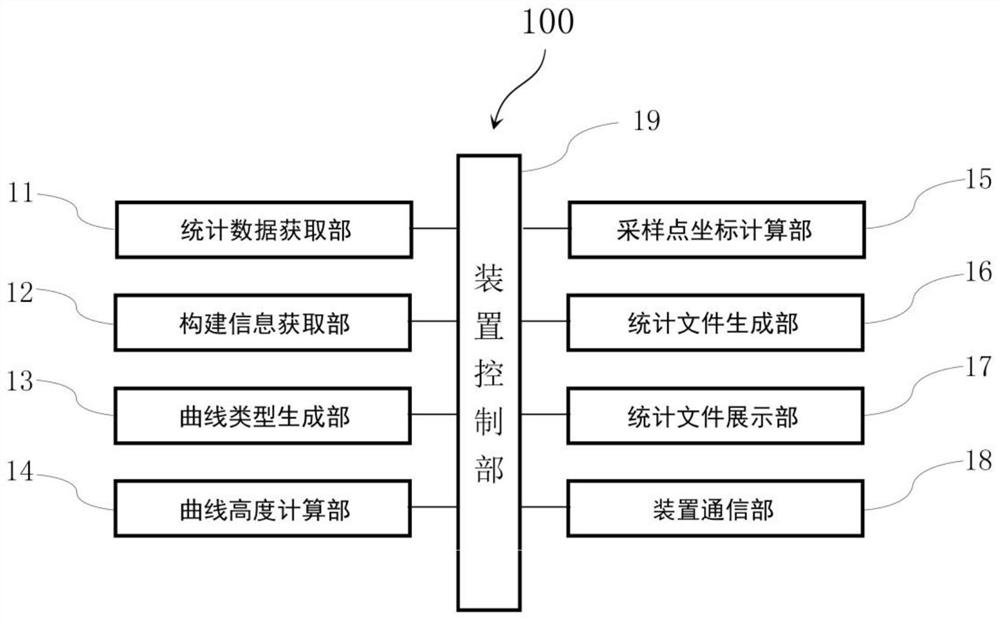
[0035] In this embodiment, the three-dimensional visualization method of the OD relationship in GIS is realized by a computer, and the corresponding...


PUM


Abstract

The present invention provides a three-dimensional visualization method and device for OD relationships in GIS, which is characterized in that it is used to generate corresponding three-dimensional curves that can be recognized by the GIS system according to user input data and perform three-dimensional visualization display, including the following steps: Step S1, Obtain the OD relationship statistical data used to reflect the relationship between two locations; step S2, obtain the curve construction information input by the user; step S3, generate the curve type; step S4, calculate the curve height of multiple curves; step S5, Sampling each curve in turn to calculate the sampling point coordinates of a plurality of sampling points corresponding to each curve; step S6, according to each curve, corresponding sampling point coordinates and OD relationship statistical data in the GIS system converted into corresponding Statistical files of all curves; step S7, visually displaying the statistical files through a 3D visualization application.

Description

technical field [0001] The invention belongs to the field of data visualization, in particular to a method and device for three-dimensional visualization of OD relationships in GIS. Background technique [0002] OD generally refers to the starting and ending points of traffic in traffic, O refers to the origin (ORIGIN), and D refers to the end point (DESTINATION). OD traffic volume is a commonly used noun and indicator in the traffic field, reflecting the traffic volume between two points, while in this patent, the content of OD is generalized as the relationship between two points, this relationship can be traffic volume, Reachability, telephone contact volume, similarity, business connection, etc. [0003] The expression and visualization of OD is a very common method in the industry, and the expression of OD is generally realized with the help of professional software and Internet tools. Taking urban and rural planning as an example, practitioners in this industry are m...

Claims


Application Information

Patent Timeline
Patent Type & Authority Patents(China)
IPC IPC(8): G06T19/20
CPCG06T19/20
Inventor 王德江贺韬
Owner TONGJI UNIV
Why Eureka
Try Eureka