Method for accurately analyzing geographic distribution of bus population based on multi-source data

A multi-source data, public transportation technology, applied in data processing applications, electrical digital data processing, special data processing applications, etc.

Active Publication Date: 2020-07-31
重庆交通开投科技发展有限公司
View PDF14 Cites 8 Cited by
  • Summary
  • Abstract
  • Description
  • Claims
  • Application Information

AI Technical Summary

Problems solved by technology

However, there is no quick way to integrate multiple information (mobile phone signaling, IC card swiping, district / line and other geographical distribution data) for joint analysis, to obtain the situation of existing travel groups using public transportation at different times, and then to obtain the bus Data on the geographical distribution of the population and the geographical distribution of the population not using public transport

Method used


Image

  • Method for accurately analyzing geographic distribution of bus population based on multi-source data

Examples


Embodiment Construction

[0024] The following will clearly and completely describe the technical solutions in the embodiments of the present invention with reference to the accompanying drawings in the embodiments of the present invention. Obviously, the described embodiments are only some, not all, embodiments of the present invention. Based on the embodiments of the present invention, all other embodiments obtained by persons of ordinary skill in the art without making creative efforts belong to the protection scope of the present invention.

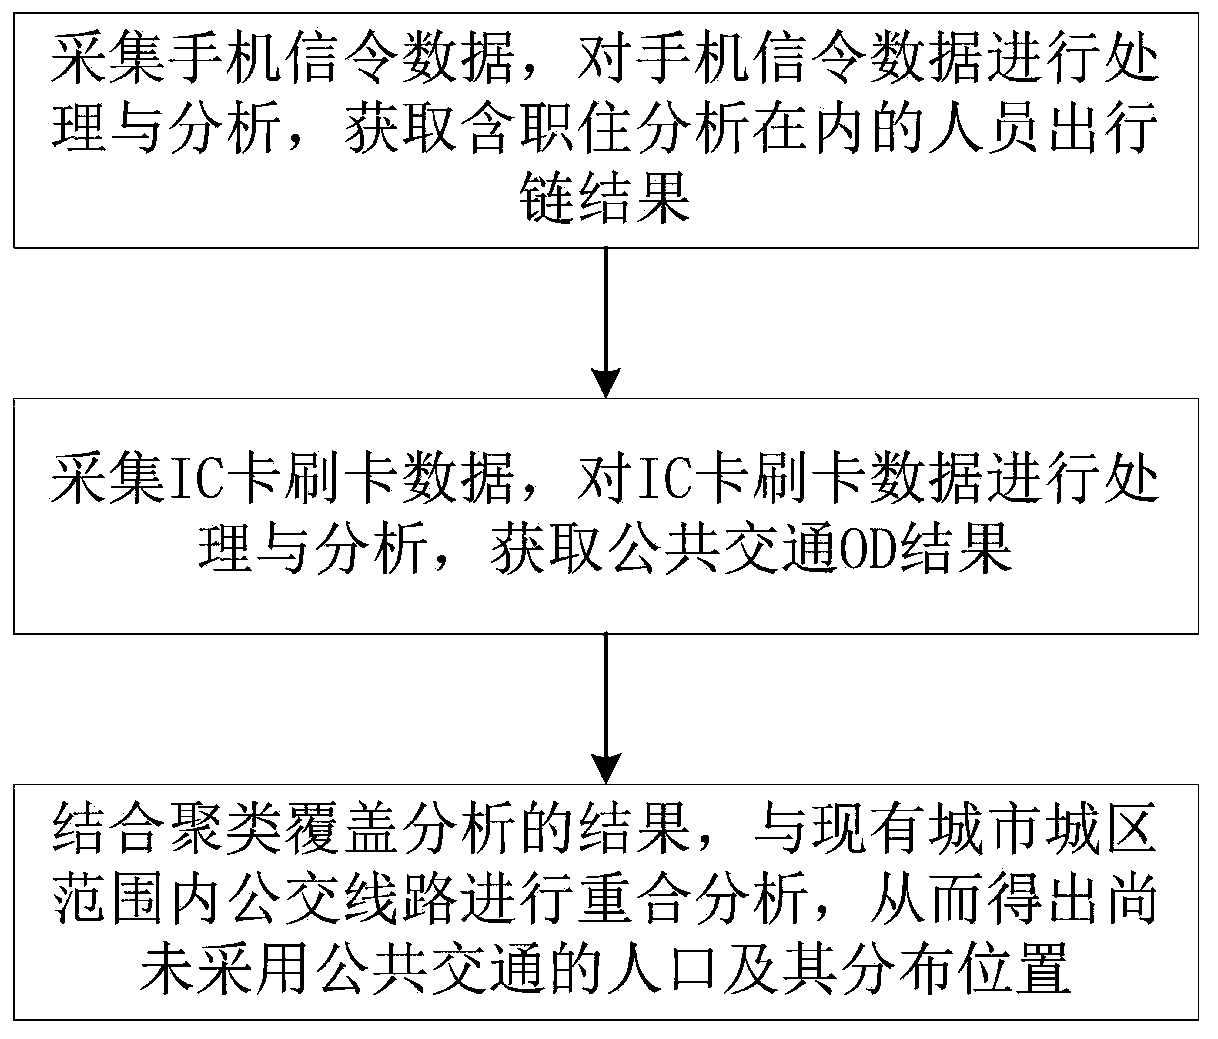
[0025] Reference attached figure 1 , a method for accurately analyzing the geographical distribution of bus population based on multi-source data, including the following steps:

[0026] S1: Collect mobile phone signaling data, process and analyze the mobile phone signaling data, and obtain personnel travel chain results including job and residence analysis;

[0027] S2: Collect IC card swiping data, process and analyze the IC card swiping data, and obtain pu...


PUM


Abstract

The invention relates to the technical field of bus population geographical distribution, in particular to a method for accurately analyzing bus population geographical distribution based on multi-source data. The method comprises the following steps: S1, acquiring mobile phone signaling data, and acquiring a personnel trip chain result including job-house analysis; S2, collecting IC card swipingdata, and acquiring a public transport OD result; S3, performing clustering coverage analysis on the two results in S1 and S2 on a map, and performing coincidence analysis on the two results and bus routes in an existing urban area range, so as to obtain population which does not adopt public transport and distribution positions of the population. According to the method, the uncovered area of a bus is obtained by combining mobile phone signaling and IC card swiping data, then the uncovered area gathered by users is obtained through clustering coverage analysis, and alternative routes and timeperiods needing to be started are obtained according to the main flow direction of the users and the number of the users; and coincidence analysis is carried out with an existing bus route, and passenger flow is combined, so the design of a tail-end bus connection route and the delivery capacity is facilitated.

Description

technical field [0001] The invention relates to the technical field of geographical distribution of public transport population, in particular to a method for accurately analyzing the geographical distribution of public transport population based on multi-source data. Background technique [0002] The operation of bus lines must be carried out in accordance with the "Urban Bus and Tram Passenger Transport Management Measures", and factors such as passenger flow, length, non-linear coefficient, and line network density must be considered. [0003] In principle, priority should be given to routing the lines with the largest passenger flow. However, with the use of various urban transportation tools (rails, shared cars, electric vehicles, etc.), the traditional passenger flow survey method is time-consuming and labor-intensive, and it is becoming more and more difficult to count passenger flow. To this end, it is necessary to use modern means to grasp these normal passenger flo...

Claims


Application Information

Patent Timeline
Patent Type & Authority Applications(China)
IPC IPC(8): G06Q10/06G06Q50/26G06F16/215G06F16/29G06K9/62H04W4/20
CPCG06Q10/0637G06Q50/26G06F16/215G06F16/29H04W4/20G06F18/2321Y02A30/60
Inventor 邓伟李直林
Owner 重庆交通开投科技发展有限公司
Why Eureka
Try Eureka