Carbon emission spatial drawing method and density spatial distribution determination method and device

A carbon emission and density technology, applied in the direction of instruments, character and pattern recognition, data processing applications, etc., can solve the problem of inability to accurately reflect the spatial change characteristics of residents' carbon emissions, poor applicability of carbon emission spatial analysis methods, and inability to quantify the distribution of regional indicators and other issues to achieve the effect of easy access, quick determination, and strong applicability

Active Publication Date: 2020-10-30
HENAN UNIVERSITY
View PDF4 Cites 4 Cited by
  • Summary
  • Abstract
  • Description
  • Claims
  • Application Information

AI Technical Summary

Problems solved by technology

[0004] The purpose of the present invention is to provide a carbon emission spatial mapping method, which is used to solve the problem that existing methods cannot accurately reflect the spatial variation characteristics of residential carbon emissions in the process of urban rapid construction, and to solve the existing spatial analysis method of residential carbon emissions. The problem of poor applicability
[0005] The present invention proposes a method for determining the spatial distribution of residential density, which is used to solve the problem that the existing method obtains the total amount of indicators in a certain area through statistical work, but cannot quantify the distribution of regional indicators

Method used


Image

  • Carbon emission spatial drawing method and density spatial distribution determination method and device
  • Carbon emission spatial drawing method and density spatial distribution determination method and device
  • Carbon emission spatial drawing method and density spatial distribution determination method and device

Examples


Embodiment Construction

[0059] The specific embodiments of the present invention will be further described below in conjunction with the accompanying drawings.

[0060] Example of carbon emission spatial mapping method:

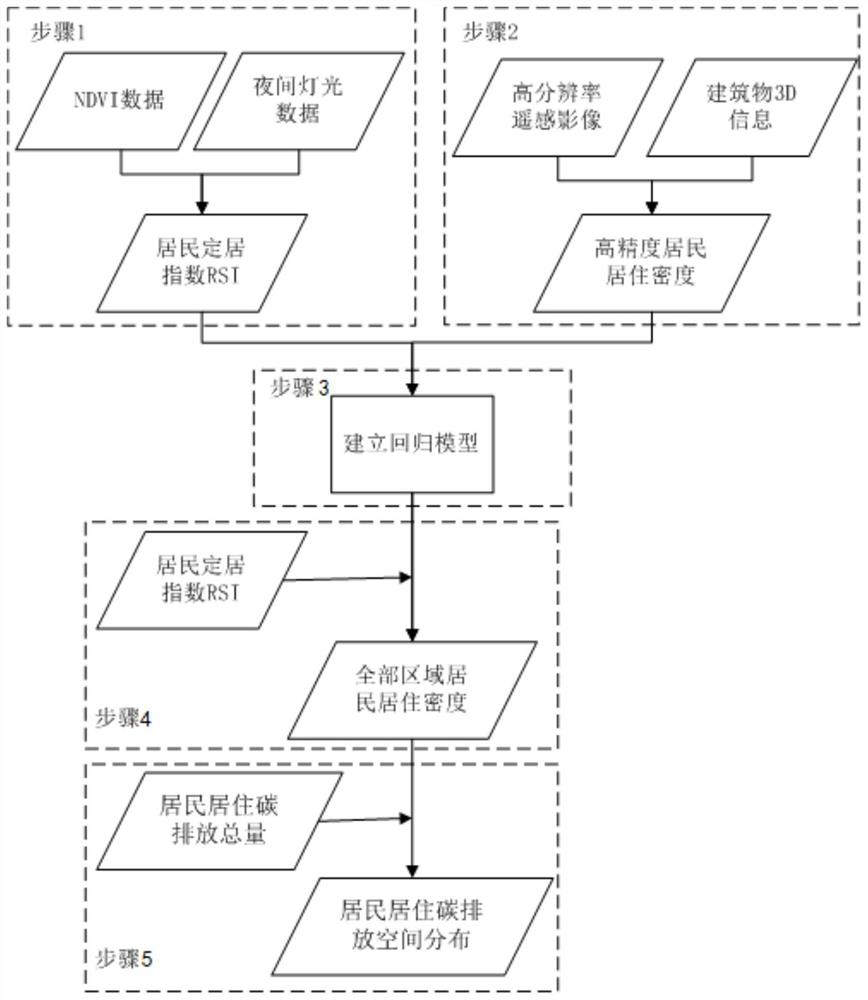
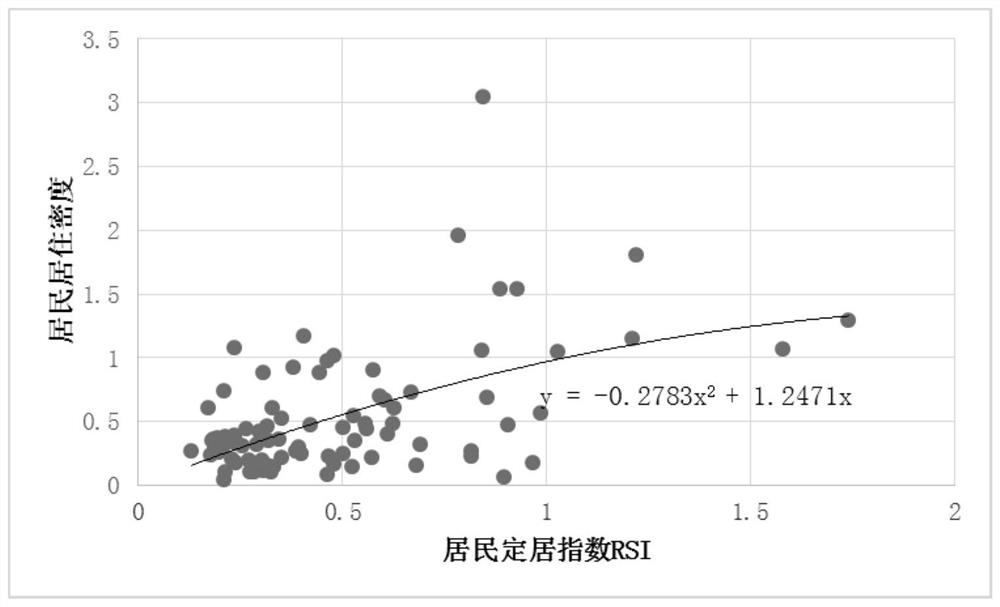
[0061] This embodiment proposes a carbon emission spatial mapping method, the basic principle of which is to first use remote sensing images to determine the residential density of residents in a small part of the target area, and then establish the residential density and residential settlement index of this small part of the area The mapping relationship between them, and then use the mapping relationship, combined with the residential settlement index in the target area, to find the residential density distribution of the entire target area, and finally use the residential density distribution of the residents, combined with the carbon emissions in the unit pixel, Determine the spatial distribution of residential carbon emissions and draw a map. The overall process is as follows:...


PUM


Abstract

The invention relates to a carbon emission space drawing method and a density spatial distribution determination method and device, and belongs to the technical field of environment monitoring. The drawing method comprises the steps defining resident living density by combining coverage rate of residential construction land in the horizontal direction and the density difference in the vertical direction caused by different floors of different buildings; then, establishing a regression model representing a mapping relationship between the two according to the correlation between the resident living density and the resident settlement index, and the resident living density and the resident settlement index of a small area; using the regression model, and combining the resident settlement index of the whole target area to obtain the accurate resident living density of the whole target area; and on the basis, obtaining the high-resolution resident living carbon emission spatial distribution pattern of the target area by combining the carbon emission under the unit living density, so that resident living carbon emission spatial distribution can be rapidly determined, and the acquired spatial distribution map has high precision and relatively strong applicability.

Description

technical field [0001] The invention belongs to the technical field of environmental monitoring, and in particular relates to a carbon emission spatial mapping method, a method and a device for determining density spatial distribution. Background technique [0002] Spatial analysis of residential carbon emissions of urban residents is an important content in the implementation of low-carbon city construction, and spatial mapping of residential carbon emissions is the basis for spatial analysis of residential carbon emissions. In traditional technology, the accounting of urban residents’ residential carbon emissions in various regions is generally based on statistical data. The advantages are that the method is simple, the data is easy to obtain, and the data is long-term, continuous and extensive, which is convenient for different regions or different time periods. However, the disadvantage of this method is that the statistics of urban residential carbon emissions data are ...

Claims


Application Information

Patent Timeline
Patent Type & Authority Applications(China)
IPC IPC(8): G06Q10/06G06Q50/26G06K9/00
CPCG06Q10/06393G06Q50/26G06V20/176G06V20/188Y02P90/84
Inventor 刘桂芳卢鹤立冯亚飞
Owner HENAN UNIVERSITY
Why Eureka
Try Eureka