Supercharge Your Innovation With Domain-Expert AI Agents!

Method for visually converting data report

A data report and data package technology, applied in visual data mining, structured data retrieval, structured data browsing, etc., can solve the problems of inconvenient extraction and reading of statistical information, slow processing speed, etc. The effect of reducing interference

Pending Publication Date: 2021-03-02
南京云悦欣自动化工程有限公司
View PDF0 Cites 0 Cited by
  • Summary
  • Abstract
  • Description
  • Claims
  • Application Information

AI Technical Summary

Problems solved by technology

When statistical data information is required, the processing speed of traditional data reports is slow, and it is not convenient for staff to extract and read statistical information

Method used


Image

  • Method for visually converting data report

Examples


specific Embodiment approach

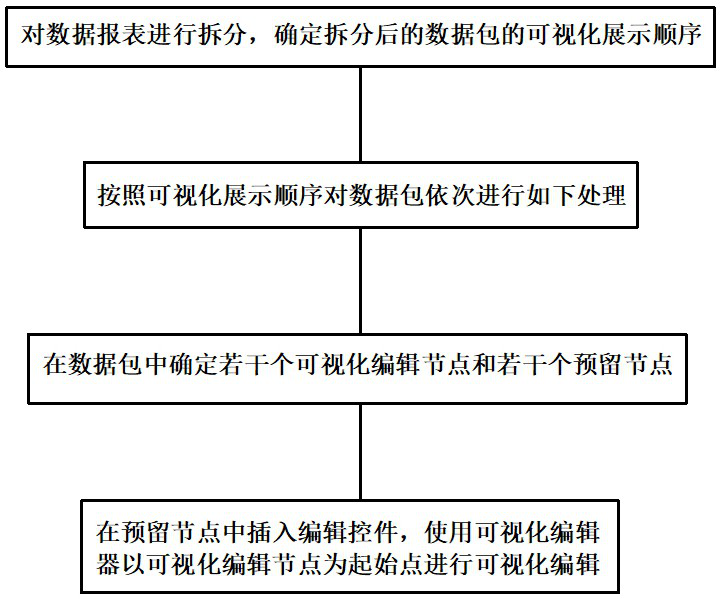
[0018] refer to figure 1 , a specific embodiment of the present invention comprises the following steps:

[0019] A. Split the data report and determine the visual display sequence of the split data packets;

[0020] B. The data packets are processed sequentially as follows according to the order of visual display;

[0021] C. Determine several visual editing nodes and several reserved nodes in the data package;

[0022] D. Insert an editing control into the reserved node, and use the visual editor to perform visual editing with the visual editing node as the starting point.

[0023] In step A, a split mark is set at the split point of the data report, and the split mark is used as a verification area for visual editing.

[0024] In step C, a node sequence of reserved nodes is established.

[0025] In step D, when performing visual editing, the edit control is extracted according to the node sequence.

[0026] In step D, the visual editor includes several editing template...


PUM


Abstract

The invention discloses a method for visually converting a data report, which comprises the following steps of: A, splitting the data report, and determining a visual display sequence of split data packets; b, sequentially carrying out the following processing on the data packets according to a visual display sequence; c, determining a plurality of visual editing nodes and a plurality of reservednodes in the data packet; and D, inserting an editing control into the reserved node, and performing visual editing by using a visual editor and taking the visual editing node as a starting point. According to the method, the defects in the prior art can be overcome, and the efficiency of visualized conversion of the data report is improved.

Description

technical field [0001] The invention relates to the technical field of industrial automation, in particular to a method for visually converting data reports. Background technique [0002] In various industrial and mining enterprises, the data of the data reports used to record production operation information is very large. When statistical data information is needed, the processing speed of traditional data reports is slow, and it is not convenient for staff to extract and read statistical information. The visualization of data reports is one of the trends in the deep processing of data reports in recent years, which can improve the efficiency of data report processing and information reading. Contents of the invention [0003] The technical problem to be solved by the present invention is to provide a method for visually converting data reports, which can solve the deficiencies of the prior art and improve the efficiency of visually converting data reports. [0004] In...

Claims


Application Information

Patent Timeline
IPC IPC(8): G06F40/18G06F16/26
CPCG06F16/26G06F40/18
Inventor 张金伟许国园
Owner 南京云悦欣自动化工程有限公司
Features
  • R&D
  • Intellectual Property
  • Life Sciences
  • Materials
  • Tech Scout
  • Unparalleled Data Quality
  • Higher Quality Content
  • 60% Fewer Hallucinations
Learn More