Homogeneous visualization and bifluorescence signal analysis method based on multiple selective recognition reactions and application
A signal analysis method and fluorescence signal technology, which are applied in the field of homogeneous visualization and dual fluorescence signal analysis, and can solve problems such as difficult visualization and reading.
- Summary
- Abstract
- Description
- Claims
- Application Information
AI Technical Summary
Problems solved by technology
Method used
Image

Examples
Embodiment 1
[0039] This example provides the synthesis method of CdTe QDs.
[0040] First, 0.5mmol CdCl 2 and 0.20 g of trisodium citrate were dissolved in 50 ml of water, and 52 μL of mercaptopropionic acid (MPA) was added to the above solution. Using NaOH solution, adjust the pH of the above mixture solution to 10.5;
[0041] Then, add 0.1mmol Na 2 TeO 3 and 50mg KBH 4 Add to the above solution, reflux for 1 hour, until the solution is red, showing strong red fluorescence under the irradiation of ultraviolet light;
[0042] Finally, the CdTe QDs solution was purified by precipitation (using n-propanol) and centrifugation (11000 rpm, 30 min).
[0043] The MPA-CdTe QDs synthesized above were stored at 4 °C before use.
Embodiment 2
[0045] The present embodiment provides the analysis steps of PPase, specifically as follows:
[0046] (1) Add 77 μL Tris-HCl buffer (pH=7.4, 10 mM, 500 mM NaCl, 100 mM MgCl 2 ), 10 μL pyrophosphate (PPi, 17.5 mM) and 50 μL pyrophosphatase (PPase) of different concentrations, incubated at 37°C for 0.5h to complete the hydrolysis reaction;
[0047] (2) Subsequently, 10 μL of CuCl was added to the centrifuge tube 2 Solution (100μM), continue to incubate at 37°C for 0.5h to complex copper ions and PPi;
[0048] (3) Next, add 2 μL Ce(NO 3 ) 3 Solution (0.5mM) and 1μL CdTe QDs stock solution, reacted at room temperature for 12min to complete the cation exchange reaction and coordination complexation reaction;
[0049] (4) Transfer the above solution to a cuvette, use a fluorometer to test and record the data (excitation wavelength: 295nm, emission wavelength range: 310nm-800nm).
Embodiment 3
[0051] This embodiment provides PPase analysis-excitation wavelength selectivity and selectivity identification phenomenon verification, as follows:
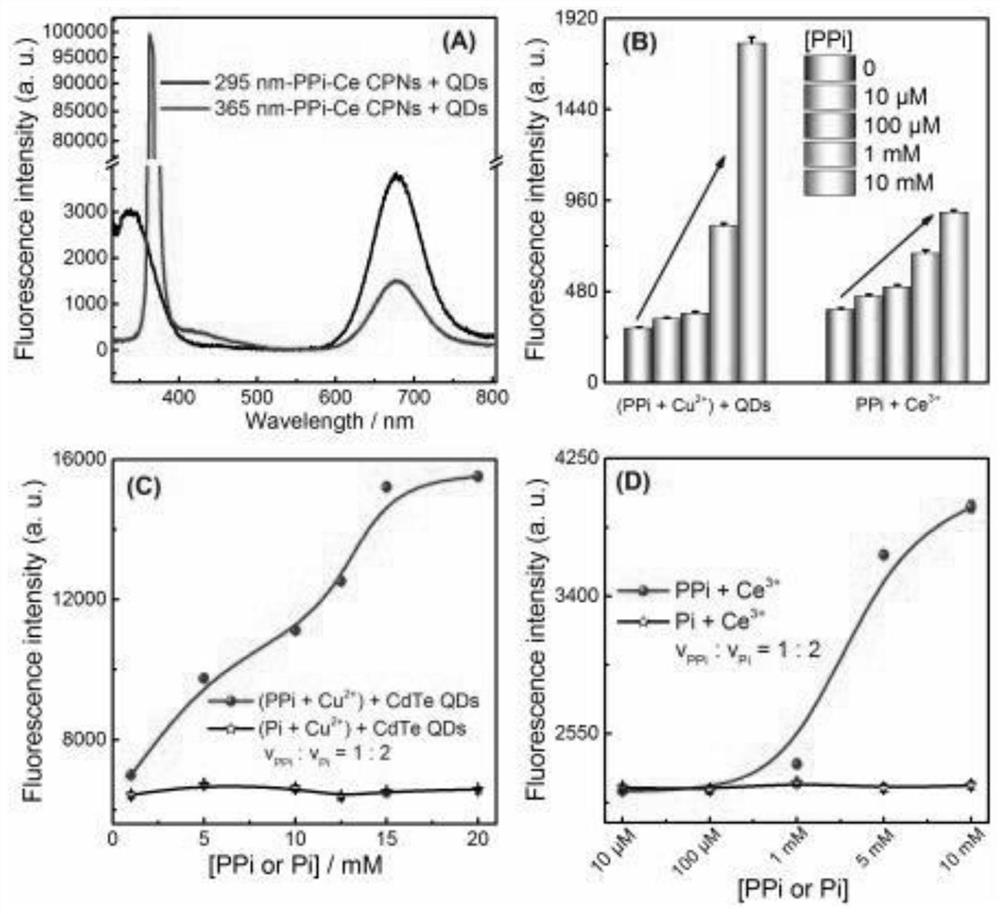
[0052] Considering that the optimal excitation wavelength required for PPi-Ce CPNs is 295nm and the optimal excitation wavelength for CdTe QDs is 365nm, the excitation wavelength of the dual fluorescence signal analysis system was selected first. Such as figure 2 As shown in A, when excited at 295nm, both PPi-Ce CPNs and QDs have corresponding emission peak shapes, but when excited at 365nm, PPi-Ce CPNs do not emit a peak at 348nm, but show a peak shape at the excitation wavelength of 365nm.
[0053] In summary, the final selectivity of 295nm is the excitation wavelength of the system.
[0054] At the same time, it was further verified that different concentrations of PPi-Cu 2+ -The effect of PPi complex on the fluorescence signal of QDs, and the effect of different PPi on Ce 3+ Influence of fluorescent signal. Such as fi...
PUM
 Abstract
Description
Claims
Application Information
 - R&D Engineer
- R&D Manager
- IP Professional
- Industry Leading Data Capabilities
- Powerful AI technology
- Patent DNA Extraction
Browse by: Latest US Patents, China's latest patents, Technical Efficacy Thesaurus, Application Domain, Technology Topic.
© 2024 PatSnap. All rights reserved.Legal|Privacy policy|Modern Slavery Act Transparency Statement|Sitemap