Unlock instant, AI-driven research and patent intelligence for your innovation.

Feature histogram-driven two-dimensional scalar field data visualization method and system

A feature histogram and scalar data technology, applied in the fields of data visualization and human-computer interaction, can solve problems such as low efficiency, weakened display, long calculation time, etc., to achieve the effect of improving efficiency and improving interaction efficiency

Inactive Publication Date: 2021-05-28
SHANDONG UNIV
View PDF3 Cites 1 Cited by
  • Summary
  • Abstract
  • Description
  • Claims
  • Application Information

AI Technical Summary

Problems solved by technology

However, this type of method usually adjusts the position of the color in the color design to highlight different data features. While using more colors to emphasize local features, it will inevitably weaken the display of other areas, and it is difficult to achieve a global balance. This defect has high is more apparent in data with dynamic ranges
Although some methods provide interactive methods such as region-of-interest selection (ROI, region-of-interest), due to the relatively complex optimization process, the calculation time is relatively long, and the efficiency in large-scale data exploration is relatively low.

Method used


Image

  • Feature histogram-driven two-dimensional scalar field data visualization method and system
  • Feature histogram-driven two-dimensional scalar field data visualization method and system
  • Feature histogram-driven two-dimensional scalar field data visualization method and system

Examples


Embodiment 1

[0043] This embodiment provides a two-dimensional scalar field data visualization method driven by a feature histogram;

[0044] Two-dimensional scalar field data visualization methods driven by feature histograms, including:

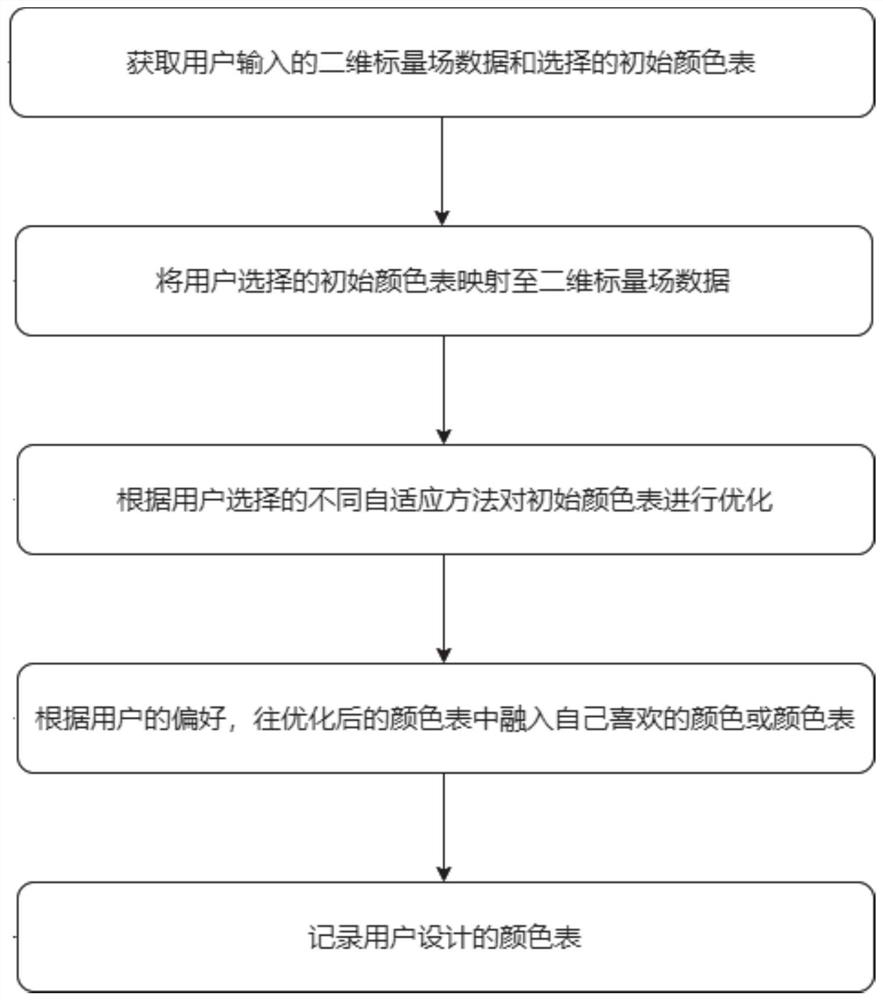
[0045] S101: Obtain input two-dimensional scalar field data and an initial color table;

[0046] S102: Map the initial color table to two-dimensional scalar field data, and display the mapping result;

[0047] S103: Based on the feature histogram of the data or the feature histogram based on the boundary, optimize the initial color table to obtain the optimized color table; map the optimized color table to two-dimensional scalar field data, and display the mapping result ;

[0048]S104: Obtain the area of ​​the color to be inserted, and then obtain the color or color segment to be inserted; through color fusion and linear difference, integrate the color or color segment to be inserted into the optimized color table to obtain an updated color table; M...

Embodiment 2

[0134] This embodiment provides a two-dimensional scalar field data visualization system driven by a feature histogram;

[0135] Feature histogram-driven two-dimensional scalar field data visualization system, including:

[0136] An acquisition module configured to: acquire input two-dimensional scalar field data and an initial color table;

[0137] A mapping module configured to: map the initial color table to two-dimensional scalar field data, and display the mapping result;

[0138] The optimization module is configured to: optimize the initial color table based on the data-based feature histogram or the boundary-based feature histogram to obtain an optimized color table; map the optimized color table to two-dimensional scalar field data, and display the mapping results;

[0139] An update module, which is configured to: obtain the area of ​​the color to be inserted, and then obtain the color or color segment to be inserted; integrate the color or color segment to be inse...

Embodiment 3

[0145] This embodiment also provides an electronic device, including: one or more processors, one or more memories, and one or more computer programs; wherein, the processor is connected to the memory, and the one or more computer programs are programmed Stored in the memory, when the electronic device is running, the processor executes one or more computer programs stored in the memory, so that the electronic device executes the method described in Embodiment 1 above.

[0146] It should be understood that in this embodiment, the processor can be a central processing unit CPU, and the processor can also be other general-purpose processors, digital signal processors DSP, application specific integrated circuits ASIC, off-the-shelf programmable gate array FPGA or other programmable logic devices , discrete gate or transistor logic devices, discrete hardware components, etc. A general-purpose processor may be a microprocessor, or the processor may be any conventional processor, o...


PUM


Abstract

The invention discloses a feature histogram-driven two-dimensional scalar field data visualization method and system. The method comprises the following steps: acquiring input two-dimensional scalar field data and an initial color table; mapping the initial color table to two-dimensional scalar field data, and displaying a mapping result; based on the feature histogram of the data or the feature histogram of the boundary, optimizing the initial color table to obtain an optimized color table; mapping the optimized color table to two-dimensional scalar field data, and displaying a mapping result; obtaining an area of a to-be-inserted color, and then obtaining the to-be-inserted color or a color fragment; fusing a color or a color segment to be inserted into the optimized color table through color fusion and a linear difference value to obtain an updated color table; mapping the updated color table to two-dimensional scalar field data, and displaying a mapping result; and storing the initial color table, the optimized color table and the updated color table, and displaying the corresponding color table according to a calling instruction.

Description

technical field [0001] The invention relates to the technical fields of data visualization and human-computer interaction, in particular to a two-dimensional scalar field data visualization method and system driven by a feature histogram. Background technique [0002] The statements in this section merely mention the background technology related to the present invention and do not necessarily constitute the prior art. [0003] The exploration of scalar field data is an important task in scientific data visualization. For example, changes in ocean currents are closely related to the salinity and temperature of seawater. Scalar field data can be converted into visual images through color coding, which helps people quickly discover, explore, and analyze the features contained in the data in an intuitive way. However, due to the limited number of colors in color coding, the diversity of scalar field data and pattern features, it is difficult to use static color tables to help ...

Claims


Application Information

Patent Timeline
Patent Type & Authority Applications(China)
IPC IPC(8): G06T11/40
CPCG06T11/40
Inventor 曾琼赵勇威
Owner SHANDONG UNIV