
Ecological space analysis method and system based on statistical unit adaptation
A technology of spatial analysis and statistical units, applied in the field of geographic information spatial analysis, can solve problems such as large differences in area, disparity, diverse analysis scenarios, and varying complexity, and achieve excellent statistical effects and high statistical efficiency.
- Summary
- Abstract
- Description
- Claims
- Application Information
AI Technical Summary
Problems solved by technology
Method used
Image


Examples
Embodiment 1
[0110] Analysis of changes in ecosystem classification within 10 kilometers of a watershed from 2015 to 2019:
[0111] First, statistical analysis parameter parsing:
[0112] Analysis range: area distribution range, without standard administrative division attributes.
[0113] Analysis scenario: analysis target data ecosystem classification, characterized by full coverage, large data volume, and high data accuracy; the analysis type is longitudinal superposition analysis of two time phases, and the analysis and calculation complexity is relatively high.
[0114] Statistical requirements for analysis results: Only the summary results within 10 kilometers of a certain watershed need to be counted.
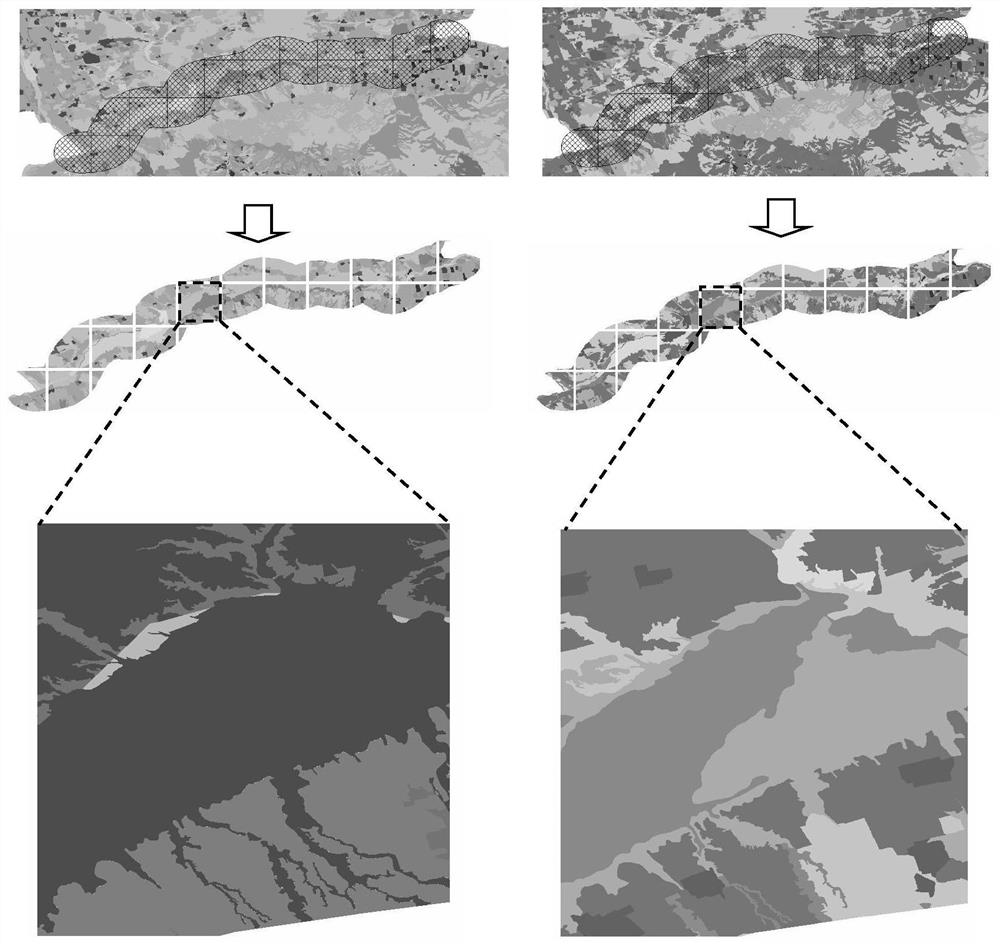
[0115] Secondly, the regular geographic grid unit is used to divide the subtasks. The key steps are as follows:
[0116] S1: Generate a regular geographic grid of appropriate size based on the 10-kilometer area of the watershed. See attached figure 2 The analysis range of the...
Embodiment 2
[0123] Analysis of human activities within the red line of ecological protection in a mountainous area in 2020:
[0124] First, statistical analysis parameter parsing:
[0125] Scope of analysis: 39 counties (districts) in a mountainous area, each with an area of more than 100 square kilometers, and 353 townships under the jurisdiction of 39 counties (districts).
[0126] Analysis scene: the horizontal overlay analysis and statistics of the two thematic data of the ecological protection red line layer and the human activity map spot, both data are not fully covered, but there are many ecological protection red line map spots and a large amount of data;
[0127] Statistical requirements for analysis results: It not only statistically displays the summary of human activities within the ecological red line of a mountainous area, but also drills to display the situation within the respective ranges of the 39 counties.
[0128] Secondly, use the administrative division unit to d...
Embodiment 3
[0135] Implementation example 3: Analysis of ecological land occupied by human activities in a designated area in 2020
[0136] Analysis of statistical analysis parameters:
[0137] Scope of analysis: the key areas composed of three provincial-level administrative divisions, and the area of the second-level administrative divisions under the three administrative divisions is mostly more than 100 square kilometers, and there are large differences in area between them.
[0138] Analysis scenario: Horizontal superposition analysis and statistics of two thematic data of human activity map and ecosystem classification, one of the two data is fully covered, and the other is not fully covered, and the amount of ecosystem classification data is relatively large;
[0139] Statistical requirements for the analysis results: not only statistically display the summary of ecological land occupation by human activities in a designated area, but also drill down to display the respective con...
PUM
 Abstract
Description
Claims
Application Information