Visual data analysis graph drawing system and method based on gplot2

A data analysis and graphics technology, applied in the field of data analysis, can solve the problems of few graphics types, few color schemes, cumbersome use, etc., and achieve the effect of rich styles, professional color schemes, and convenient settings

Pending Publication Date: 2022-04-26
SHANGHAI PERSONAL BIOTECH
View PDF5 Cites 0 Cited by
  • Summary
  • Abstract
  • Description
  • Claims
  • Application Information

AI Technical Summary

Problems solved by technology

[0005] 1) Single style: the current boxplot lacks comprehensive adjustments to graphic borders, grid lines, backgrounds, etc.
[0006] 2) Few color schemes: the existing boxplot drawing lacks professional journal color scheme integration, requires separate configuration, and is cumbersome to use
[0007] 3) Few types of graphs: the existing boxplot can only draw a single graph, and cannot conveniently draw a combination of various graphs

Method used


Image

  • Visual data analysis graph drawing system and method based on gplot2
  • Visual data analysis graph drawing system and method based on gplot2
  • Visual data analysis graph drawing system and method based on gplot2

Examples


Embodiment Construction

[0062] The term "and / or" in this article is just an association relationship describing associated objects, which means that there can be three relationships, for example, A and / or B can mean: A exists alone, A and B exist simultaneously, and there exists alone B these three situations. In addition, the character " / " in this article generally indicates that the contextual objects are an "or" relationship.

[0063] The technical solutions in the embodiments of the present application will be clearly and completely described below in conjunction with the drawings in the embodiments of the present application. It should be understood by those skilled in the art that the described embodiments are some, but not all, embodiments of the present invention. Based on the embodiments in the present application, those skilled in the art can make any appropriate modification or variation to obtain all other embodiments.

[0064] In the first aspect, the embodiment of the present inventio...


PUM


Abstract

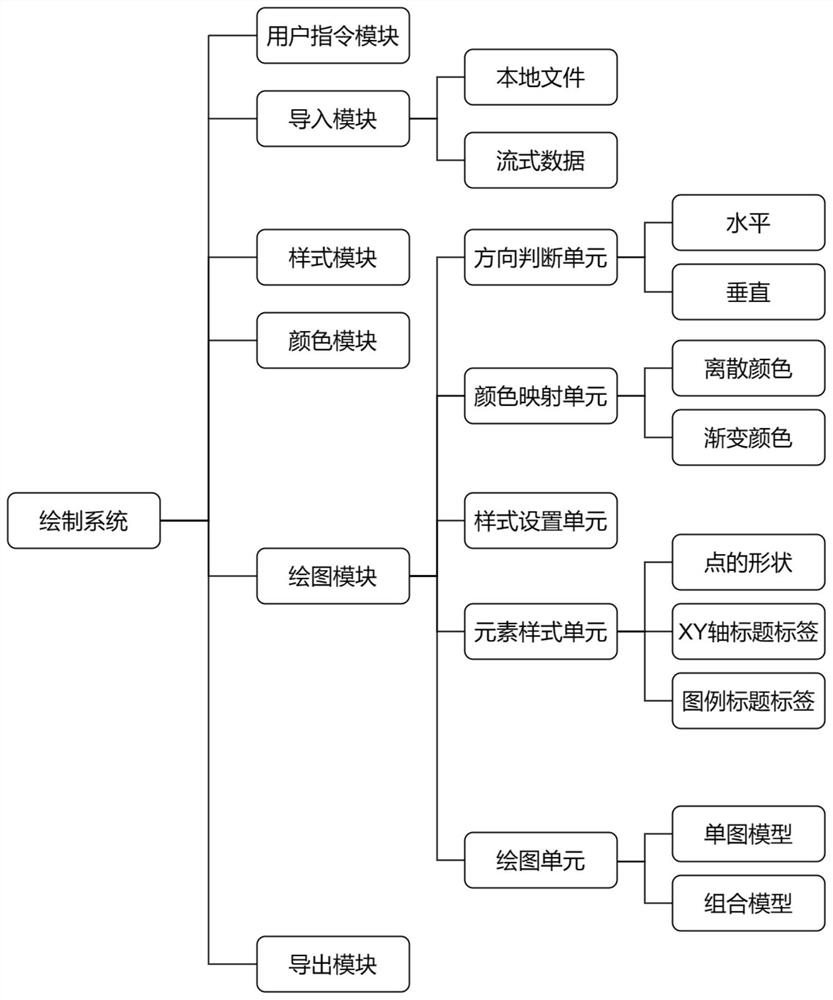
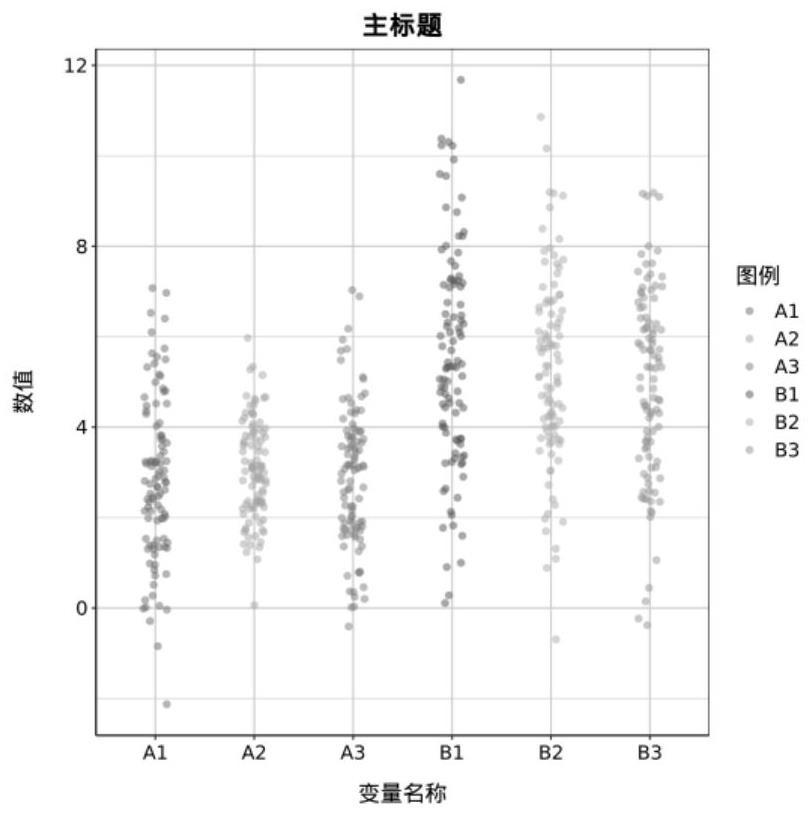
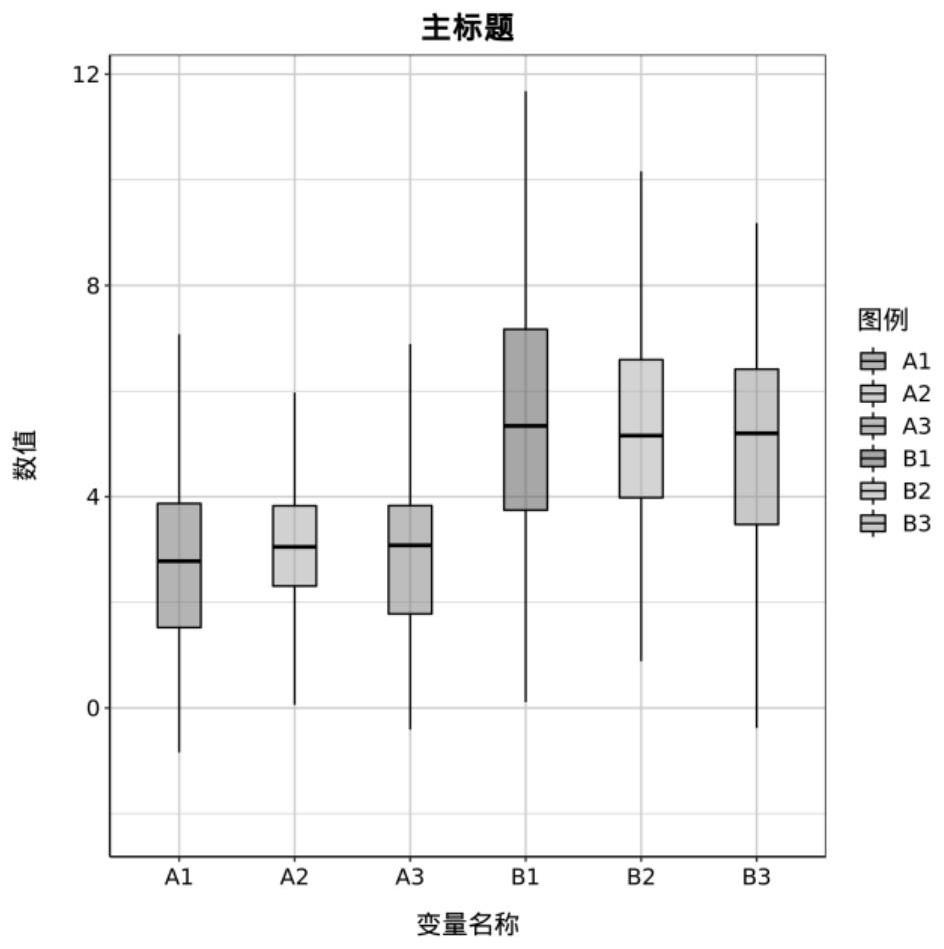
The invention provides a system and a method for drawing a visual data analysis graph based on gplot2, and the system comprises a user instruction module which is used for receiving a user instruction sent by a user; the import module is used for importing input data according to the user instruction; the drawing module is used for drawing a data analysis graph and comprises a drawing unit; the drawing unit comprises a single graph model and a combined model; the single graph model comprises a scatter diagram, a box plot and a violin graph; the combined model is a combination of two single-graph models, and comprises a scatter diagram and a box plot, a scatter diagram and a violin graph, and a box plot and a violin graph; the drawing module takes the received user instruction as a parameter to call each unit for drawing; and the export module is used for exporting the data analysis graph. According to the method, breakthroughs are made in multiple aspects of graph combination, form diversification, color specialization, data heterogeneity and the like, and richer and more professional choices are provided for data analysis visualization.

Description

technical field [0001] The invention relates to the field of data analysis, in particular to visualization technology for data analysis. Background technique [0002] In daily data analysis work, box plot is one of the commonly used tools. It can help people intuitively and clearly identify outliers in the data and judge the distribution patterns of different data. Therefore, it has been widely used in data analysis and journal articles. . [0003] The boxplot was invented by American statistician John Tukey in 1977. It consists of five numerical points: the minimum value (min), the first (lower) quartile (Q1), The median, the third (upper) quartile (Q3), the maximum value (max), and the mean (mean) can also be added to the box plot. The lower quartile, median, and upper quartile form a "box with compartments". The line extending from the upper (lower) quartile to the maximum (minimum) value is called a "whisker". [0004] With the increase in data volume and the diversi...

Claims


Application Information

Patent Timeline
Patent Type & Authority Applications(China)
IPC IPC(8): G06T11/60G06T11/00
CPCG06T11/60G06T11/001
Inventor 刘港彪孙子奎
Owner SHANGHAI PERSONAL BIOTECH
Why Eureka
Try Eureka