Industrial chain visualization method based on relationship between industry and supply chain

An industry chain and supply chain technology, applied in text database browsing/visualization, special data processing applications, unstructured text data retrieval, etc. The effect of promoting publicity and preventing data omission

Pending Publication Date: 2022-05-13
北京航天智造科技发展有限公司
View PDF0 Cites 0 Cited by
  • Summary
  • Abstract
  • Description
  • Claims
  • Application Information

AI Technical Summary

Problems solved by technology

[0010] 5. There are many other patents on supply chain visualization simulation technology, such as the research on supply chain visualization simulation technology published by Huazhong University of Science and Technology, and a supply chain-based visual inventory system and its visualization published by Luan Zhiyue Supply Chain Management Co., Ltd. Management methods, etc., are methods used to closely track the supply chain of an enterprise. Compared with the macro scope of the industrial chain, its application is limited to specific production and sales scenarios, and cannot be implemented in the entire industry.

Method used


Image

  • Industrial chain visualization method based on relationship between industry and supply chain
  • Industrial chain visualization method based on relationship between industry and supply chain
  • Industrial chain visualization method based on relationship between industry and supply chain

Examples


Embodiment 1

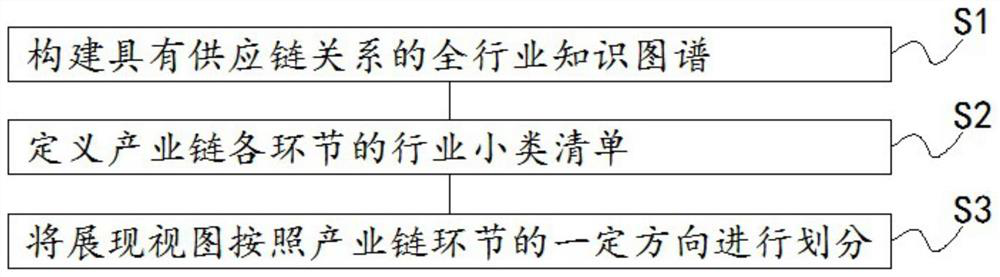
[0040] see figure 1 , an industrial chain visualization method based on the relationship between industry and supply chain, including the following steps:

[0041] S1. Build an industry-wide knowledge map with supply chain relationships.

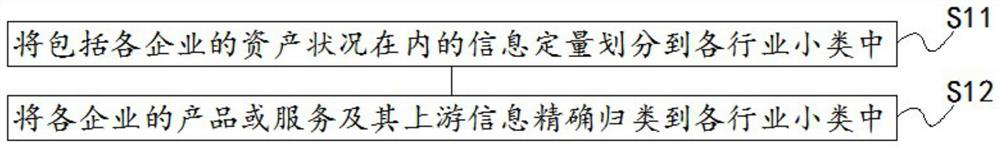
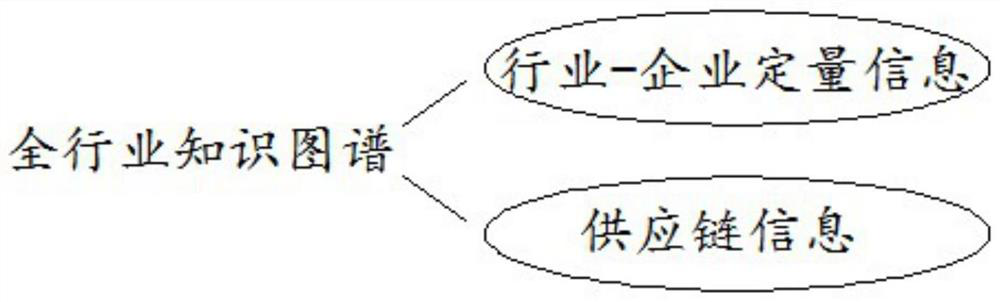
[0042] Such as figure 2 As shown, in the S1, the construction of the industry-wide knowledge map further includes the following specific processes:

[0043] S11. Quantitatively divide the information including the asset status of each enterprise into subcategories of each industry;

[0044]S12. Accurately classify the products or services of each enterprise and their upstream information into subcategories of each industry.

[0045] Furthermore, in the above S11 and S12, the industry subcategories can be classified with reference to the "National Economic Industry Classification" stipulated in GB / T4754-2017. The upstream information includes upstream raw materials, upstream components or components, and upstream technical service inform...

Embodiment 2

[0059] Based on the industrial chain visualization method based on the relationship between the industry and the supply chain described in Embodiment 1, the information of the construction industry chain is visualized. In order to form the structure of the industry chain, the government department can collect the upper, middle and lower reaches of the industry in the survey area, Enterprises, products and relationships; statistics on the overall economic scale (total assets and proportion, operating income and proportion, owner's equity, profit and proportion), total R&D expenditure, industries involved, number of products, number of enterprises, etc. In the follow-up, the method of graph calculation will be used to carry out breakpoint analysis, weak link analysis, and bottleneck product analysis, and finally displayed on the visualized knowledge map.

[0060] First, if Figure 5 As shown, through the research, we learned that the industry of the upstream products and the ind...

Embodiment 3

[0064] The present invention automates and standardizes the display method. In addition to the visualization method mentioned in the present invention, it is a unique method to use the industry list as the basis for dividing each stage of the industrial chain. In addition to this method, there are other methods to display, such as It can be displayed based on product type, based on drawing template + manual screening of related companies, etc.

[0065] The beneficial effects of the present invention are:

[0066] 1. This industrial chain visualization method based on the relationship between industry and supply chain provides clear, intuitive and objective industrial chain data display for government supervision or planning departments, early detection of weak links, precise policy implementation, and fixed-point strengthening to create a stable industrial chain state.

[0067] 2. The industrial chain visualization method based on the relationship between the industry and the ...


PUM


Abstract

The invention discloses an industry chain visualization method based on an industry and supply chain relationship, and belongs to the technical field of industry chain management, and the method comprises the following steps: S1, constructing a whole industry knowledge graph with a supply chain relationship; s2, defining an industry subclass list of each link of the industry chain; and S3, designing a visual display view, and dividing the display view according to a certain direction of industrial chain links. Through scientific industrial chain visualization, government supervision or planning departments are helped to see the whole industrial chain resource layout at a glance, find weak links as soon as possible, carry out precise strategy, strengthen at fixed points and build a stable industrial chain state; the panorama of the industrial chain is digitalized, objective and standardized, the existing manual drawing method of the industrial chain is broken, data omission is prevented, and real-time updating and automatic updating are achieved; a basic framework of a display layer is provided for calculation and reasoning of an industrial chain and a supply chain, a complex economics algorithm result is visually displayed, and the achievement publicity is promoted.

Description

technical field [0001] The invention belongs to the technical field of industrial chain management, and specifically relates to an industrial chain visualization method based on the relationship between industry and supply chain. Background technique [0002] In the process of globalization, the industrial chains of various countries are deeply integrated, and all countries enjoy the economic development brought about by the globalization of industrial chains. However, in recent years, the anti-globalization behavior of individual countries has caused a serious threat to the security of the global industrial chain. It is extremely important to use big data technology to prevent individual countries from threatening the security of the industrial chain. However, the intricate industrial chain structure brings challenges to analysis, and knowledge graph is a new technology that is very suitable for solving this intricate structure. [0003] Knowledge graph (Knowledge Graph), ...

Claims


Application Information

Patent Timeline
Patent Type & Authority Applications(China)
IPC IPC(8): G06F16/36G06F16/34
CPCG06F16/367G06F16/34
Inventor 刘东曹丽霄陈冀华羌薇李国栋孙睿杨灵运陈冬刘洋谭靖龙吕不凡张精华赵鹏程张金库
Owner 北京航天智造科技发展有限公司
Why Eureka
Try Eureka