Data visualization component method realized based on AngularJS framework

A component and data technology, applied in the field of data visualization, can solve problems such as lack of human-computer interaction on the page, inability to effectively integrate and quickly locate data model knowledge, complex chart configuration operations, etc., and achieve the effect of enriching the display form

Pending Publication Date: 2022-07-22
BEIJING UNIV OF TECH
View PDF0 Cites 0 Cited by
  • Summary
  • Abstract
  • Description
  • Claims
  • Application Information

AI Technical Summary

Problems solved by technology

However, in the current visualization system, the page lacks human-computer interaction, the chart configuration operation is complicated, and relevant knowledge such as data models cannot be effectively integrated and quickly located. The new characteristics of big data itself also put forward more urgent needs for visual analysis. With more serious challenges, from the perspective of existing data visualization analysis systems, it is of great practical significance to design a set of scientific, interactive, flexible, and intelligent data visualization component methods

Method used


Image

  • Data visualization component method realized based on AngularJS framework

Examples


Embodiment Construction

[0018] The technical solutions in the embodiments of the present invention will be clearly and completely described below with reference to the accompanying drawings in the embodiments of the present invention. Obviously, the described embodiments are only a part of the embodiments of the present invention, but not all of the embodiments. Based on the embodiments of the present invention, all other embodiments obtained by those of ordinary skill in the art without creative efforts shall fall within the protection scope of the present invention.

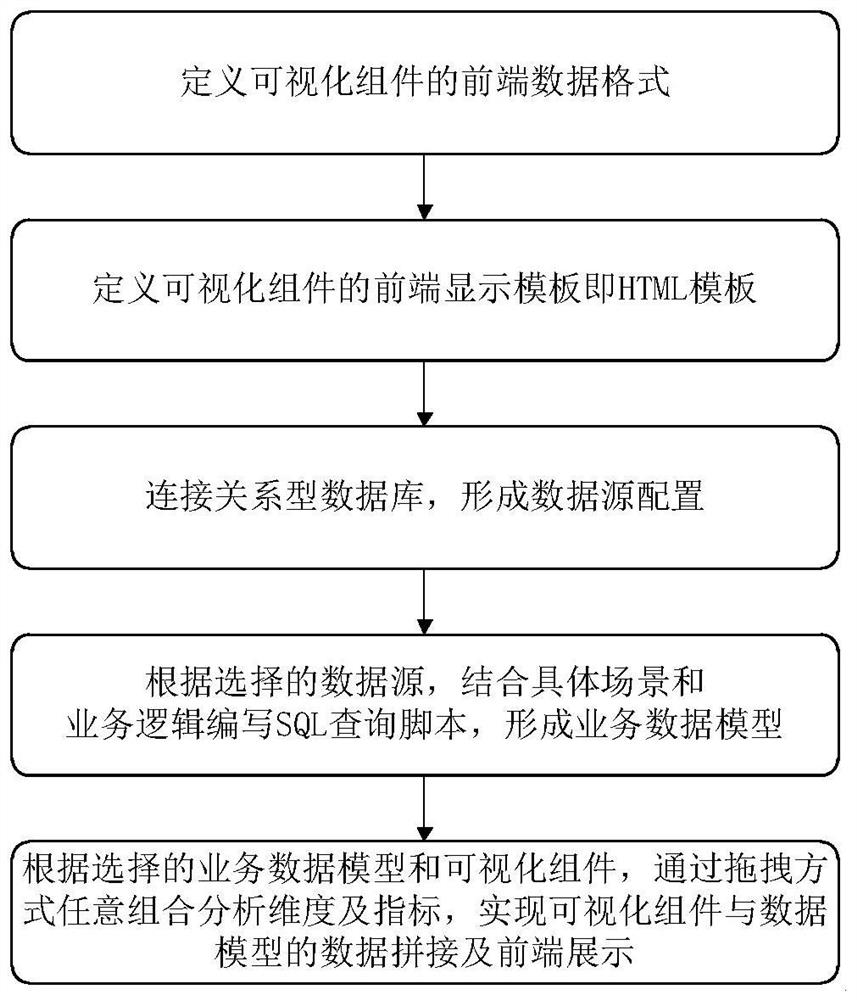
[0019] like figure 1 As shown, the present invention provides a technical solution: a data visualization component method based on the AngularJS framework, comprising the following steps:

[0020] S1. Define the front-end data format of the visualization component;

[0021] Further, the data items and configuration items required for charts such as histogram, line chart, pie chart, table, scatter chart, word cloud, etc., for example,...


PUM


Abstract

The invention relates to the technical field of data visualization, and discloses a data visualization component method implemented based on an AngularJS framework, which comprises a data visualization component and is characterized in that the data visualization component can be connected with a relational database and can select a data source and form a data model according to an actual business scene; according to the method, the Echarts chart can be packaged into a configurable visual chart, various chart components are provided for a user, and data visualization is quickly constructed; a configuration method can be provided for the customized display requirement of the chart, editing and configuration are completed through a graphical interface, the difficulty of data analysis is reduced, and the efficiency of data analysis is improved; according to the method, various visual components, such as a histogram visual component, a broken line graph visual component, a pie chart visual component, a table visual component, a scatter diagram visual component and a word cloud visual component, are realized, and the display form of data analysis is enriched.

Description

technical field [0001] The invention relates to the technical field of data visualization, in particular to a data visualization component method based on an AngularJS framework. Background technique [0002] At present, data analysis for big data has become a research hotspot and an inevitable trend. Relying only on automatic computing methods such as machine learning, it is still unable to fully meet the needs of decision analysis based on human cognitive laws. The task of human-machine collaborative analysis has received more and more attention. Data visualization focuses on showing numbers graphically, making it easier to see hidden patterns in data. On this basis, modern innovative data visualization requires that it is closer to human cognitive laws, requires data to be more humanized, can explore and stimulate human imagination, and become a powerful tool for people to analyze complex problems and make decisions in the new century. However, in the current visualizat...

Claims


Application Information

Patent Timeline
IPC IPC(8): G06F16/957G06F16/26G06F8/34G06F8/38G06F16/248G06F16/28
CPCG06F16/9577G06F16/26G06F8/34G06F8/38G06F16/248G06F16/284
Inventor 王冠张浩
Owner BEIJING UNIV OF TECH
Why Eureka
Try Eureka