Peptide array quality control
a technology of arrays and peptides, applied in the field of peptide array quality control, can solve the problems of low density and relatively low fidelity of arrays, and achieve the effect of density and sufficient fidelity
- Summary
- Abstract
- Description
- Claims
- Application Information
AI Technical Summary
Benefits of technology
Problems solved by technology
Method used
Image
Examples
example 1
orrelation Coefficient Assessment
[0155]Arrays of peptides were fabricated by in situ synthesis such that there were 330,000 peptides in each array. Twelve such arrays were subjected to immunosignaturing with six different kinds of samples. In 6 of these samples, one secondary antibody for IgM was used. In 6 of these samples, a different secondary antibody for IgG was used. Using an IgG secondary antibody accidentally instead of an IgM secondary could represent an “error” in the assay condition that would alter the overall pattern of binding observed.
[0156]Correlation coefficients were determined between all possible pairs of arrays (Pearson Correlation). The average correlation coefficient between the samples that used the IgM secondary antibody was 0.92+ / −0.02 (these numbers represent that average and the standard deviation, SD). The correlation coefficient between IgM and IgG samples on average was 0.59+ / −0.06. Each of the individual samples that “mistakenly” used IgG had correlat...
example 2
Array Binding Intensity Pattern to Fabrication Sequence
[0159]An array of peptides, with known peptide sequences, was generated by a mask-based, in situ synthetic process on a silicon oxide surface. Each step in the process consisted of the removal of a blocking group from the end of a subset of the growing peptides and addition of a specific amino acid only to those positions until the desired peptide length was achieved.
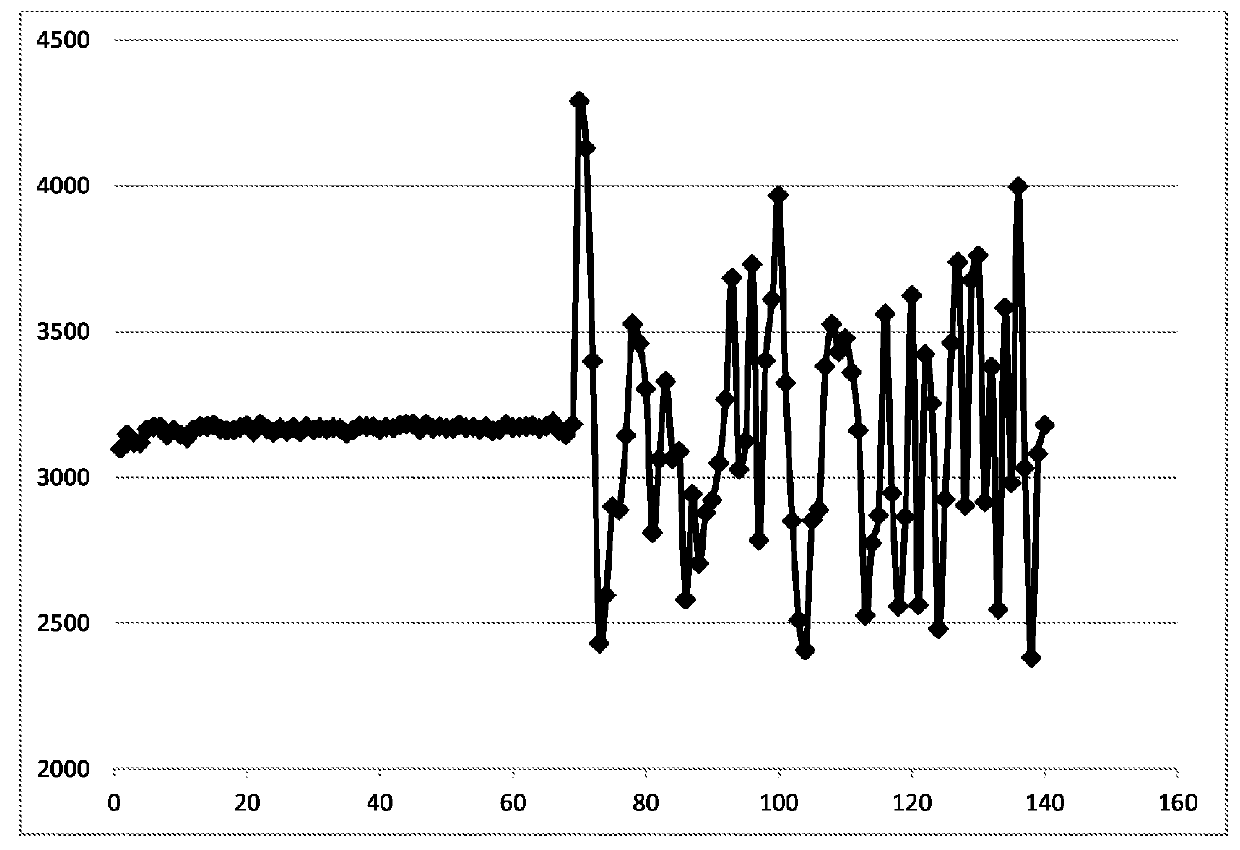
[0160]The peptide array was then exposed to a sample of human serum and the IgG bound was quantified by addition of a labeled secondary antibody and visualized. The synthesis of the array deliberately left out the first half of the masks (i.e., those steps were not performed), simulating failed steps in the synthesis (masks 1-69). Masks 70-140 were used properly to synthesize, and subsequently lengthen, peptides on the array.
[0161]The average intensity values measured for the subset of peptides only that should have been modified by each of the synthesis steps above...
example 3
Array Binding Intensity Pattern to Fabrication Sequence
[0166]Another way of averaging the data and determining if an amino acid addition step may have failed during synthesis, is based on the position and the monomer added. This may be distinct from the step of the synthesis if a particular step adds a particular monomer at different positions within a peptide.
[0167]The example shown in Table 1 is for a peptide array produced on a surface. The peptide array consisted of 330,000 peptides. The peptide array was exposed to a sample of human serum as above, and the IgG bound to the array from the sample was detected with labeled secondary antibody and visualized. The average value of the intensity of IgG binding to each peptide that had a particular monomer at a particular position is determined relative to the average intensity over the whole array (i.e. all 330,000 peptides), to obtain a relative value of IgG binding to a particular monomer to a particular position. A matrix of positi...
PUM
| Property | Measurement | Unit |
|---|---|---|
| threshold level | aaaaa | aaaaa |
| threshold level | aaaaa | aaaaa |
| threshold level | aaaaa | aaaaa |
Abstract
Description
Claims
Application Information
 - R&D
- Intellectual Property
- Life Sciences
- Materials
- Tech Scout
- Unparalleled Data Quality
- Higher Quality Content
- 60% Fewer Hallucinations
Browse by: Latest US Patents, China's latest patents, Technical Efficacy Thesaurus, Application Domain, Technology Topic, Popular Technical Reports.
© 2025 PatSnap. All rights reserved.Legal|Privacy policy|Modern Slavery Act Transparency Statement|Sitemap|About US| Contact US: help@patsnap.com


