Computational analysis of biological data using manifold and a hyperplane

a biological data and hyperplane technology, applied in the field of computational analysis, can solve the problems of ineffective abx, prolonged hospitalization, reducing the quality of healthcare, etc., and achieve the effect of accurately distinguishing between bacteria

Active Publication Date: 2019-05-28
MEMED DIAGNOSTICS
View PDF100 Cites 11 Cited by
  • Summary
  • Abstract
  • Description
  • Claims
  • Application Information

AI Technical Summary

Problems solved by technology

One type of Abx misuse is when the drug is administered in case of a non-bacterial disease, such as a viral infection, for which Abx is ineffective.
The health-care and economic consequences of the Abx over-prescription include: (i) the cost of antibiotics that are unnecessarily prescribed globally, estimated at >$10 billion annually; (ii) side effects resulting from unnecessary Abx treatment are reducing quality of healthcare, causing complications and prolonged hospitalization (e.g. allergic reactions, Abx associated diarrhea, intestinal yeast etc.) and (iii) the emergence of resistant strains of bacteria as a result of the overuse (the CDC has declared the rise in antibiotic resistance of bacteria as “one of the world's most pressing health problems in the 21st century” (Arias, C. A. and B. E. Murray 2009; “CDC—About Antimicrobial Resistance” 2011).
Current solutions (such as culture, PCR and immunoassays) do not fulfill all these requirements: (i) Some of the assays yield poor diagnostic accuracy (e.g. low sensitivity or specificity)(Uyeki et al.
2009), and are restricted to a limited set of bacterial or viral strains; (ii) they often require hours to days; (iii) they do not distinguish between pathogenic and non-pathogenic bacteria (Del Mar, C 1992), thus leading to false positives; (iv) they often fail to distinguish between a mixed and a pure viral infections and (v) they require direct sampling of the infection site in which traces of the disease causing agent are searched for, thus prohibiting the diagnosis in cases where the pathogen resides in an inaccessible tissue, which is often the case.

Method used


Image

  • Computational analysis of biological data using manifold and a hyperplane
  • Computational analysis of biological data using manifold and a hyperplane
  • Computational analysis of biological data using manifold and a hyperplane

Examples


example 1

A Host-Proteome Signature for Distinguishing Between Bacterial and Viral Infections: A Prospective Multi-center Observational Study

[0420]Methods

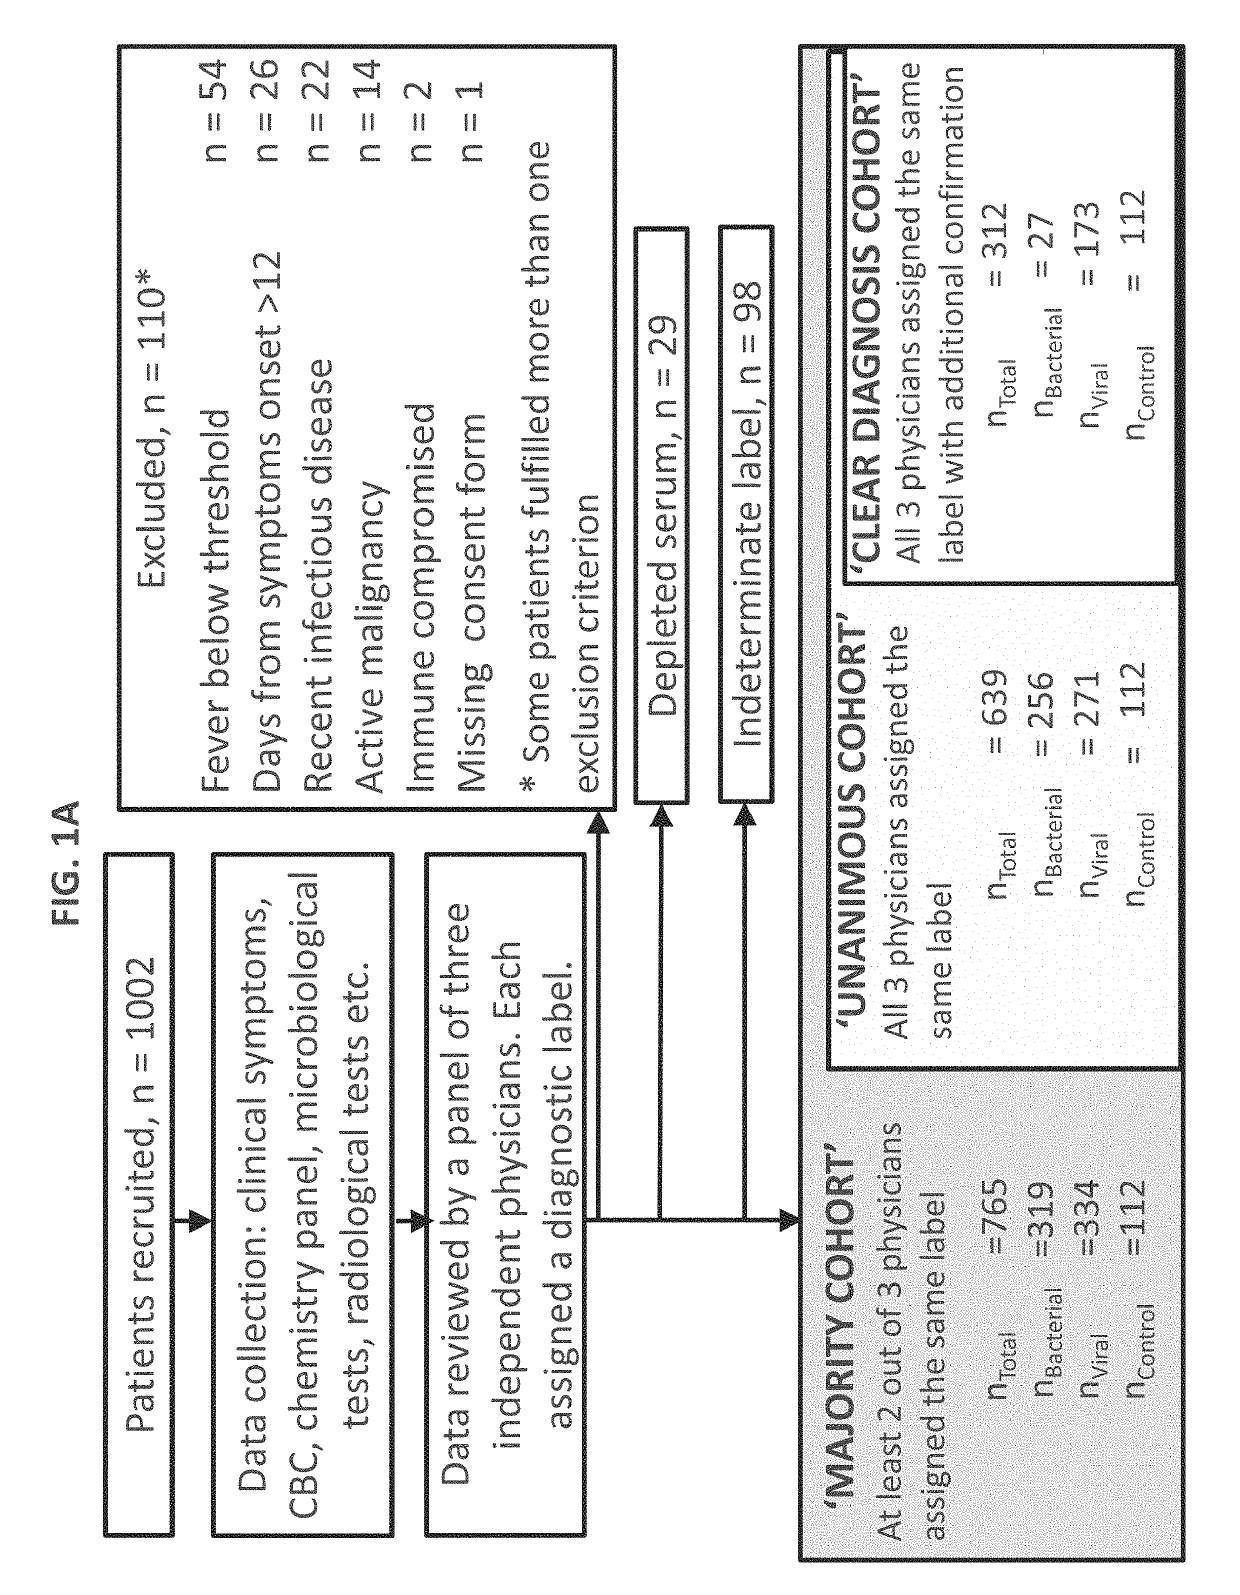
[0421]Study population: A total of 1002 patients took part in the study. Pediatric patients (≤18 years) were recruited from pediatric emergency departments (PED), pediatric wards and surgical departments, and adults (>18 years) from emergency departments (ED), internal medicine departments and surgical departments. Informed consent was obtained from each participant or legal guardian, as applicable. Inclusion criteria for the infectious disease cohort included: clinical suspicion of an acute infectious disease, peak fever >37.5° C. since symptoms onset, and duration of symptoms ≤12 days. Inclusion criteria for the control group included: clinical impression of a non-infectious disease (e.g. trauma, stroke and myocardial infarction), or healthy subjects. Exclusion criteria included: evidence of any episode of acute infectious disease in the t...

example 2

A Host-Proteome Signature for Distinguishing Between Bacterial and Viral Infections: A Prospective Multi-Center Observational Study—Supplementary Material

[0452]Measures of accuracy: The signature integrates the levels of three protein biomarkers measured in a subject, and computes a numerical score that reflects the probability of a bacterial vs. viral infection. To quantify the diagnostic accuracy of the signature a cutoff on the score was used and the following measures were applied: Sensitivity, specificity, positive predictive value (PPV), negative predictive value (NPV), total accuracy, positive likelihood ratio (LR+), negative likelihood ratio (LR−), and diagnostic odds ratio (DOR). These measures are defined as follows:

[0453]⁢Sensitivity=TPTP+FN⁢Specificity=TNTN+FP⁢total⁢⁢accuracy=TP+TNTP+FN+TN+FPPPV=TPTP+FP=sensitivity·prevalencesensitivity·prevalence+(1-s⁢pecificity)·(1-prevalence)NPV=TNTN+FN=specificity·(1-prevalence)specificity·(1-prevalence)+(1-sensitivity)·(prevalence)⁢...

example 3

Trinary Classifier Outperforms a Binary Classifier

[0499]In the binary model the classifier is trained by classifying all samples as either ‘Bacterial’ or ‘Non-bacterial’ (‘Viral’ and ‘Non-infectious’ are grouped). In the trinary model, the classifier learns to distinguish between three classes ‘Bacterial’, ‘Viral’ and ‘Non-infectious’. The probability of the viral and the non-infectious are then grouped together to give the probability of ‘non-bacterial’. This was demonstrated on the present data.

[0500]Both of the above classifiers were evaluated using a leave 10%-out cross-validation on both the Majority and Unanimous cohorts.

[0501]Results

[0502]Running the binary classifier on the majority cohort yields the results as summarized in Table 10C, herein below:

[0503]

TABLE 10CReference classViral andnon-Bacterialinfectious(B)(V + NI)63411V + NI25635B

[0504]The sensitivity of the classifier on the Majority cohort is 80.3% and the specificity is 92.2%.

[0505]Running the multinomial based cla...


PUM


Abstract

A method of analyzing biological data containing expression values of a plurality of polypeptides in the blood of a subject. The method comprises: calculating a distance between a segment of a curved line and an axis defined by a direction, the distance being calculated at a point over the curved line defined by a coordinate along the direction. The method further comprises correlating the distance to the presence of, absence of, or likelihood that the subject has, a bacterial infection. The coordinate is defined by a combination of the expression values, wherein at least 90% of the segment is between a lower bound line and an upper bound line.

Description

RELATED APPLICATIONS[0001]This application is a National Phase of PCT Patent Application No. PCT / IL2015 / 050823 having International filing date of Aug. 12, 2015, which claims the benefit of priority under 35 USC § 119(e) of U.S. Provisional Patent Application Nos. 62 / 037,180 filed on Aug. 14, 2014, and 62 / 105,938 filed on Jan. 21, 2015, The contents of the above applications are all incorporated by reference as if fully set forth herein in their entirety.SEQUENCE LISTING STATEMENT[0002]The ASCII file, entitled 68335SequenceListing.txt, created on Feb. 13, 2017, comprising 190,563 bytes, submitted concurrently with the filing of this application is incorporated herein by reference. The sequence listing submitted herewith is identical to the sequence listing forming part of the international application.FIELD AND BACKGROUND OF THE INVENTION[0003]The present invention, in some embodiments thereof, relates to computational analysis, and, more particularly, but not exclusively, to comput...

Claims


Application Information

Patent Timeline
Patent Type & Authority Patents(United States)
IPC IPC(8): G06F19/12G06F19/18G06F19/24G16H50/50G06F17/18G06F19/20G16B5/20G16B20/20G16B25/10G16B40/20G16B40/30
CPCG06F19/12G06F17/18G06F19/18G06F19/24G16H50/50G06F19/20Y02A90/26G16B20/00G16B25/00G16B40/00G16B5/00G16B40/30G16B20/20G16B40/20G16B25/10G16B5/20Y02A90/10G01N33/569G01N33/56911G01N33/56983G16B99/00
Inventor EDEN, ERANOVED, KFIRNAVON, ROYCOHEN-DOTAN, ASSAFBOICO, OLGA
Owner MEMED DIAGNOSTICS
Why Eureka
Try Eureka