
Efficient cross customer analytics

a cross-customer and analytics technology, applied in the field of data management, analysis and reporting, can solve the problems of difficult to come up with comparable metrics, difficult to determine industry comparatives, and difficult to compare data across organizations

Active Publication Date: 2019-11-05
DIGITAL AI SOFTWARE INC
View PDF19 Cites 2 Cited by
  • Summary
  • Abstract
  • Description
  • Claims
  • Application Information

AI Technical Summary

Benefits of technology

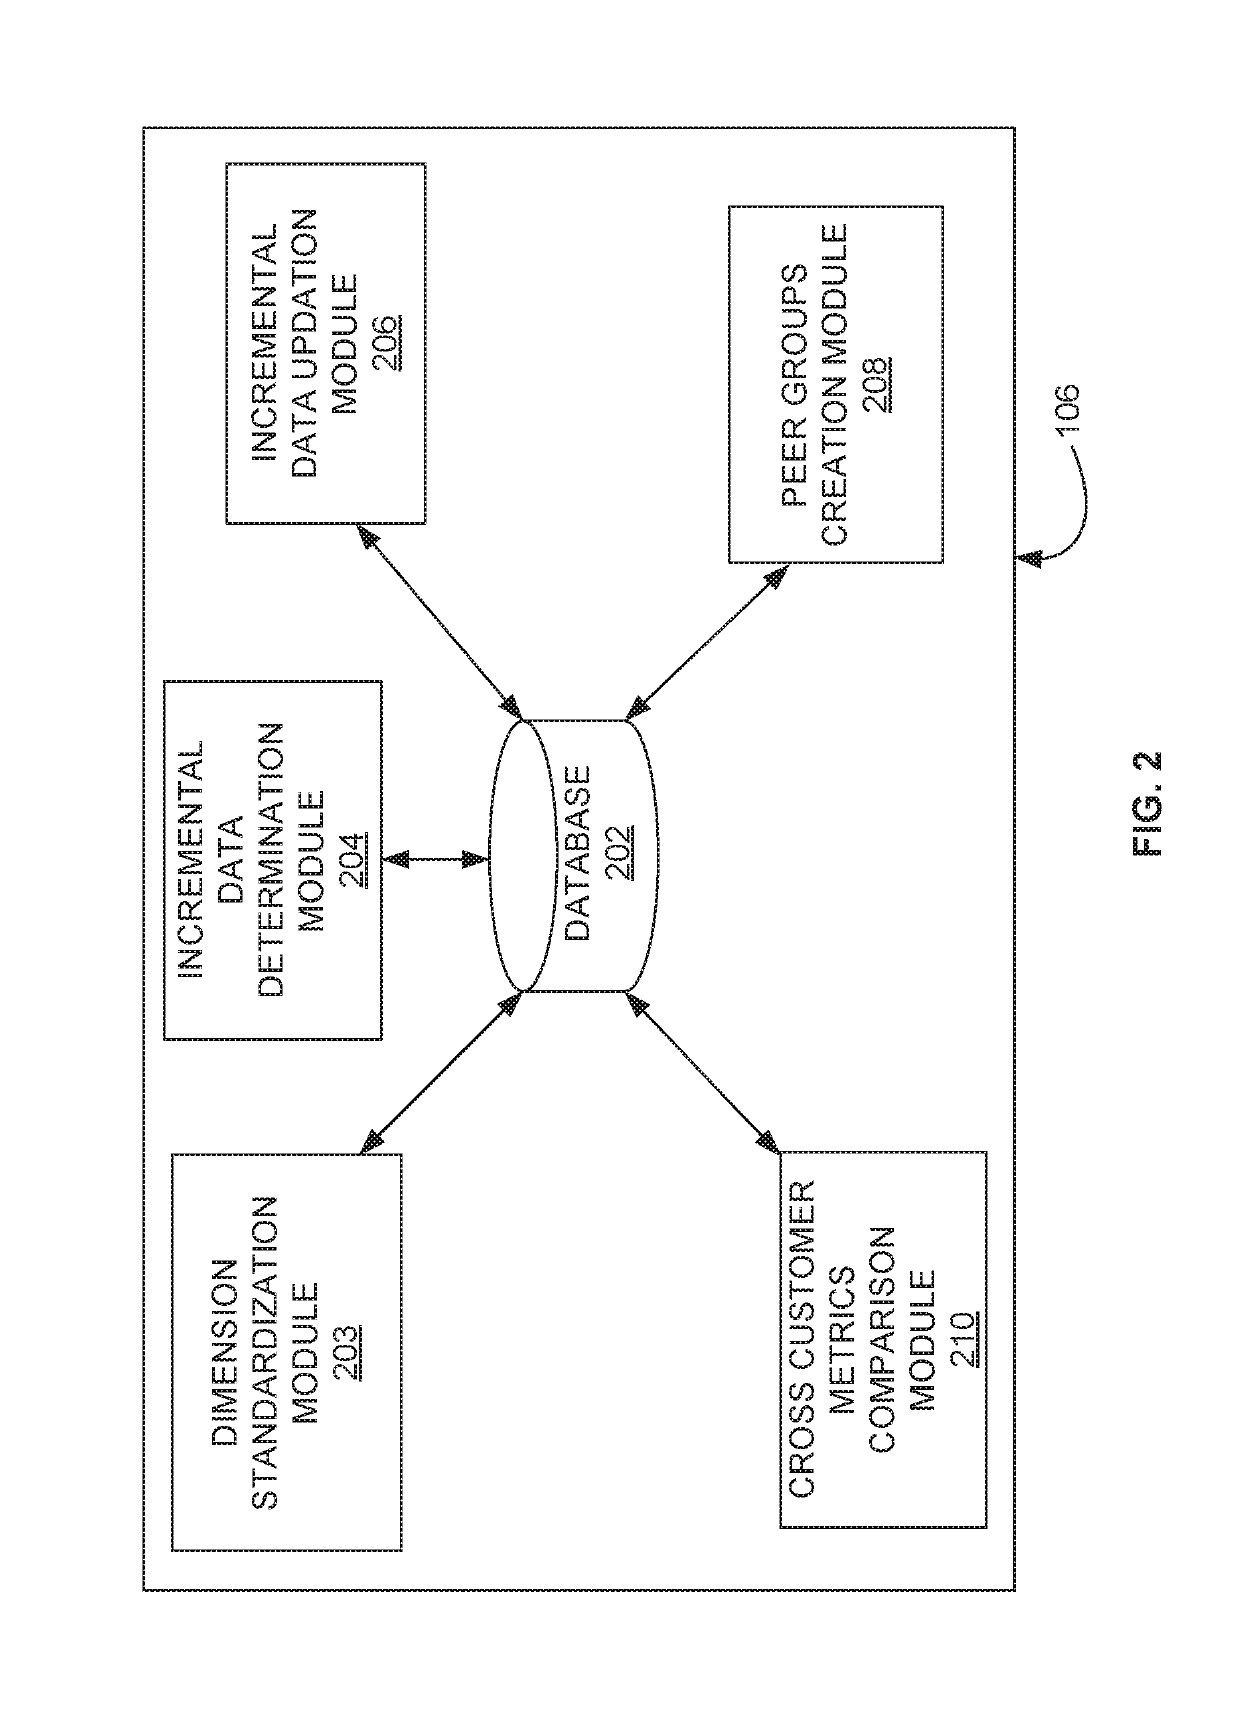
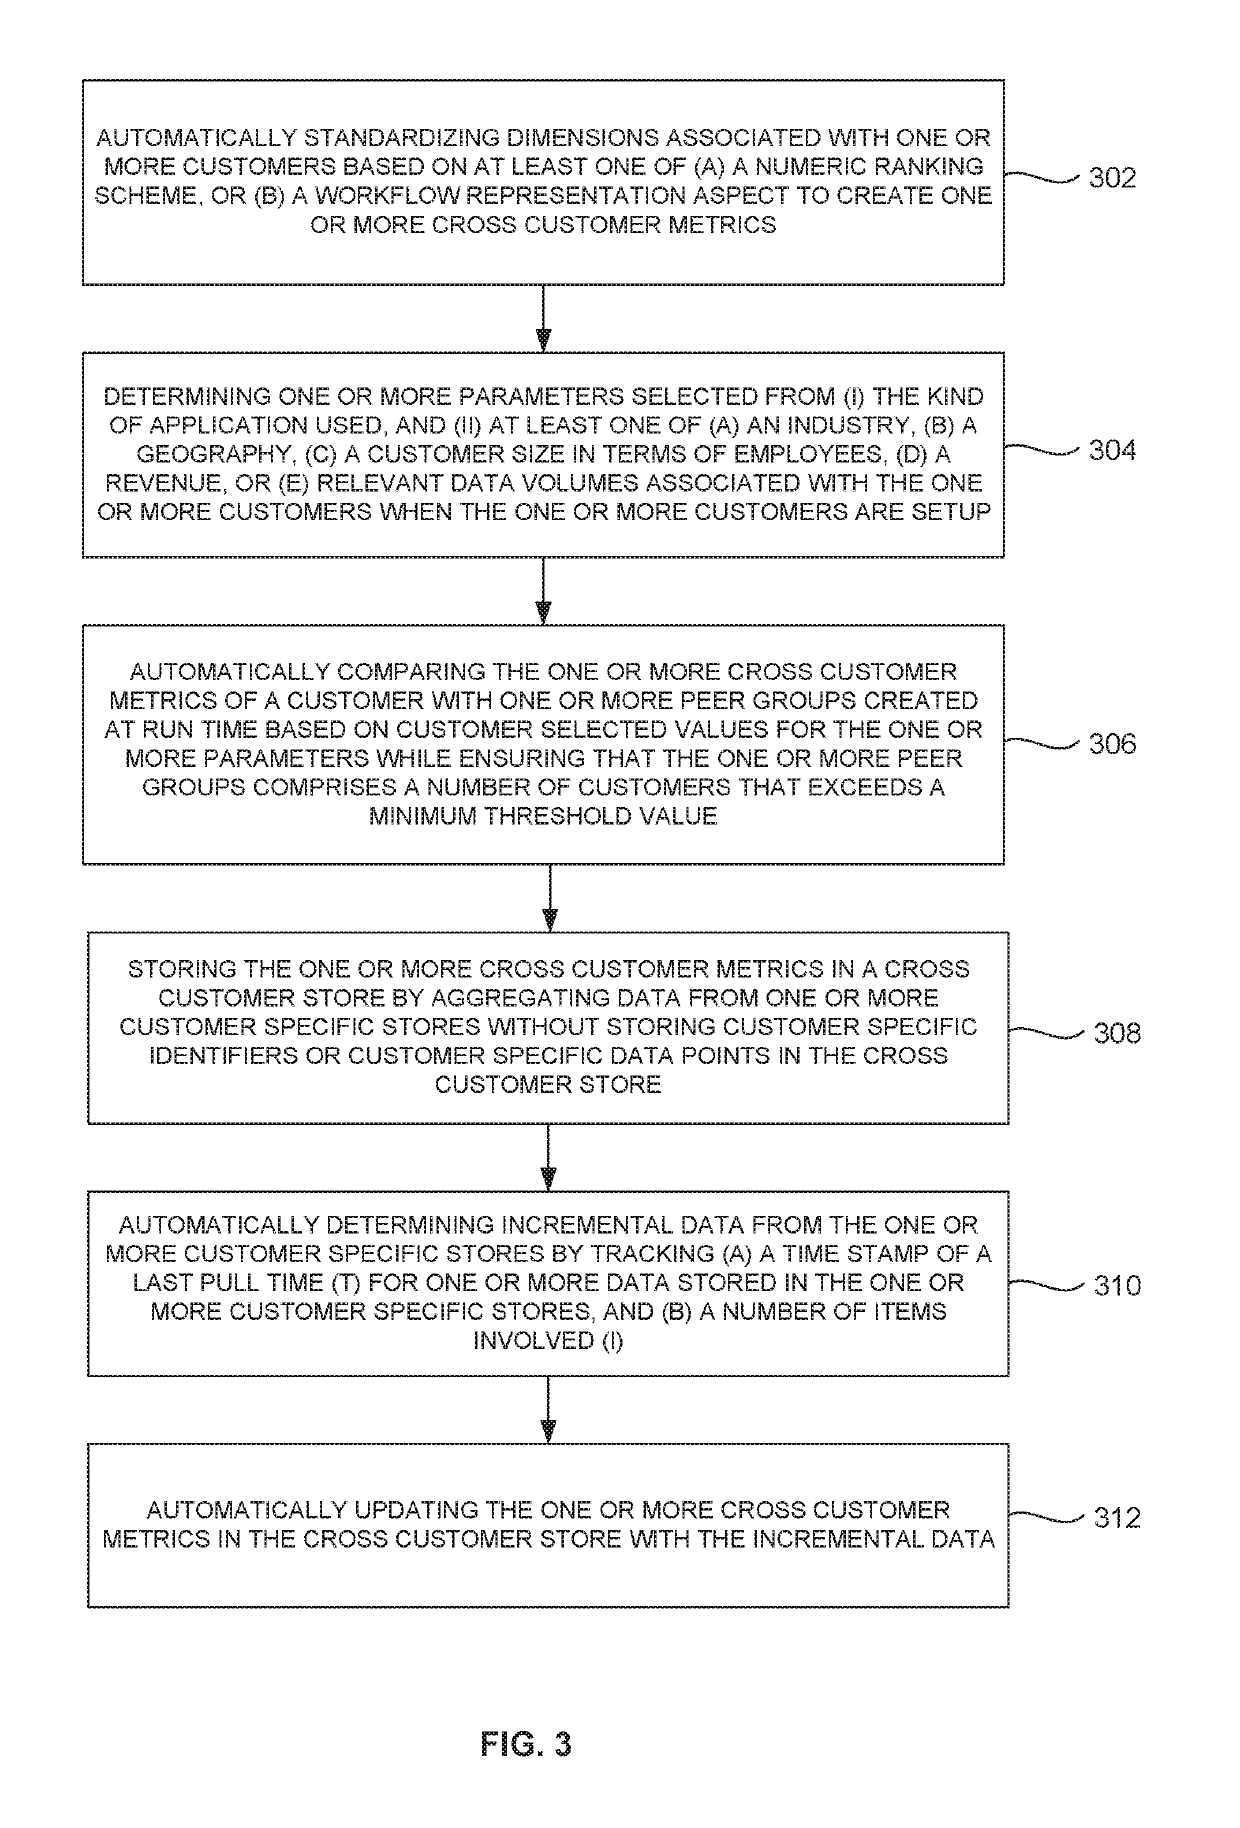
The patent describes a method for automatically analyzing data from different customers and creating a cross customer analytics store. The method involves storing cross customer metrics in a cross customer store by aggregating data from customer specific stores. The method also includes steps for automatically determining relevant data points and updating the cross customer metrics when a new customer is setup. The method can be used to compare customer data with peer groups and create new customer specific stores based on the customer's industry, geography, revenue, and relevant data volumes. The method also includes steps for automatically standardizing dimensions and duration of workflows across customers. Overall, the method provides a way for analyzing customer data and creating a cross customer analytics store.

Problems solved by technology

Comparing data across organizations to come up with comparable metrics is very difficult because organization's data values are stored at different places and are not directly comparable.
First, if the organization's data is on premise getting it into a common model, to a common place for cross customer analysis is very difficult because the organization's data are stored in different places in diverse models using different technologies.
Even with the common data warehousing software vendor who has the data for different customer organizations, problems like bucketing organizations into comparable “peer” groups, computing meaningful metrics for each domain (like IT or Marketing) that different customers would care about, and computing comparable metrics across customers still remain.
However, given that this information may be valuable to competitors; many organizations maintain such sensitive information in confidence.
As a result, it is often difficult to determine industry comparatives.
Returning to the examples above, an organization may not share the amount invested in research for fear that transparent exposure of such information could be utilized by competitors in an adverse fashion.
In instances where an industry is comprised of non-publicly traded companies lacking regulatory reporting requirements, gathering such information may be further burdensome.
As a result, organizations may benefit from sharing organization specific information wherein the information cannot be effectively linked to the specific source so the competitors cannot identify individual organization data points.

Method used


Image

  • Efficient cross customer analytics
  • Efficient cross customer analytics
  • Efficient cross customer analytics

Examples


Embodiment Construction

[0036]The embodiments herein and the various features and advantageous details thereof are explained more fully with reference to the non-limiting embodiments that are illustrated in the accompanying drawings and detailed in the following description. Descriptions of well-known components and processing techniques are omitted so as to not unnecessarily obscure the embodiments herein. The examples used herein are intended merely to facilitate an understanding of ways in which the embodiments herein may be practiced and to further enable those of skill in the art to practice the embodiments herein. Accordingly, the examples should not be construed as limiting the scope of the embodiments herein.

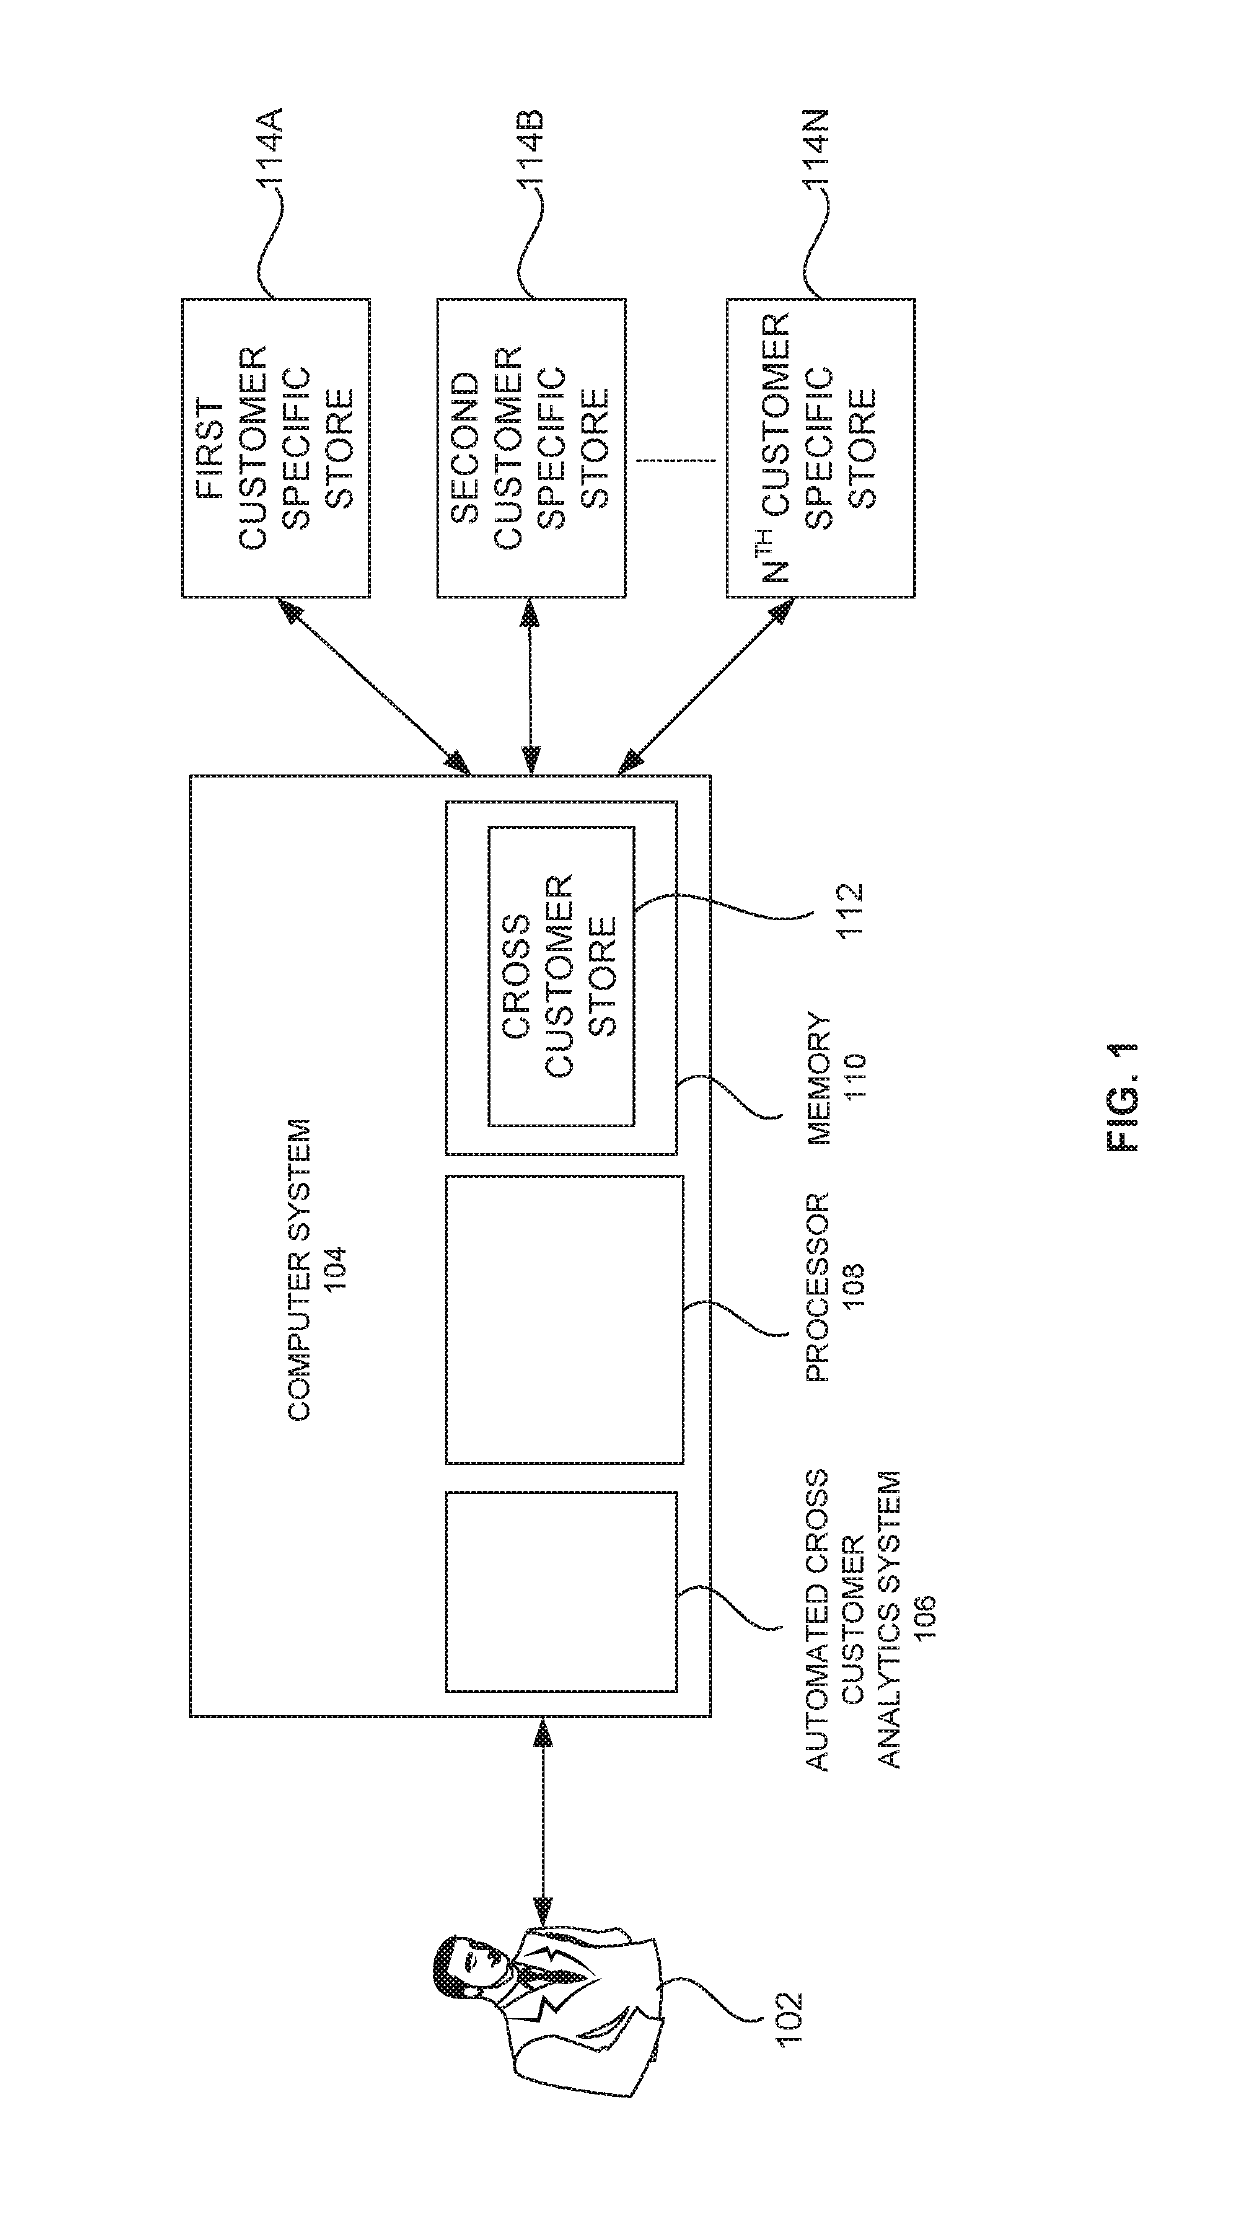
[0037]Various embodiments of the methods and systems disclosed herein provide a system for aggregating industry specific information and displaying such information without divulging the specific source of the information. The system may (i) store one or more cross customer metrics in a cross c...


PUM


Abstract

A method for automatically determining one or more cross customer metrics from a cross customer store for cross customer analytics is provided. The method includes the steps of: (i) automatically standardizing dimensions associated with the one or more customers to create one or more cross customer metrics; (ii) automatically determining incremental data from one or more customer specific stores by tracking (a) a time stamp of a last pull time (T) for customer data stored in the one or more customer specific stores, and (b) a number of items involved (I); (iii) automatically updating the one or more cross customer metrics in the cross customer store with the incremental data; and (iv) automatically comparing the one or more cross customer metrics of a customer with one or more peer groups created at run time based on customer selected values for one or more parameters.

Description

BACKGROUNDTechnical Field[0001]The embodiments herein generally relate to management, analysis and reporting of data across various data sources, and more specifically to a system and method for providing efficient customer analytics solution integrated with statistical models and business reports to an enterprise.Description of the Related Art[0002]There are many factors that may be analyzed to assess the health of an organization. One could look to a stock price or net profits to determine the financial stability of a given organization. As used herein, the term “organization” is intended to include, but is not limited to, a company, corporation, entity, individual, or the like. Another method for assessing the vitality of an organization is to compare the performance of the organization against like organizations. A comparison between like organizations may provide a more accurate representation of an organization's performance than a stock price or net profit, which may fluctuat...

Claims


Application Information

Patent Timeline
Patent Type & Authority Patents(United States)
IPC IPC(8): G06Q30/02G06F16/23
CPCG06Q30/0201G06F16/2322
Inventor KAPOOR, RAHULCHINTALAPATI, RENU
Owner DIGITAL AI SOFTWARE INC
Learn More