Method and apparatus for analyzing performance of data processing system

performance analysis technology, applied in the field of analysis of the performance of a data processing system, can solve the problems of difficult observation and isolation of undesirable system performance and behavior, software developers usually require a period of time to identify and resolve functional and performance issues, and instrumented code can be analyzed

Inactive Publication Date: 2003-07-10
ZHIGU HLDG
View PDF0 Cites 52 Cited by
  • Summary
  • Abstract
  • Description
  • Claims
  • Application Information

AI Technical Summary

Benefits of technology

[0028] The developer can specify by means of a "filter" what to look for in the system under examination. This narrows the scope of the search to what is of interest to the developer and reduces the burden on the performance monitoring system.
[0033] In another aspect, the invention comprises filter reduction features with which the developer can specify exactly what information within the network is of interest. Filter reduction is used to narrow the scope of the filter to extract only the information of interest and hence reduce the performance impact of monitoring.
[0035] In another aspect, the invention comprises a filter user interface which is a graphical representation of the machines, entities, and events making up the network. The user can easily pick those of interest, using displayed lists and Boolean operator tabs, or can simply write an order in text format which is converted to the appropriate filter.
[0080] MTS--Microsoft Transaction Server (MTS), a feature of the Microsoft Windows NT Server.RTM. operating system that facilitates the development and deployment of server-centric applications built using Microsoft's Component Object Model (COM) technologies.

Problems solved by technology

In the field of data processing it is a well known problem that software developers usually require a period of time to identify and resolve functional and performance issues in the code they have written or integrated.
Particularly in the area of distributed computer networks, it can be extremely difficult for software developers to observe and isolate undesirable system performance and behavior.
There are several serious deficiencies with the prior approach.
One problem is that only instrumented code can be analyzed.
This is a serious issue with the widespread use of operating system services and component technology in today's applications.
Users are typically unable to recompile operating system and third party components, because they do not have physical or legal access to the source code.
When they do have access to the source code, they are still unable to instrument them effectively, because they do not understand the component source code that they do have.
Another problem is that the modifications to code made by developers in an attempt to analyze its performance themselves adversely impact the application's performance.
Even if the input / output (I / O) is buffered asynchronously, it can have an adverse impact on the application being monitored (e.g. masking actual application I / O).
A further problem is that understanding control flow during transitions is very hard.
Since events have to be manually merged by the developer, it is typically hard to determine which suspension in one process corresponds to resumption in another.
An additional problem is that frequently there are a large number of application areas that might need to be analyzed; however, not all of them may need to be analyzed at the same time.
Otherwise, the load of all of the instrumentation has a severe impact on the analysis.
This also requires a complex mechanism for developers to specify which information to collect on which machine.
Yet another problem is that for distributed applications, logs from multiple machines (and often multiple logs per machine) must be merged and sorted.
Without synchronized clocks, this task is very difficult.
Manually analyzing and isolating performance problems from this amount of data is a very complex and difficult task.
One further problem with known performance analysis of data processing systems is that very often such analysis provides opportunities for breaching the data security of such systems.
It can track the free space on a disk, monitor network usage, and so on, but it cannot gather event-based information, such as what function was most recently started.
Profilers typically have a massive impact on the performance and behavior of an application, because they are intrusive, and they typically require special compiler support.
Their data is so detailed that it is normally impractical to use them, particularly in a distributed computing environment such as the one described above.

Method used


Image

  • Method and apparatus for analyzing performance of data processing system
  • Method and apparatus for analyzing performance of data processing system
  • Method and apparatus for analyzing performance of data processing system

Examples


Embodiment Construction

Collection, Capture & Transmission of Data

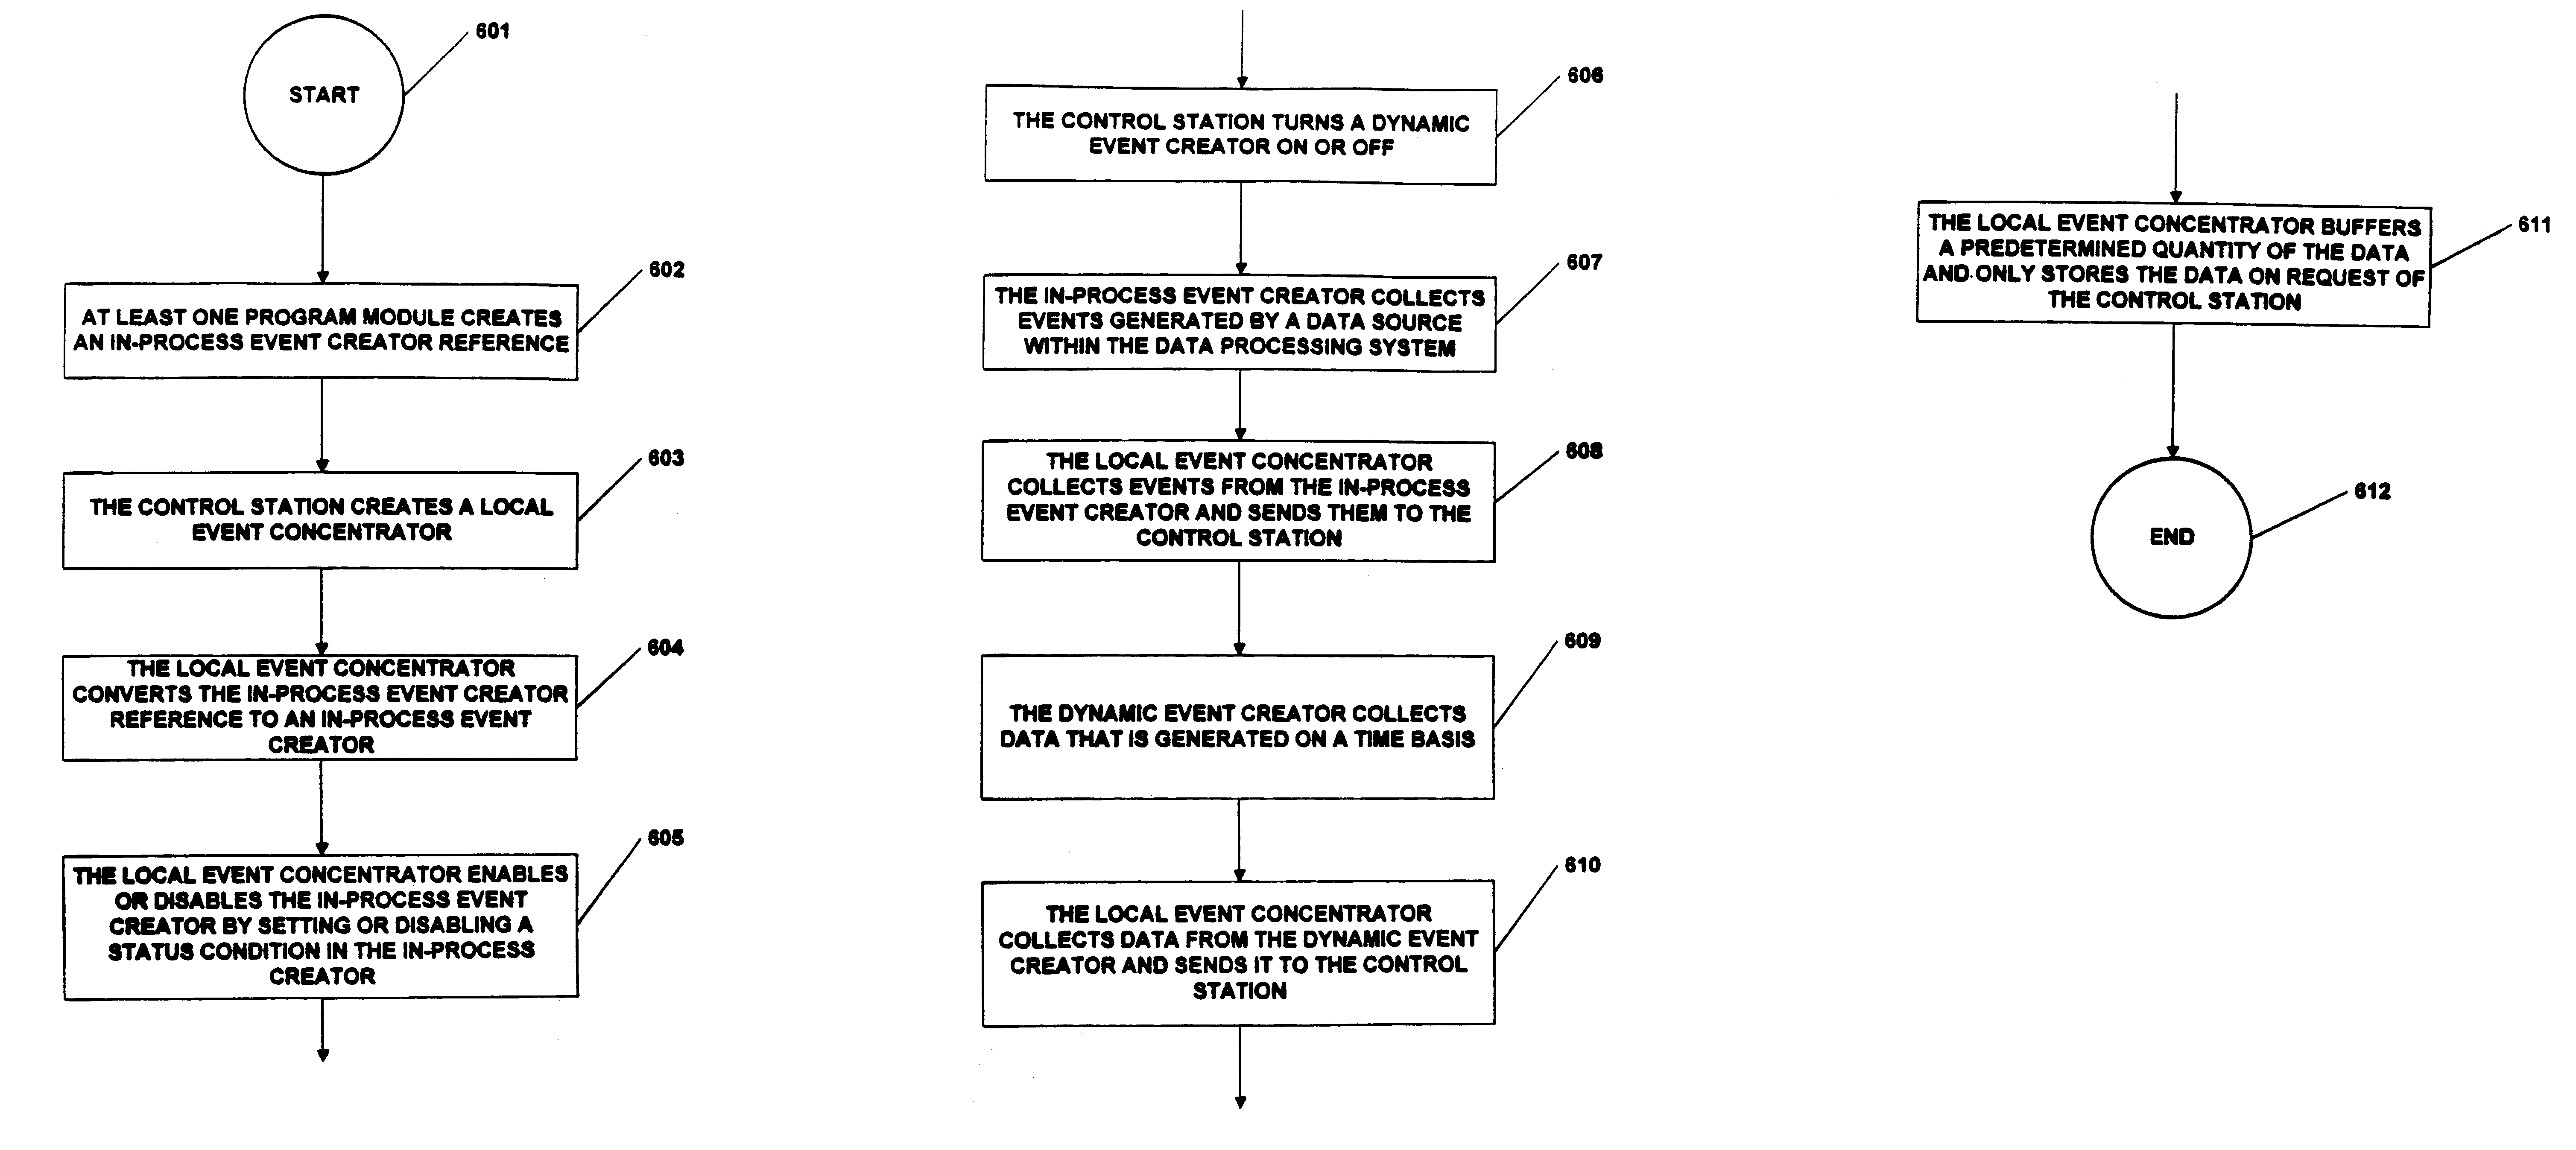
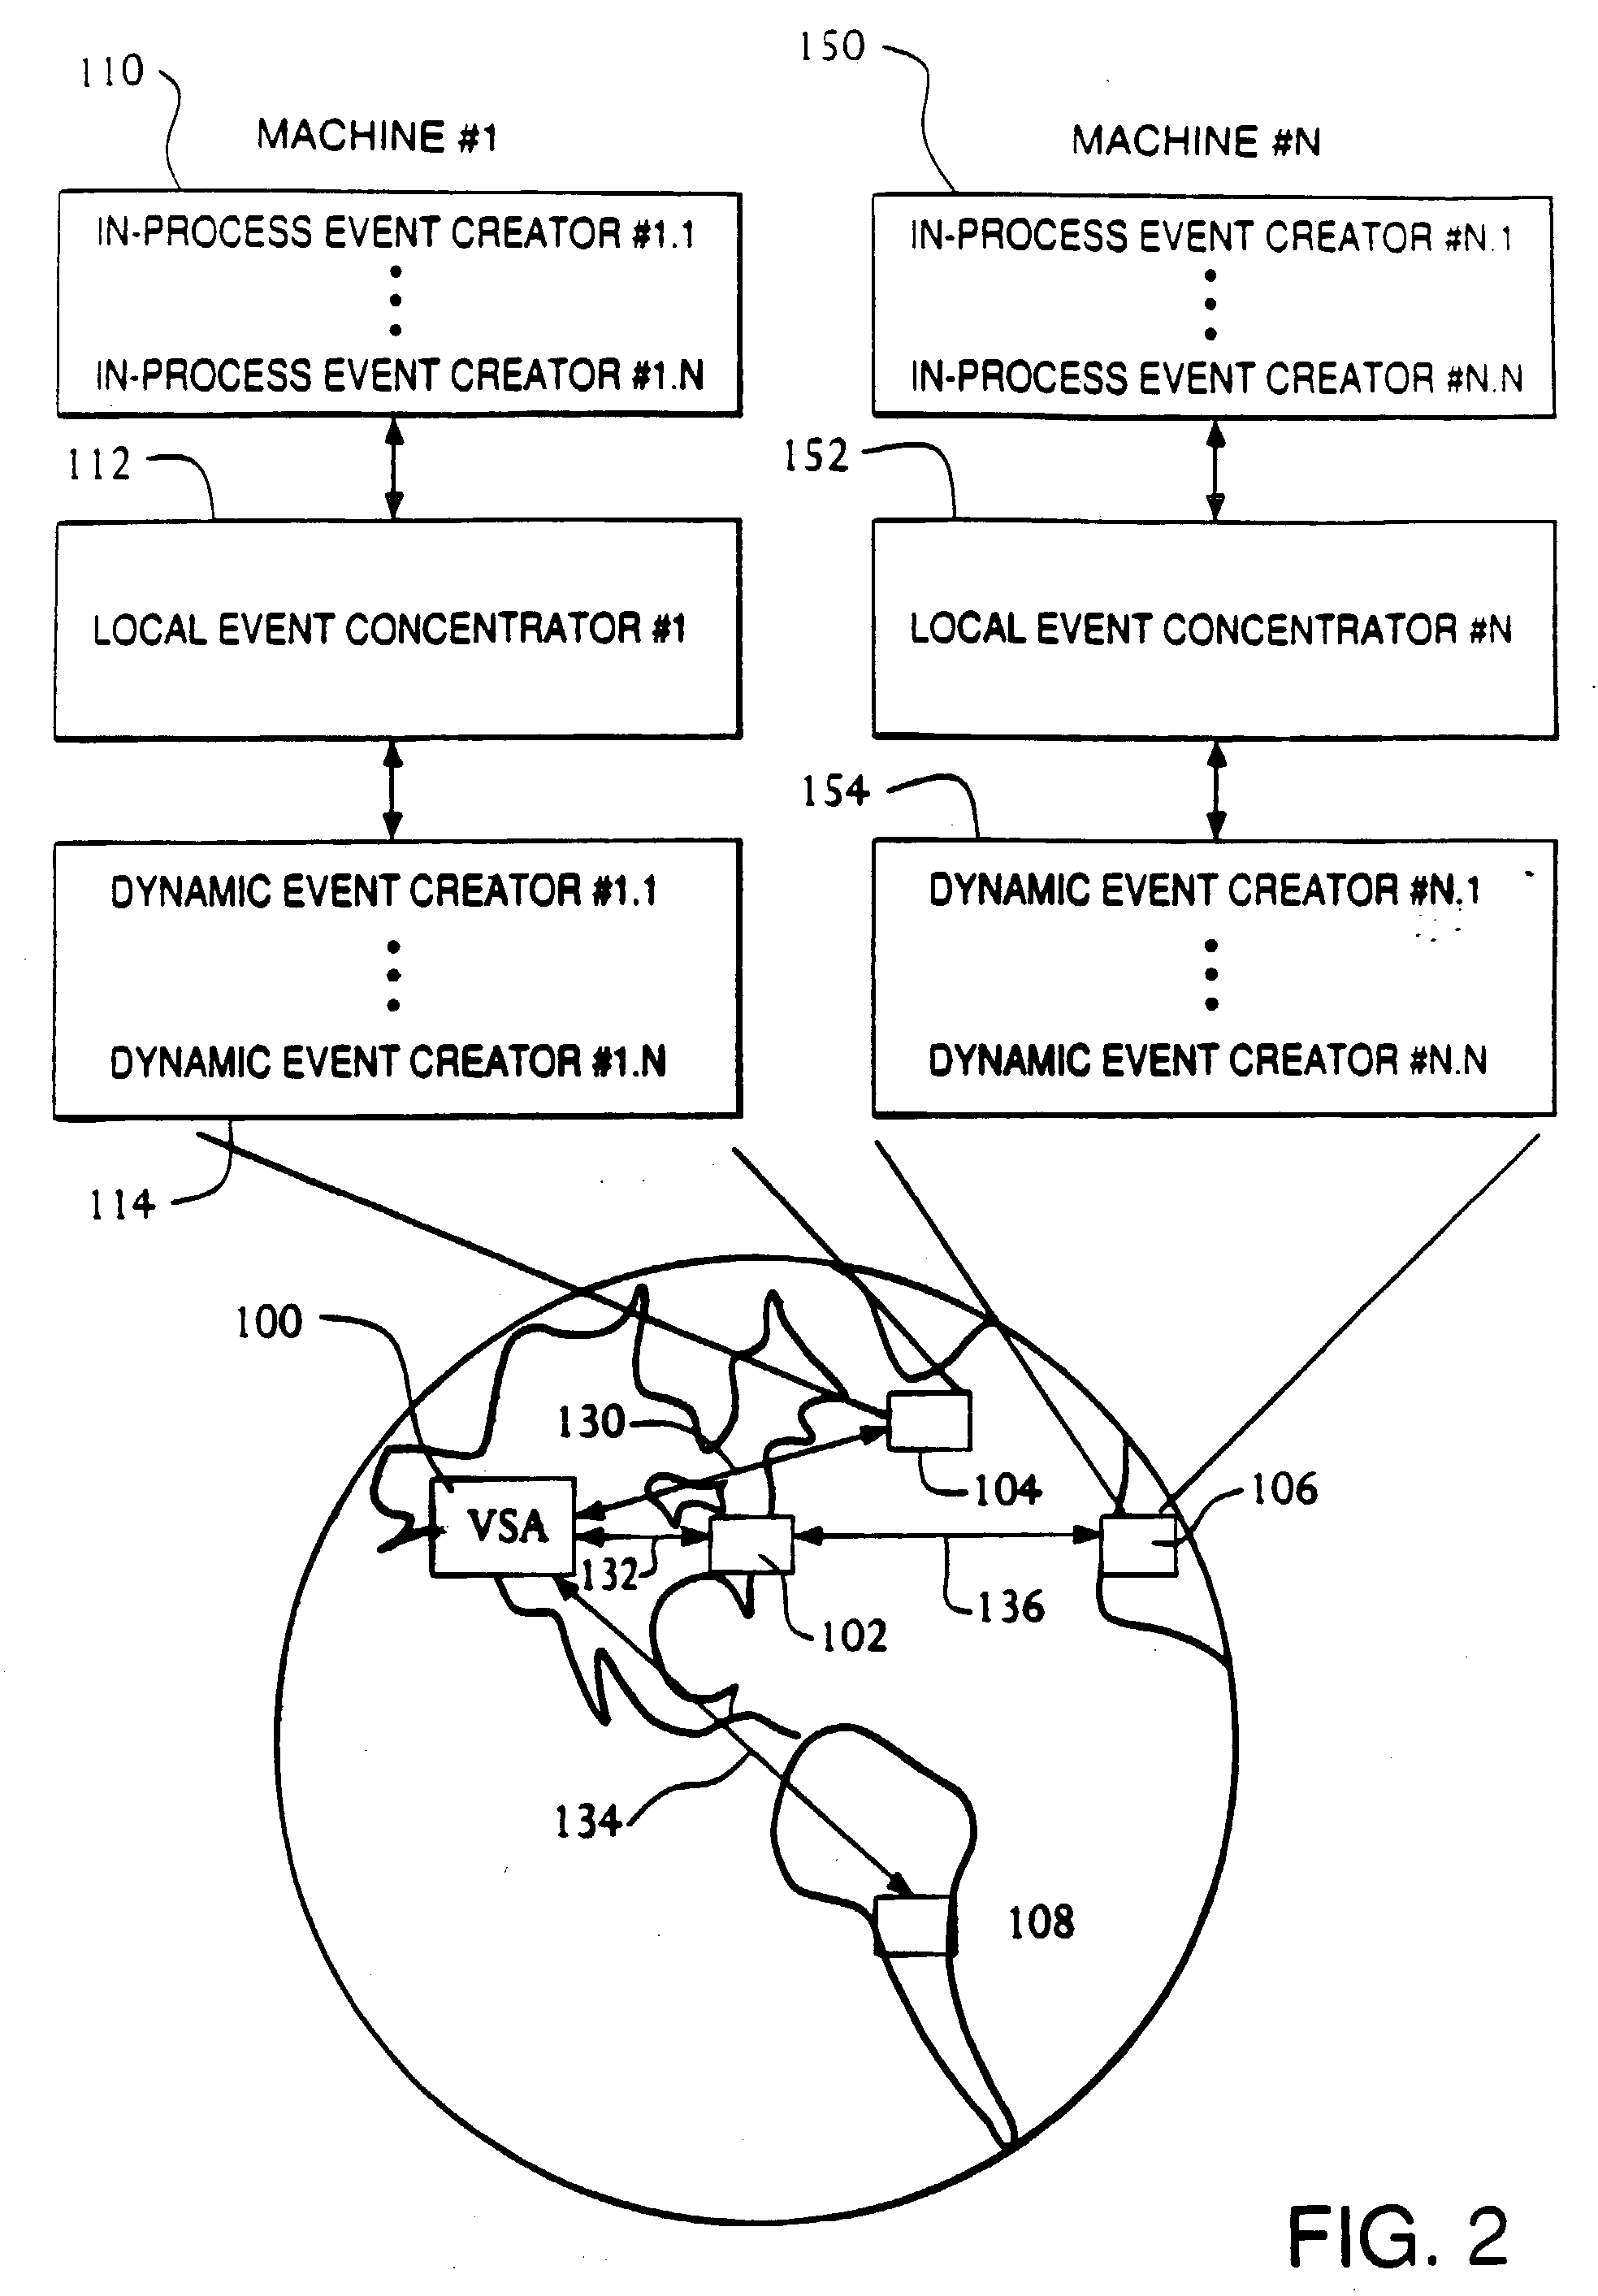
[0111] Data collection begins in the IECs. An IEC is a subroutine that marshals the desired data into a special format and puts it in a shared memory buffer. As mentioned above, IECs reside in the process space of a data source.

[0112] An IEC exports two main functions: IsActive and FireEvent. The IsActive function is used by data sources to determine if any analysis is being performed against a particular data source. When a piece of code reaches a point of interest, the IsActive function is called, which returns True or False as to whether or not anyone is interested. If the IsActive status condition is set True for a particular data source, the FireEvent function is used to dispatch an event to the centralized collection system of the requesting user. If IsActive returns False, an entity can reduce any adverse performance impact by not formatting data for FireEvent. The FireEvent function is implemented in both a synchronous and an asynchr...


PUM


Abstract

A method and apparatus for analyzing the performance of a data processing system, particularly a distributed data processing system, provide a system user with tools for analyzing an application running thereon. Information about the flow and performance of the application can be specified, captured, and analyzed, without modifying it or degrading its performance or data security characteristics, even if it is distributed across multiple machines. The user interface permits the system user to filter the performance information, to set triggers which the performance analyzer is able to reduce and / or combine, to observe multiple time-synchronized displays of performance data either in real time or post mortem, and to play and re-play the operation of an automatically generated application model. The invention is implemented in part by providing suitable Application Program Interfaces (APIs) in the operating system of the data processing system.

Description

[0001] This application is a continuation of U.S. patent application Ser. No. 10 / 216,353 filed Aug. 12, 2002, the entire disclosure of which is hereby incorporated by reference in its entirety. U.S. patent application Ser. No. 10 / 216,353 filed Aug. 12, 2002 is a continuation of U.S. patent application Ser. No. 09 / 325,469, filed Jun. 3, 1999, issued as U.S. Pat. No. 6,467,052 on Oct. 12, 2002.[0002] This invention relates generally to data processing and, more particularly, to a method and apparatus for analyzing the performance of a data processing system.COPYRIGHT NOTICE / PERMISSION[0003] A portion of the disclosure of this patent document contains material which is subject to copyright protection. The copyright owner has no objection to the facsimile reproduction by anyone of the patent document or the patent disclosure as it appears in the U.S. Patent and Trademark Office patent file or records, but otherwise reserves all copyright rights whatsoever. The following notice applies t...

Claims


Application Information

Patent Timeline
Patent Type & Authority Applications(United States)
IPC IPC(8): G06F11/32G06F11/34
CPCG06F11/302G06F11/3072G06F11/3096G06F2201/86G06F11/3466G06F11/348G06F11/3495G06F11/323
Inventor KALER, CHRISTOPHER G.LOVELL, MARTYN S.WAHBE, ROBERT S.FERGUSON, WILLIAM J.SHARP, OLIVER J.
Owner ZHIGU HLDG
Why Eureka
Try Eureka