Method and visual user interface for interactive visual analysis of business expenditure

a visual analysis and visual analysis technology, applied in the field of viewing and analysis of business procurement information, can solve the problems of not always being as effective in conventional corporate procurement practices, relying heavily on human skills, and not saving much tim

Inactive Publication Date: 2003-10-02
IBM CORP
View PDF7 Cites 114 Cited by
  • Summary
  • Abstract
  • Description
  • Claims
  • Application Information

AI Technical Summary

Problems solved by technology

Despite its significance, conventional practices of corporate procurement are not always as effective as they need to be and depend heavily on human skills.
This reality usually stems from the fact that companies do not provide their buyers with information about suppliers that can enlighten decisions about which suppliers to use for which business situations.
However, this technology until now has merely helped reduce paper processing, and does not add much value.
Specifically, this technology merely replaces the phone or facsimile machine, and does not save much time, even though it provides minor benefits such as viewing online product information and allowing to place and track orders "24-7" (e.g., 24 hours-a-day, seven-days-per-week).
It has been pointed out that this technology automating the purchase process without much decision support capability is only suited for "spot-buying" of indirect materials and other non-critical commodities.
However, prior to the present invention, there has been no optimum system and method for analyzing purchase information, let alone a visual user interface for facilitating the analysis of purchase information and providing decision support in procurement.

Method used


Image

  • Method and visual user interface for interactive visual analysis of business expenditure
  • Method and visual user interface for interactive visual analysis of business expenditure
  • Method and visual user interface for interactive visual analysis of business expenditure

Examples


Embodiment Construction

[0055] Referring now to the drawings, and more particularly to FIGS. 1-14, there are shown preferred embodiments of the method and structures according to the present invention.

[0056] Preferred Embodiment

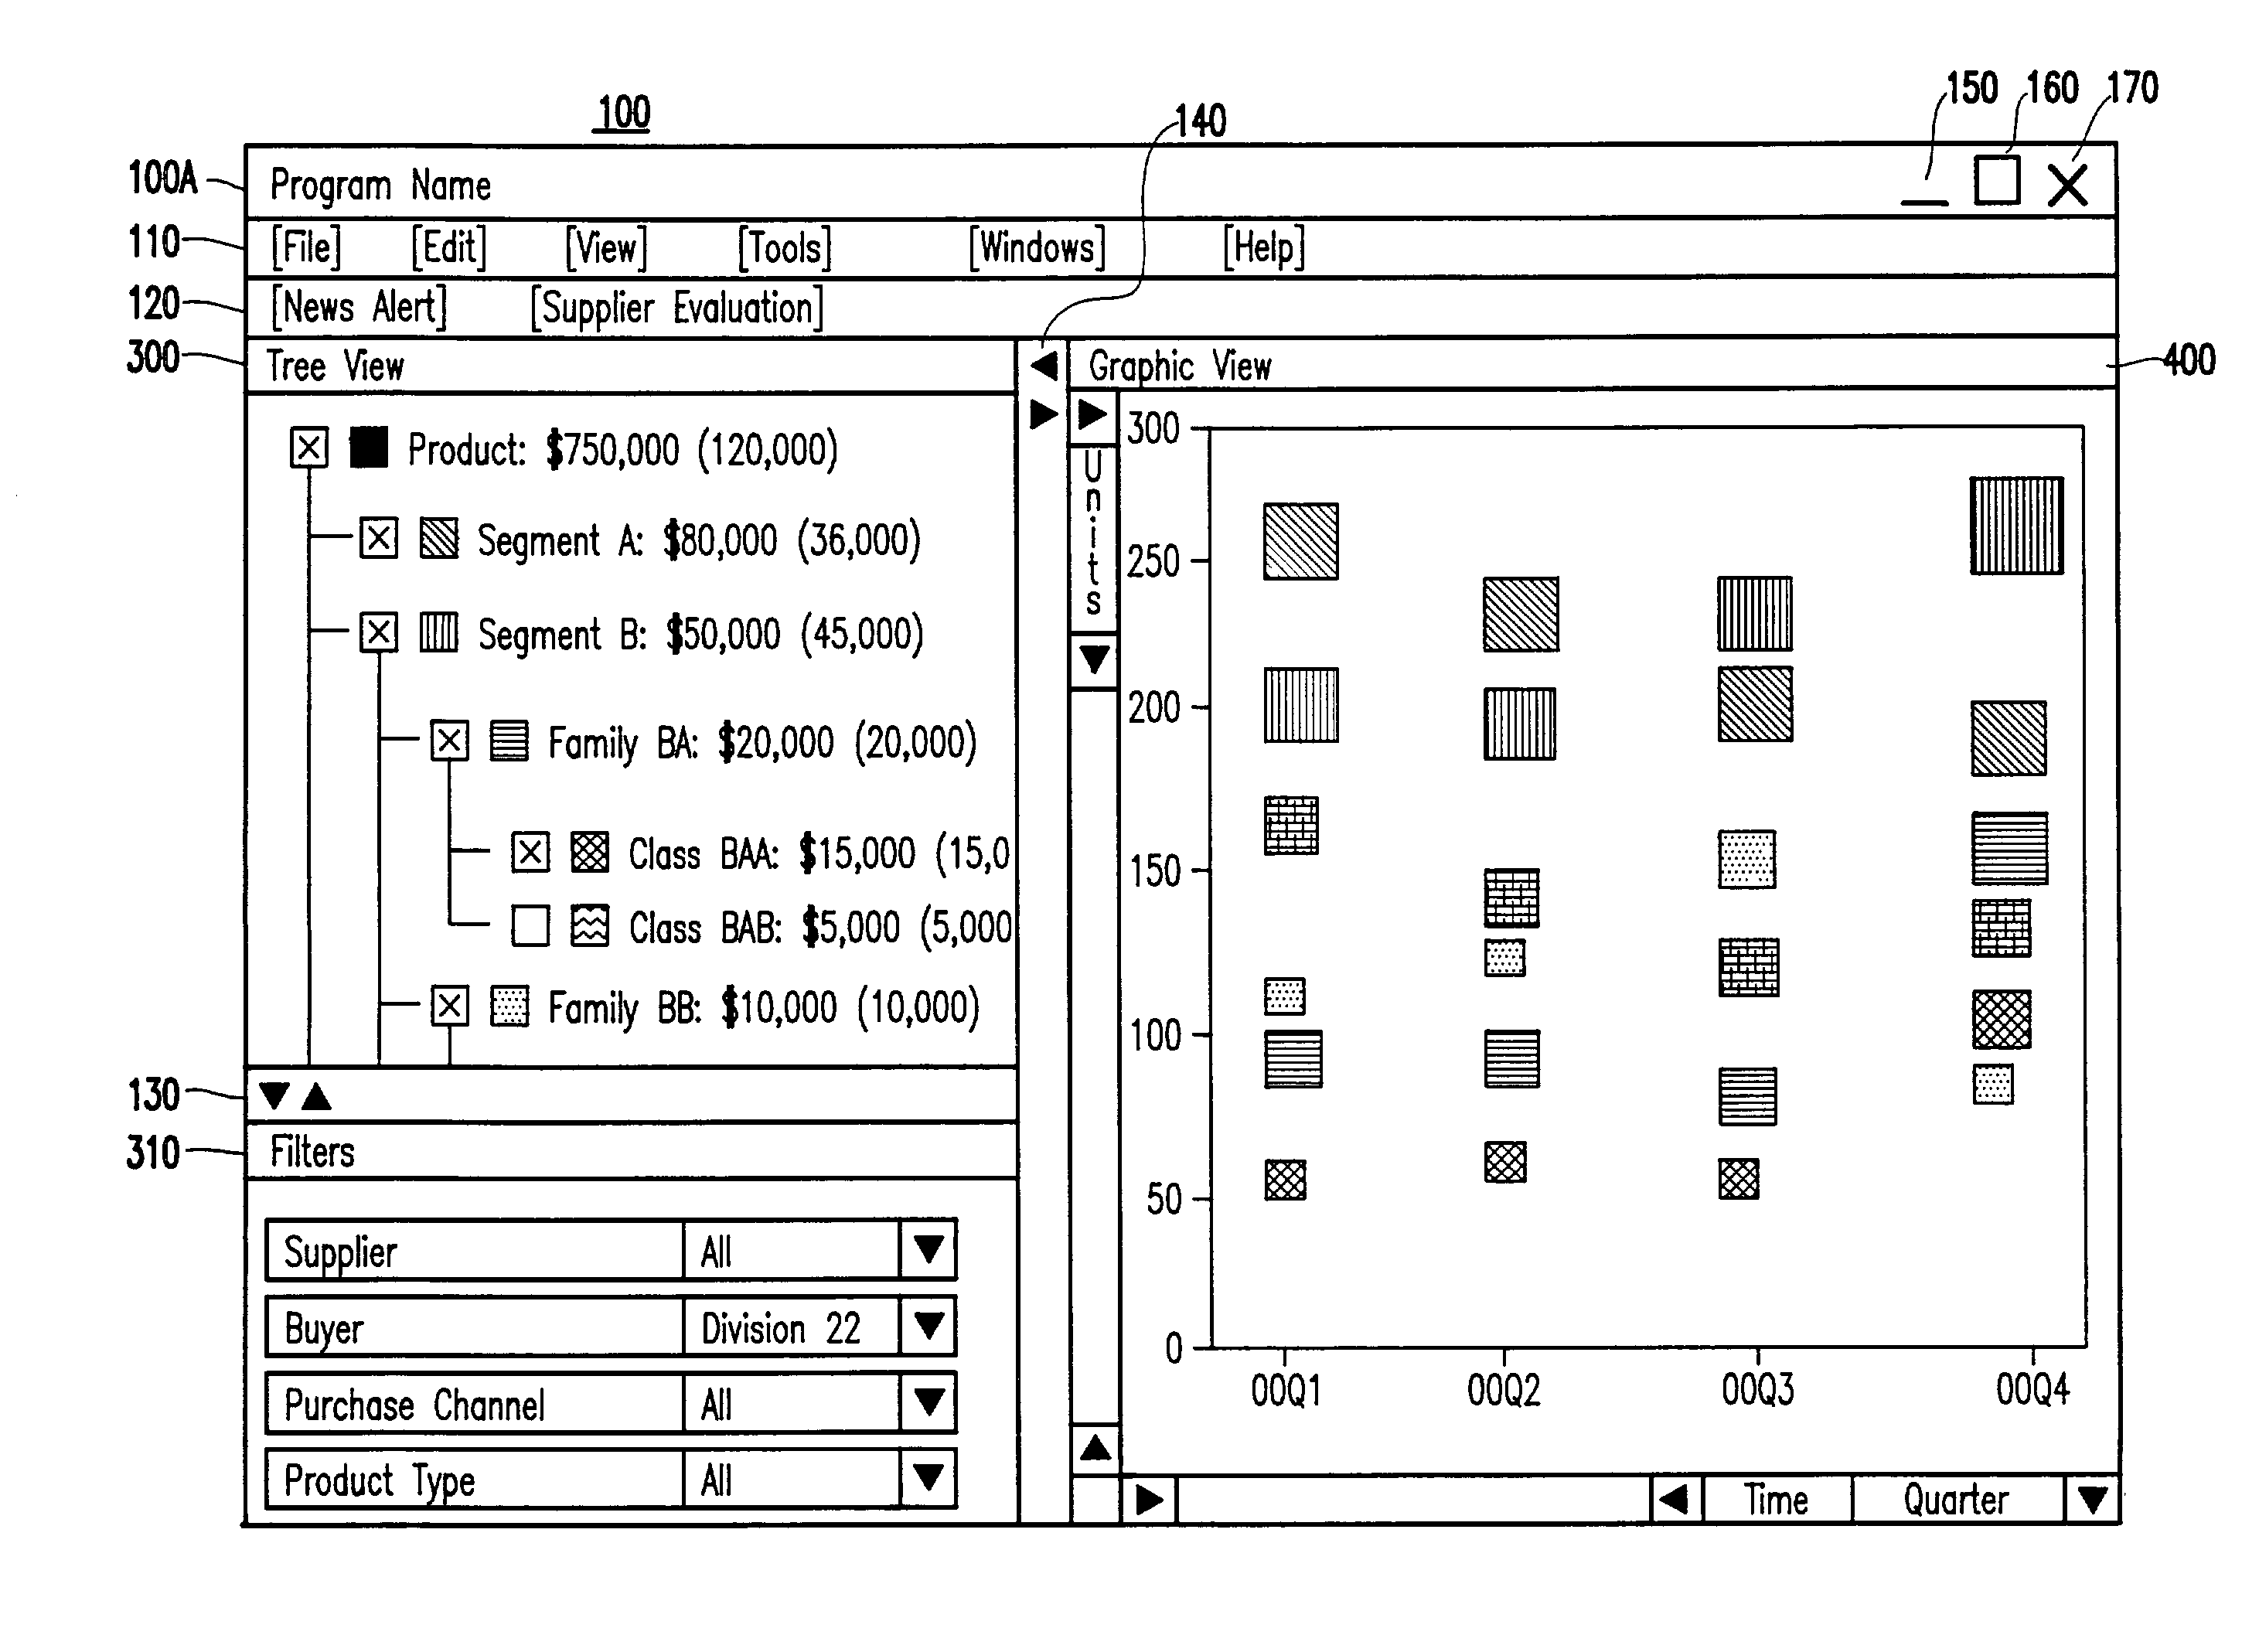
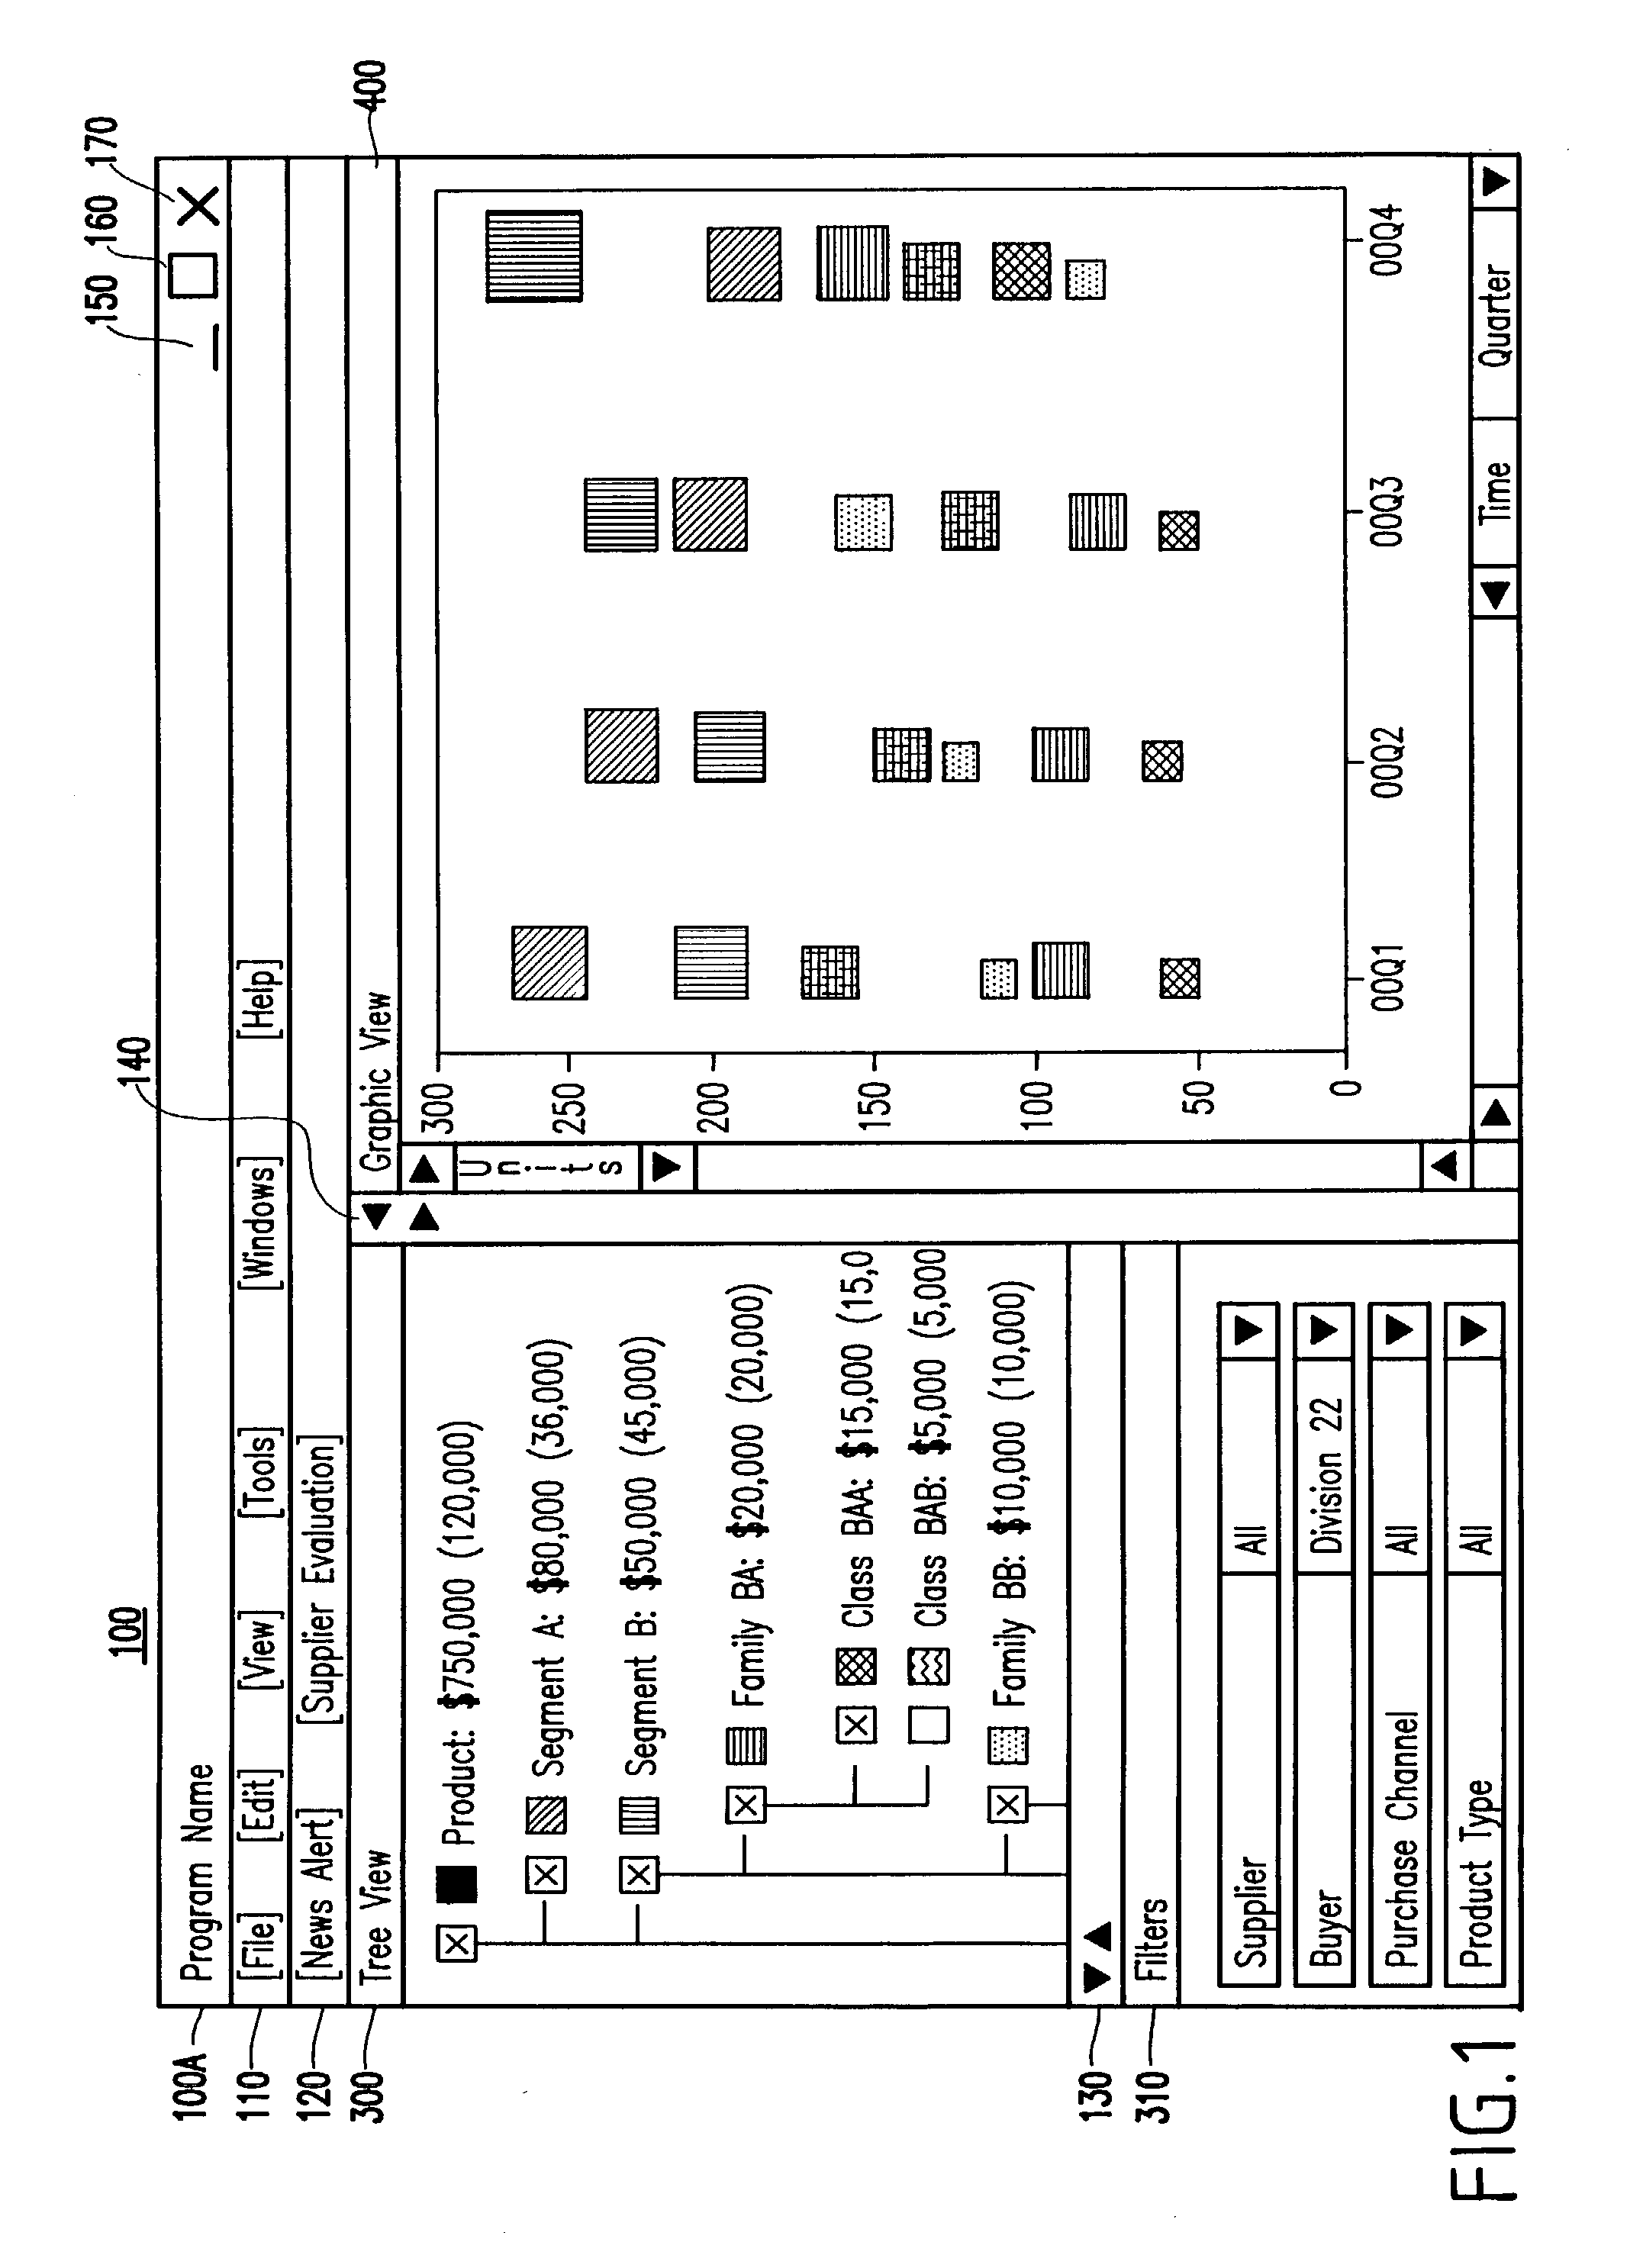
[0057] FIG. 1 illustrates a graphical user interface 100 for multi-dimensional analysis of enterprise procurement of the present invention.

[0058] The graphical user interface 100 can be implemented in a desktop software program that can run as a stand-alone application on the user's computer, and / or in a Web application that can run from a Web browser program. Regardless of the execution platform, the system can take the conceptually same graphical user interface 100 for facilitating the analysis of business expenditure from many different perspectives.

[0059] The graphical user interface includes several components including a Tree View 300, a Filter View 310, and a Graphic View 400, which will be described in detail later.

[0060] The Tree View 300 is a hierarchical presentation of t...


PUM


Abstract

A method (and system) of providing an interactive visual analysis of business expenditure, includes using an interactive graphical view to gain insight into purchase information for assisting in understanding purchase activities and making decisions on purchasing.

Description

[0001] The present application is related to U.S. patent application Ser. No. 10 / ______,______, concurrently filed on ______, to Juhnyoung Lee, entitled "METHOD AND VISUAL USER INTERFACE FOR EVALUATING AND SELECTING SUPPLIERS FOR ENTERPRISE PROCUREMENT" having IBM Docket No. YOR920010672US1, assigned to the present assignee, and incorporated herein by reference.[0002] 1. Field of the Invention[0003] The present invention generally relates to viewing and analysis of business procurement information and, more particularly, to a method and system for analyzing purchase information and a visual user interface for facilitating the analysis of purchase information and providing decision support in procurement.[0004] 2. Description of the Related Art[0005] Procurement is an essential part of any business. Reportedly, businesses spend 60% or more of revenue on external purchases of goods and services. For example, a company with its revenue of $1B spends $570M for buying goods and services ...

Claims


Application Information

Patent Timeline
Patent Type & Authority Applications(United States)
IPC IPC(8): G06Q10/06G06Q30/02
CPCG06Q10/06315G06Q10/0637G06Q30/0204G06Q30/02G06Q30/0201G06Q10/06375
Inventor LEE, JUHNYOUNG
Owner IBM CORP
Why Eureka
Try Eureka