Methods and systems for determining and controlling glycemic responses

a glycemic response and glycemic technology, applied in the field of glycemic response determining and controlling glycemic response, can solve the problems of life-threatening consequences, glucose remaining in the blood for longer than normal, and errors in the measurement of food components being subtracted

Inactive Publication Date: 2004-03-04
ATKINS NUTRITIONALS +1
View PDF3 Cites 26 Cited by
  • Summary
  • Abstract
  • Description
  • Claims
  • Application Information

AI Technical Summary

Benefits of technology

0075] FIG. 13 shows blood glucose response curves for Atkins' Advantage Mocha bar, and white bread at glycemic carbohydrate loads of zero, five, ten and twenty grams.
0076] FIG. 14 shows blood glucose response curves for Atkins' Advantage Frosted Cinnamon Swirl bar, and white bread at glycemic carbohydrate loads of zero, five, ten and twenty grams.

Problems solved by technology

For example, errors in the measurement of the food components being subtracted carry over into the determination of carbohydrate content.
Without sufficient insulin, or without the ability of the insulin to move glucose into the cells, the consumption of glycemic carbohydrates, and subsequent absorption of glucose, results in glucose remaining in the blood for longer than normal.
Such sensitivity can result in life threatening consequences.
However, too much insulin causes hypoglycemia which can result in insulin shock.
The long term effects of diabetes also may result in severe consequences.
For example, recent studies have shown that even transiently high blood glucose levels can lead to disease.
AGEs may destroy normal protein structure, inhibit protein physiological function and cause damage that leads to irreversible disease conditions in vital organs.
The GI system is not easily applied by an average individual to his daily diet for several reasons.
Thus, an individual may be misled to believe that an average serving size of carrots produces a greater rise in blood glucose levels than a quarter cup of sugar.
Moreover, the determination of GI presents researchers with several difficulties.
However, as discussed above, due to the different ways in which carbohydrate content of food is measured, such information is not uniform.
The variation in the GI values of similar foods reported by researchers reflects this lack of uniformity.
However, the addition of this step is cumbersome.
That is, actual physiological conditions of the human body which may affect such responses may not fully be taken into account.
That is, nutritional art and technology have not determined the actual functional relationship between glycemic response and carbohydrate portions which are less than twenty-five grams.

Method used


Image

  • Methods and systems for determining and controlling glycemic responses
  • Methods and systems for determining and controlling glycemic responses
  • Methods and systems for determining and controlling glycemic responses

Examples


example 1

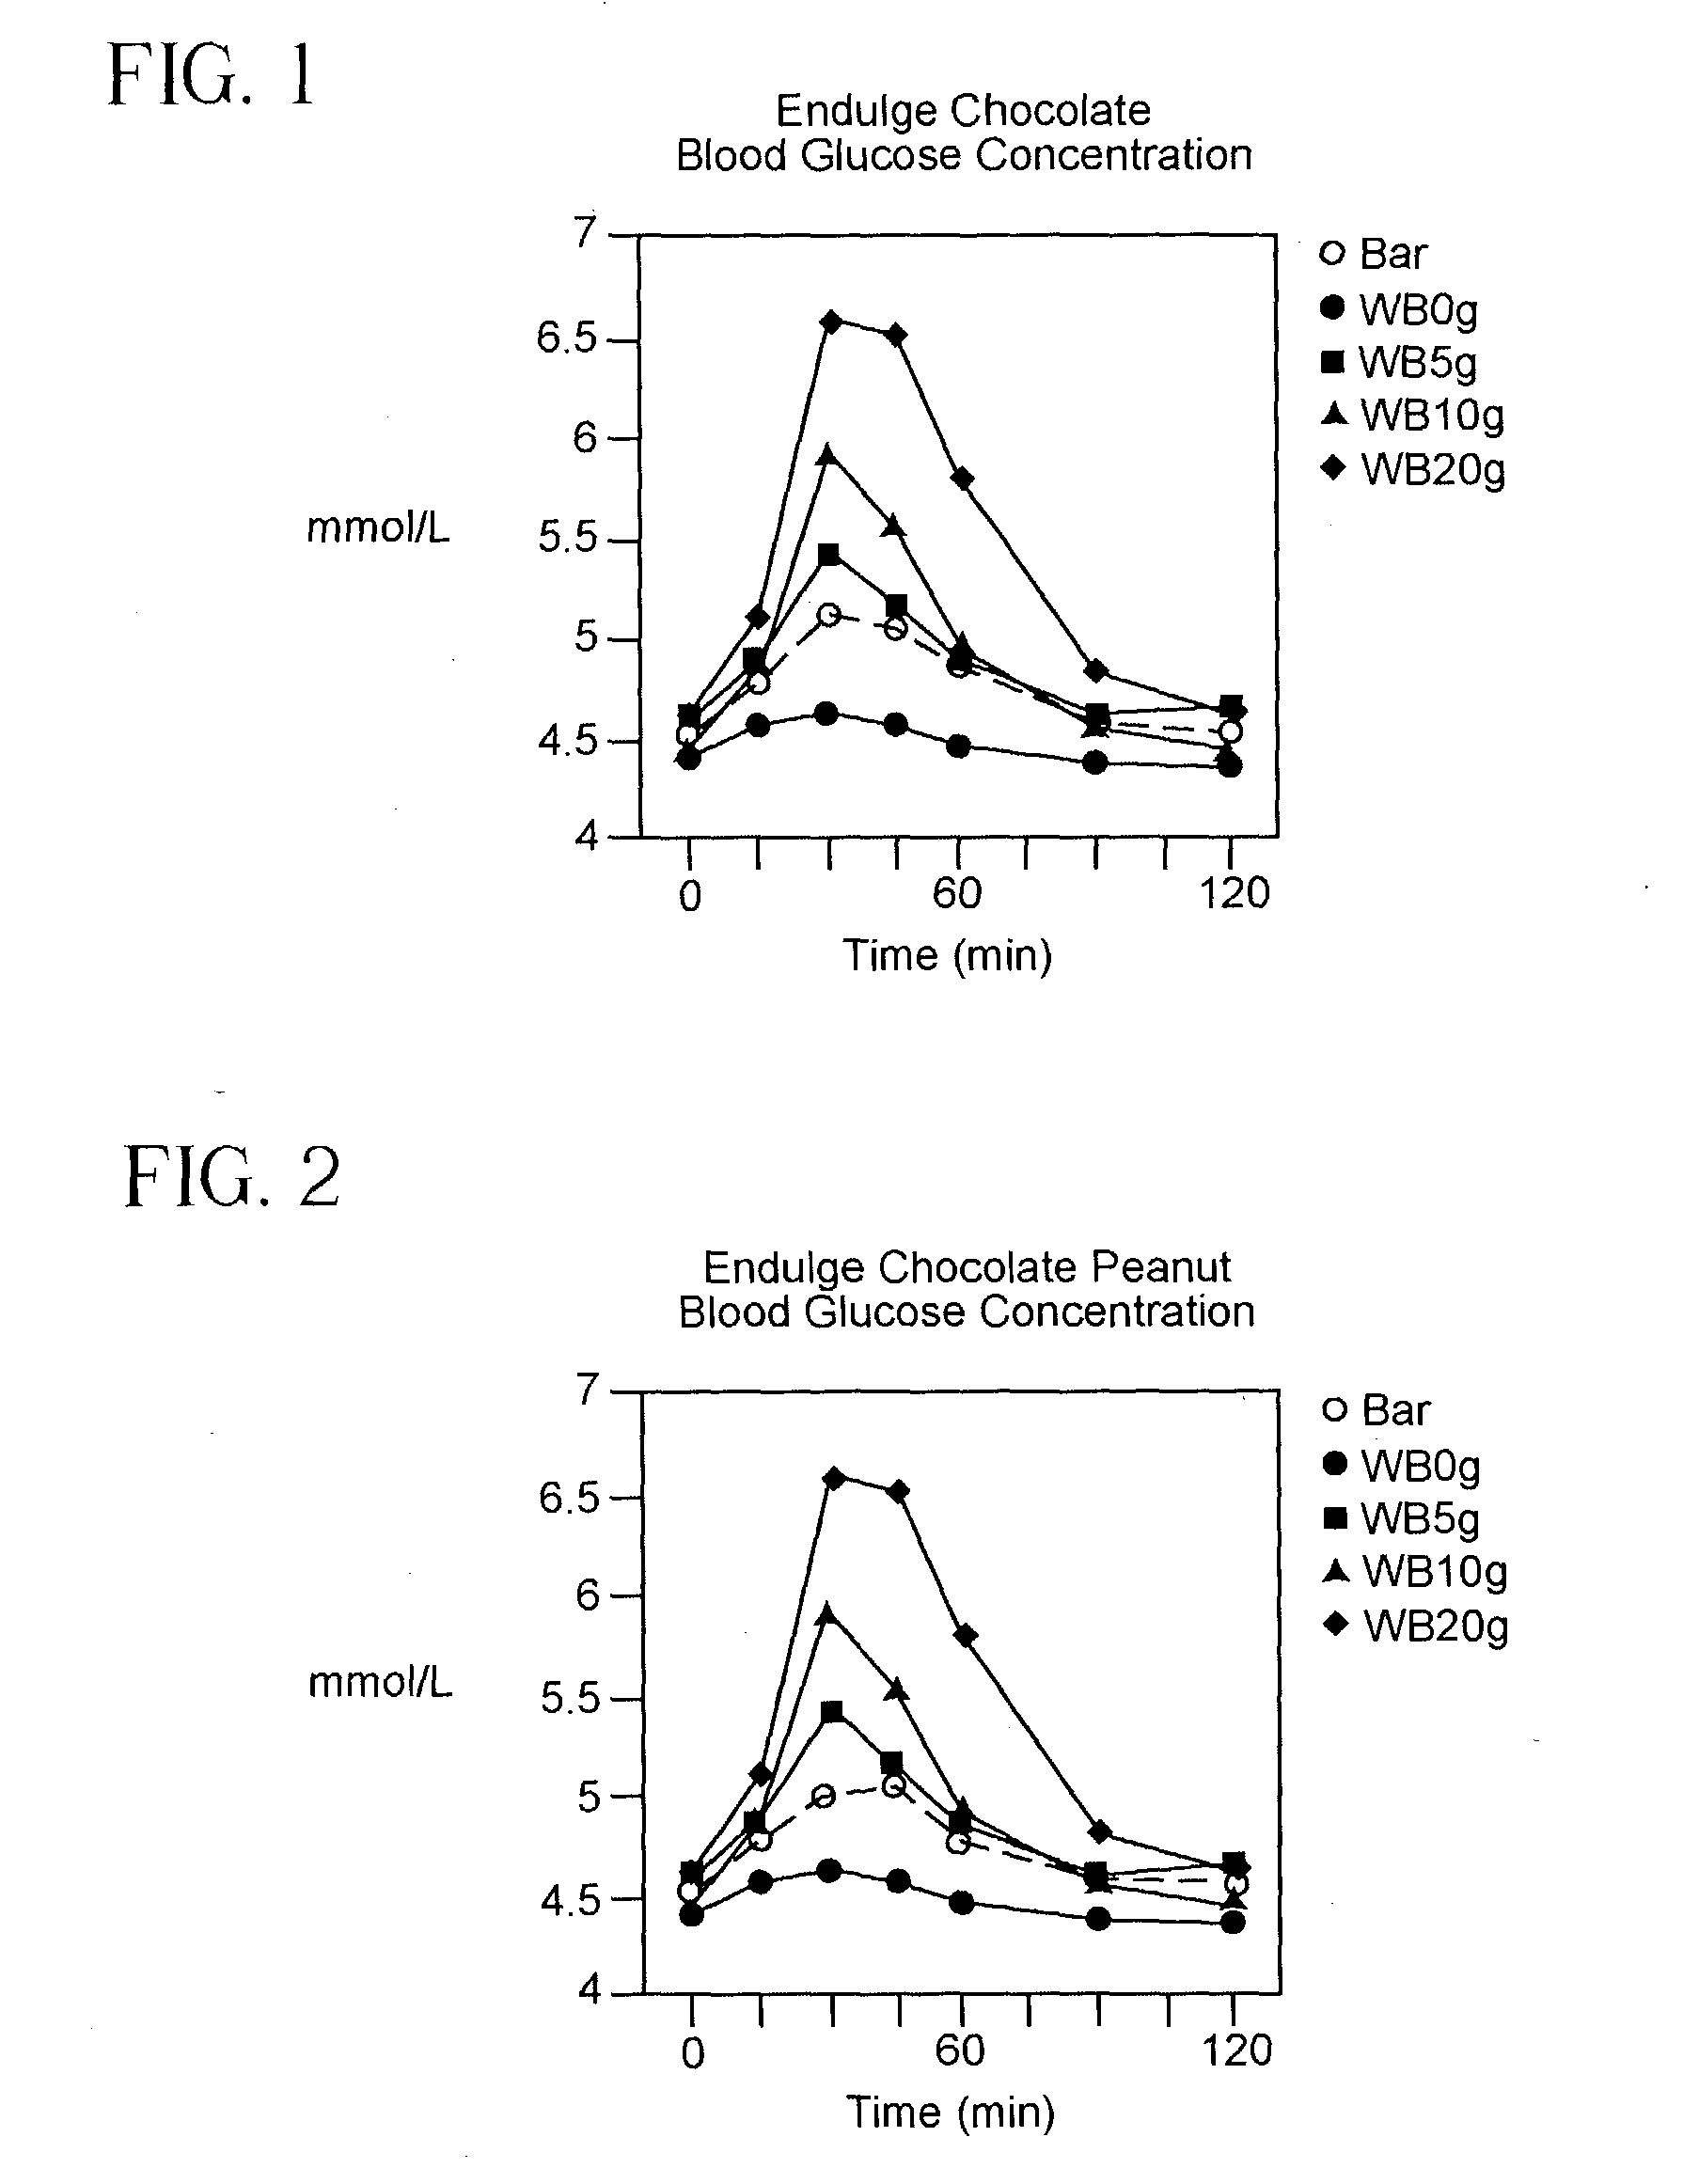
[0173] The glycemic responses of 1 serving (1 bar=30 g) of Atkins' Endulge Chocolate, Endulge Chocolate Peanut and Endulge Chocolate Crunch bars were determined in 10 healthy subjects (4 male, 6 female; 39.+-.5 years of age; body mass index 23.4=0.9 kg / m 2), relative to the response from white bread. Each subject was studied on 7 occasions in the morning after 10-14 h overnight fasts. On each occasion, each subject consumed a test meal. One of the test meals consisted of a standard drink alone. The standard drink did not contain glycemic carbohydrate. Three of the test meals consisted of one type of bar and the standard drink. Three of the test meals consisted of white bread containing a particular amount of glycemic carbohydrate, i.e. 5 g, 10 g or 20 g; and the standard drink. The glycemic responses of each subject were determined after each test meal.

[0174] The dose response curve for bread allowed calculation in each subject of the extent to which 1 g glycemic carbohydrate from b...

example 2

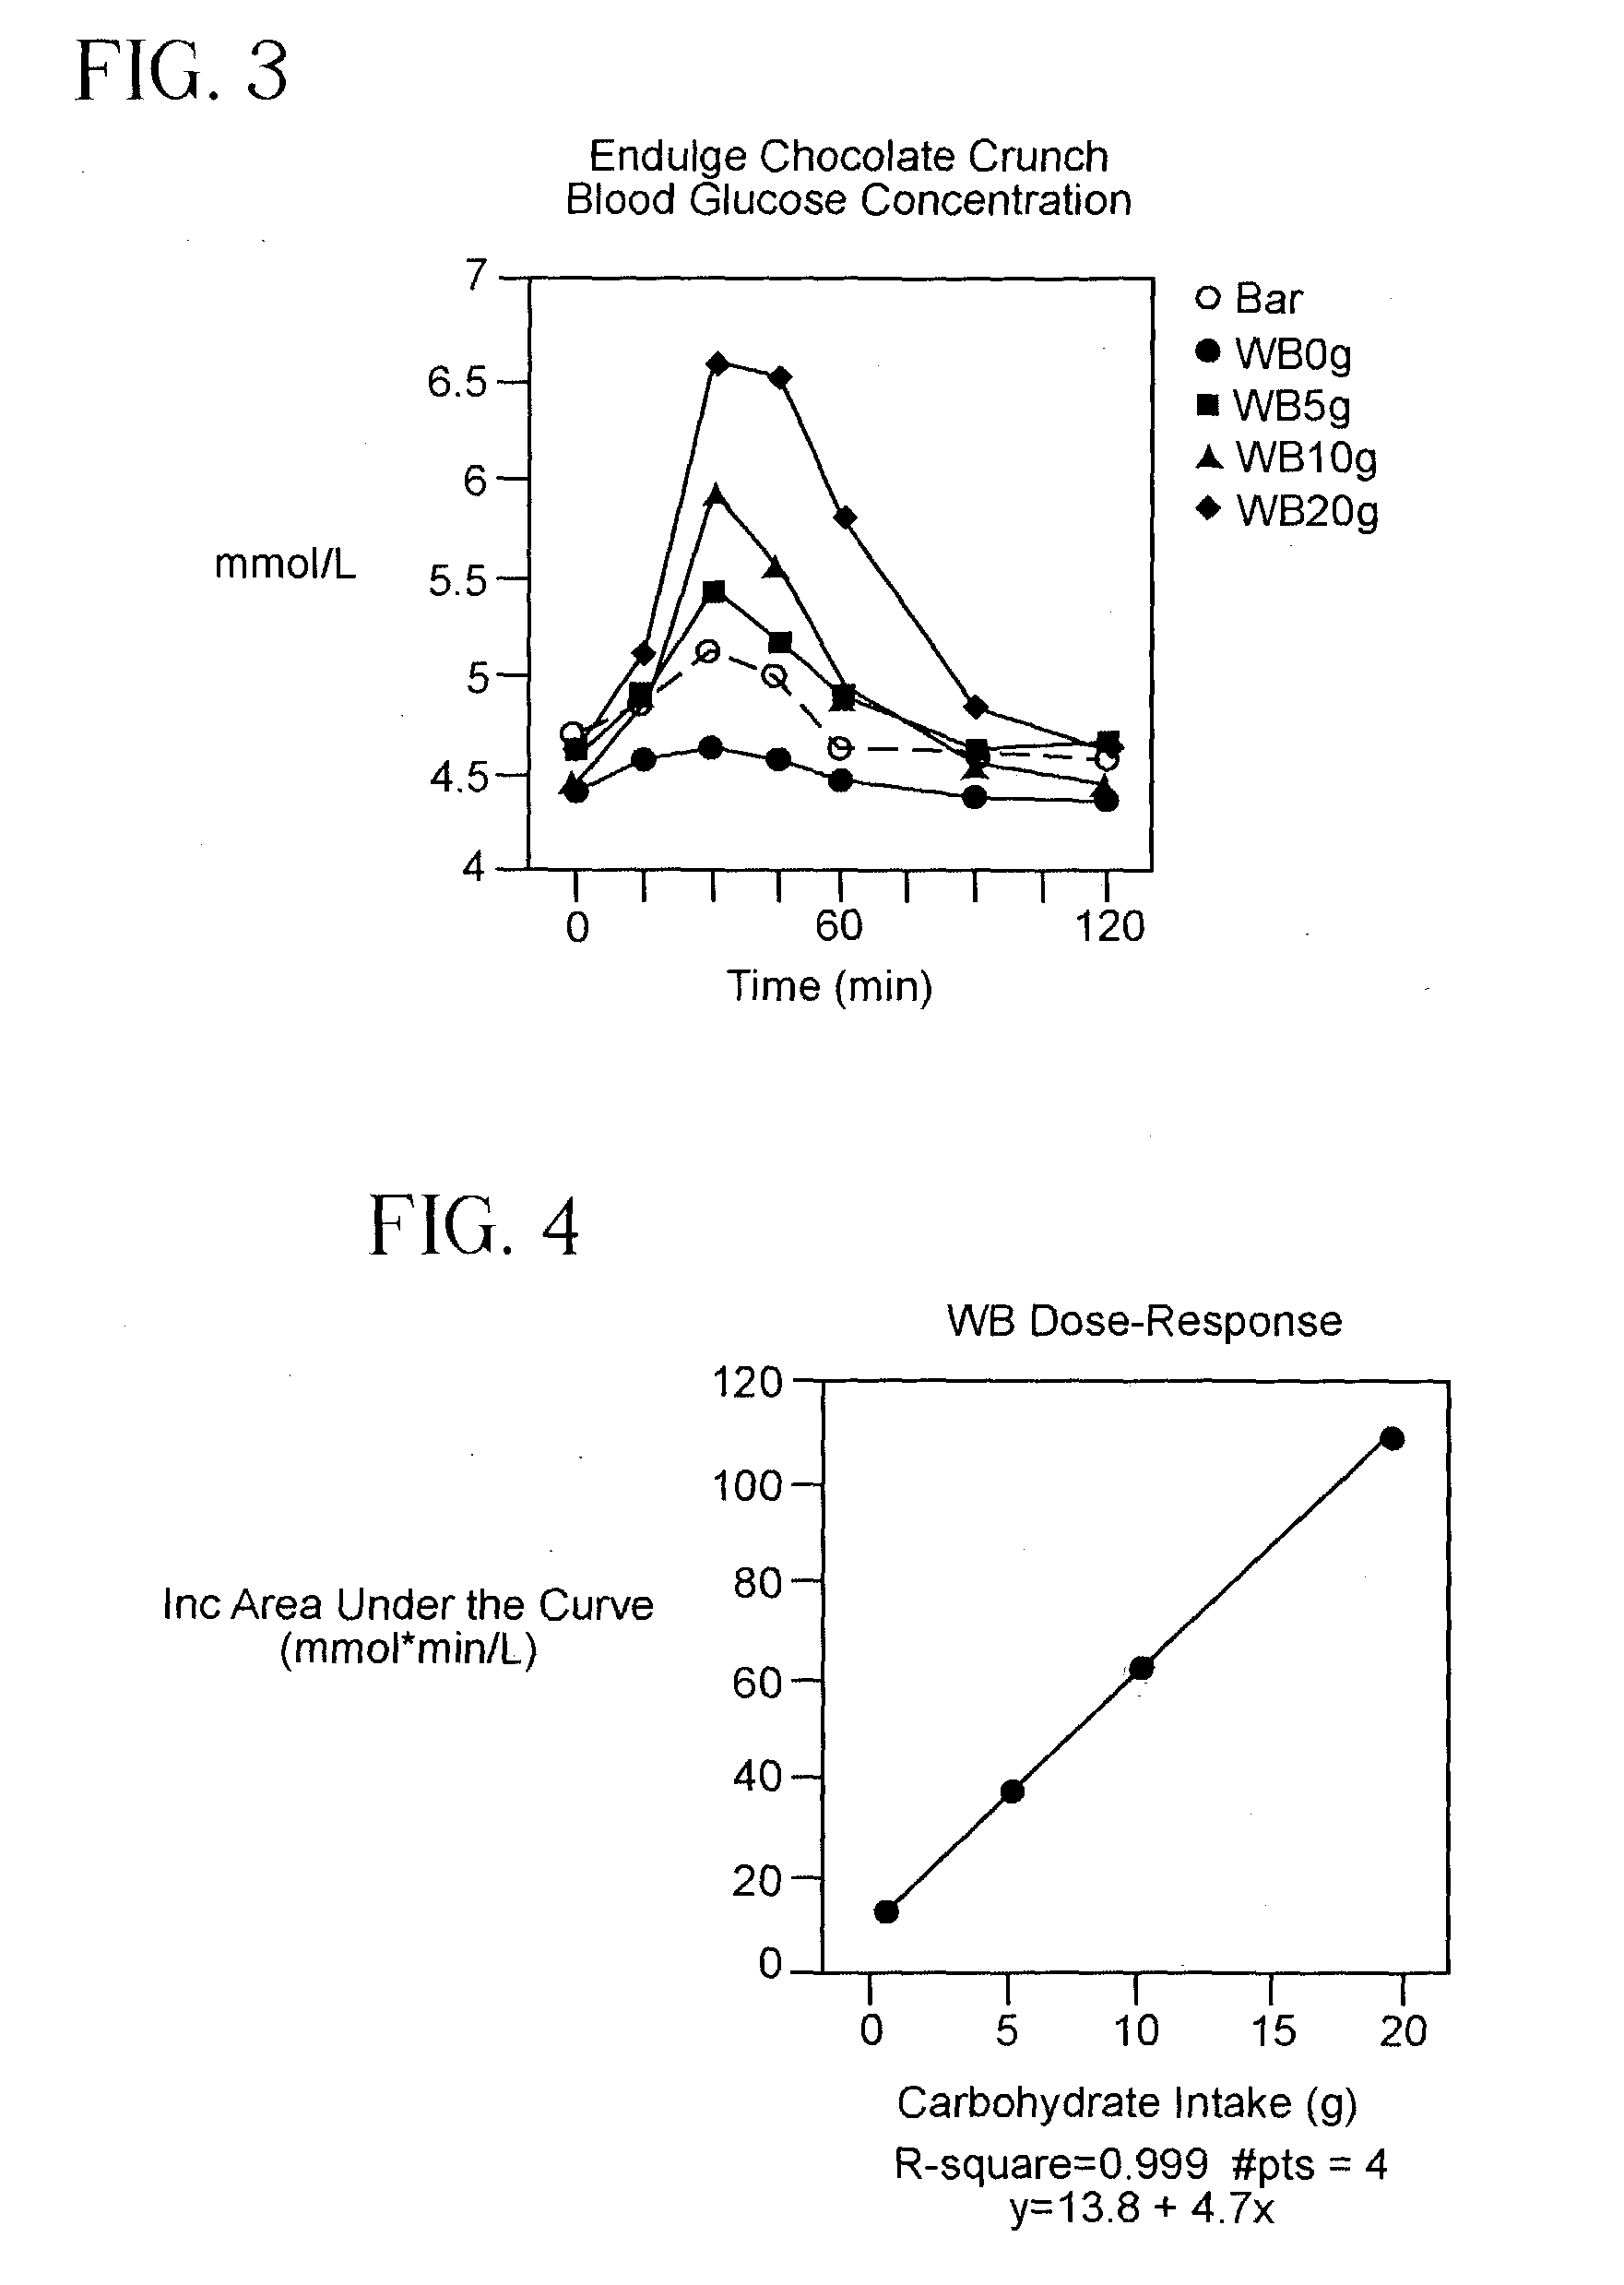
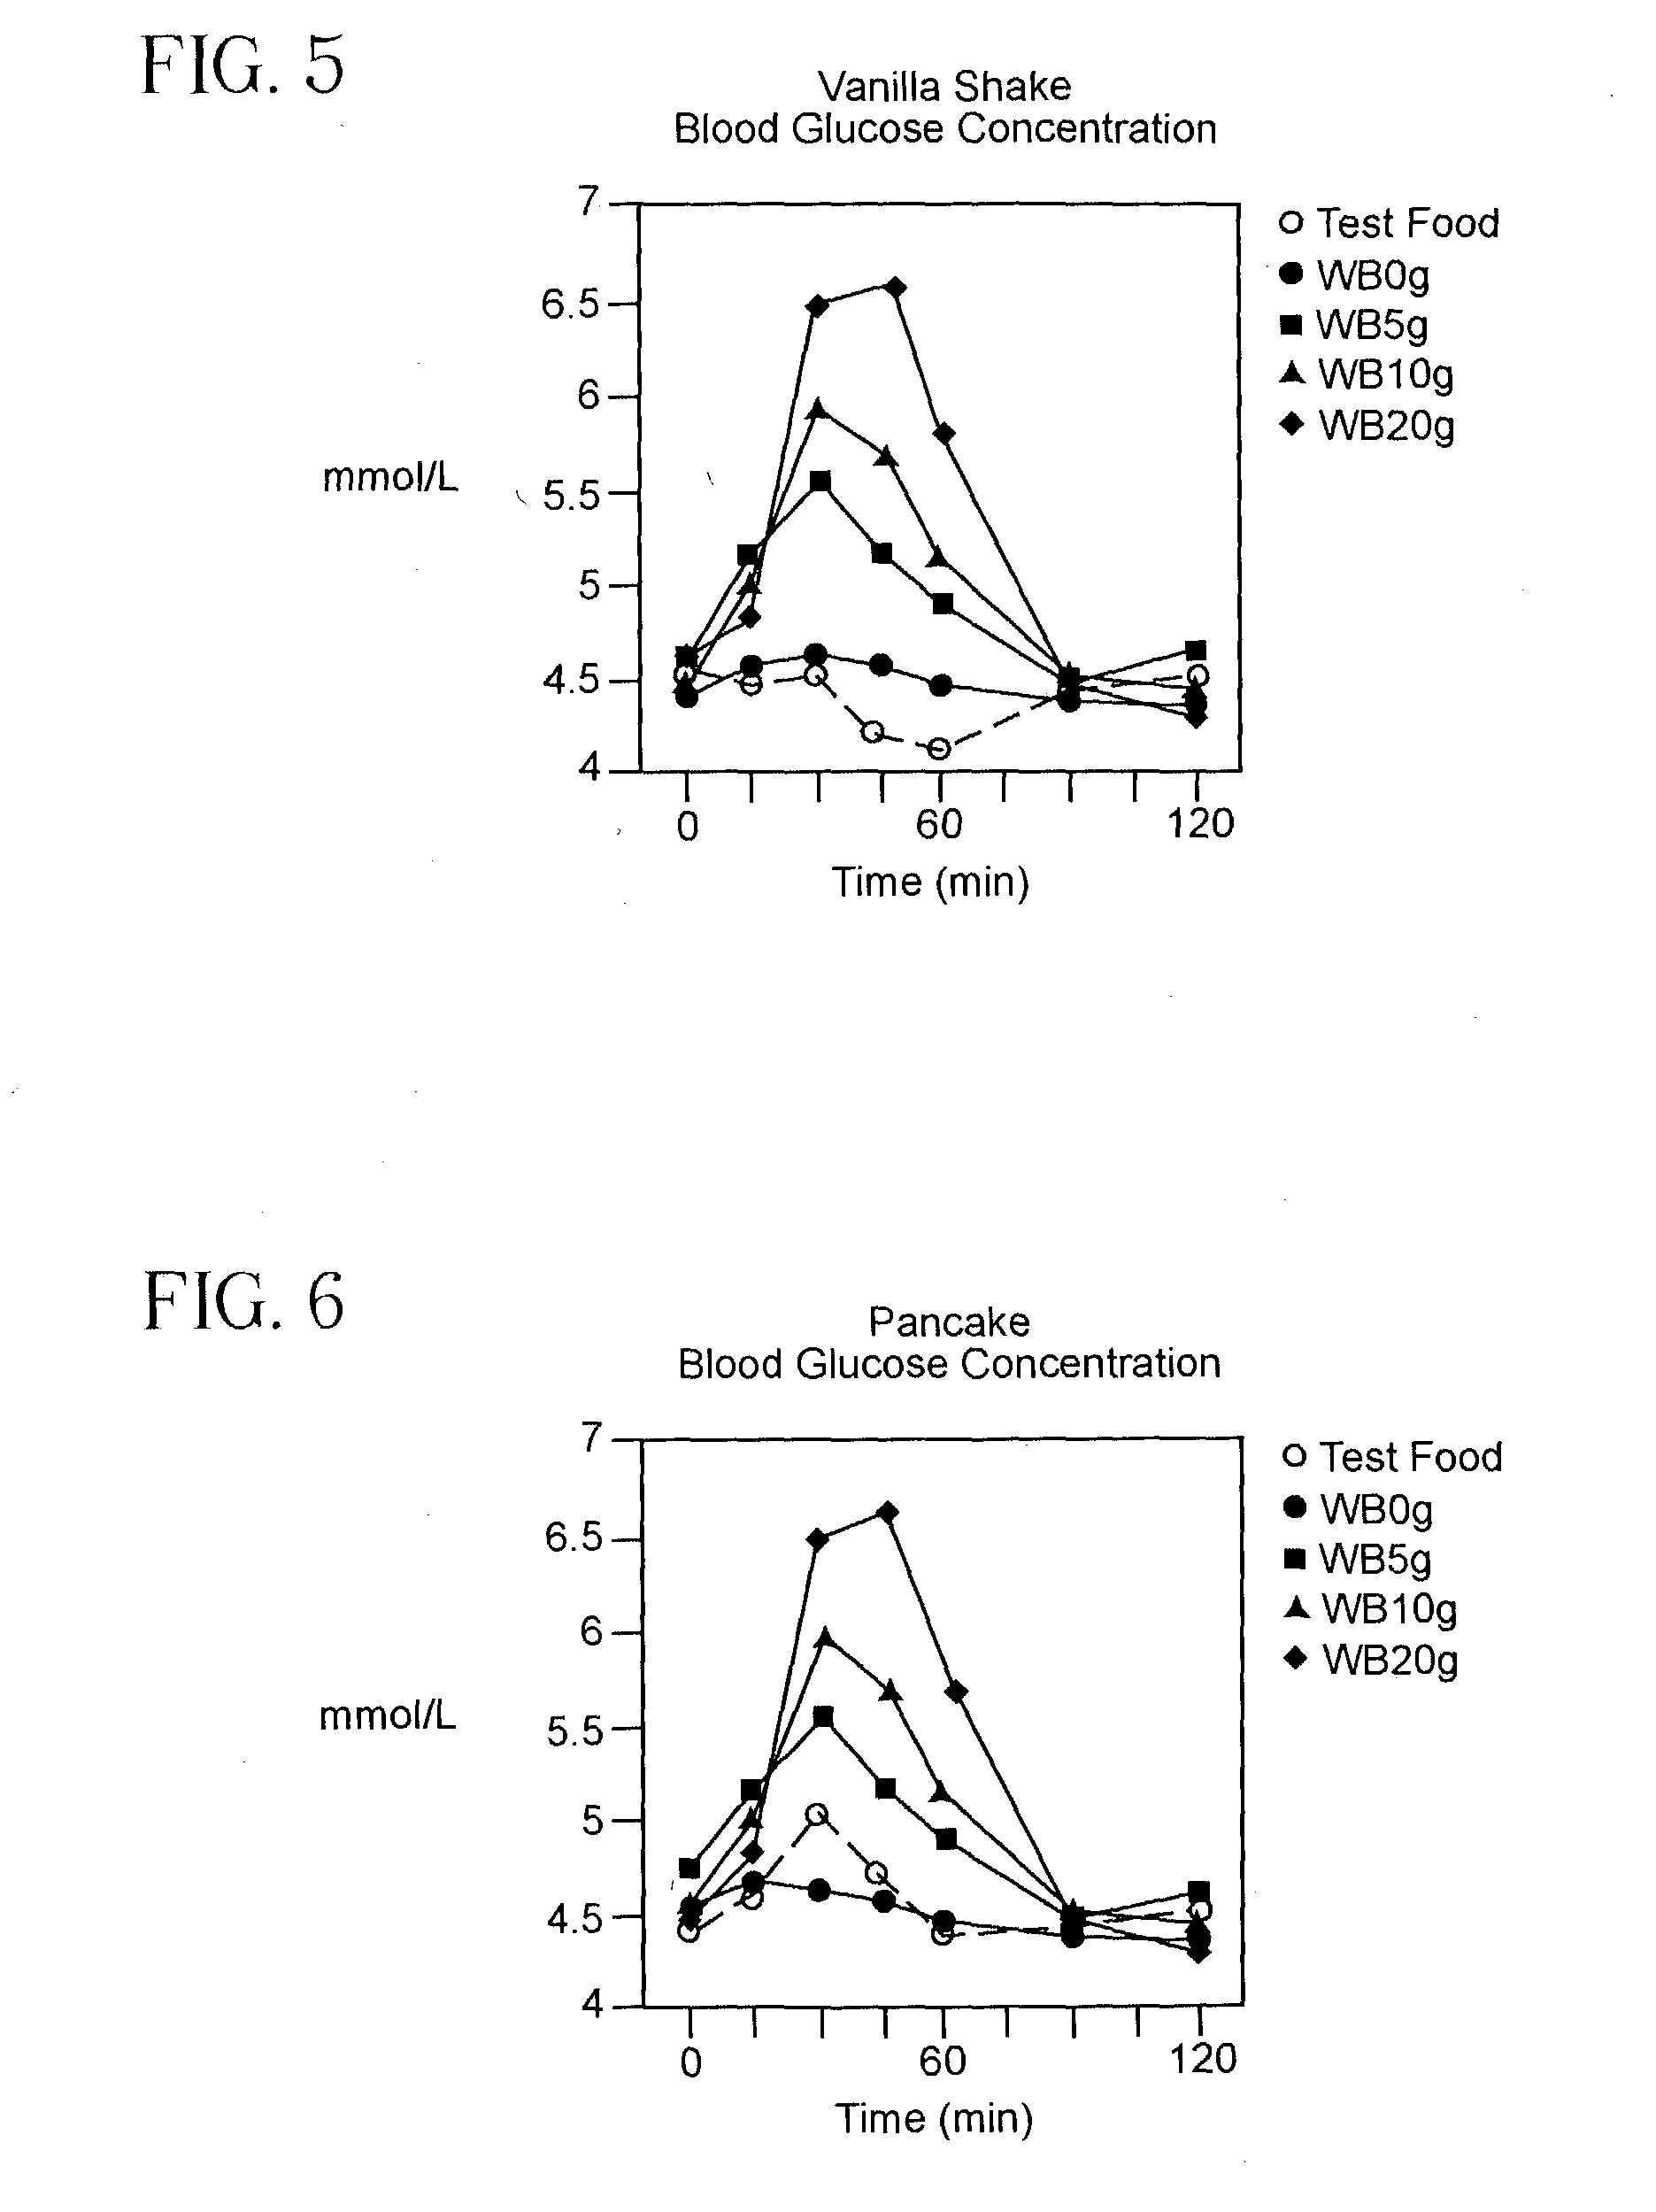
[0202] The glycemic responses of 1 serving (1 bar=30 g) of Endulge Chocolate Almond Bar, 1 serving (1 325 ml can) of Vanilla Shake, 1 slice (28 g) of Atkins' White Bread, 1 slice (28 g) Atkins' Rye Bread, 1 serving of Quick & Easy Pancakes and 1 serving of Quick & Easy Blueberry Muffins were determined in 10 healthy subjects (4 male, 6 female; 36.+-.6 years of age; body mass index 22.8+0.8 kg / m.sup.2), relative to the response from white bread. Each subject was studied in the morning after 10-14 h overnight fasts. In addition to a standard drink plus the 6 test products, the glycemic response of each subject was determined after the standard drink alone and the drink plus 5, 10 and 20 g glycemic carbohydrate portions of white bread. The incremental area under the glycemic response curve (IAUC) increased in a linear fashion as the amount of carbohydrate consumed from bread increased from 0 to 20 g, with the correlation coefficient (R) being >0.95 in 6 of the 10 subjects. The regressi...

example 3

[0228] The glycemic responses of 1 serving (1 bar=60 g) of Advantage Mocha Bar, Advantage Frosted Cinnamon Swirl Bar, and Advantage Almond Brownie bar and 1 serving (1 325 ml can) of Chocolate Delight Shake were determined in 10 healthy subjects (4 male, 6 female; 36.+-.6 years of age; body mass index 22.8.+-.0.8 kg / m.sup.2), relative to the response from white bread. Each subject was studied on 8 occasions in the morning after 10-14 h overnight fasts. In addition to a standard drink plus the 4 test products, the glycemic response of each subject was determined after the standard drink alone and the drink plus 5, 10 and 20 g glycemic carbohydrate portions of white bread. The incremental area under the glycemic response curve (IAUC) increased in a linear fashion as the amount of carbohydrate consumed from bread increased from 0 to 20 g, with the correlation coefficient (R) being >0.95 in 6 of the 10 subjects. The regression equation of mean IAUC on dose of carbohydrate (d) was:

IAUC=4...


PUM


Abstract

The present invention provides a method of determining a standard comestible Equivalent Glycemic Load of a dietary comestible comprising: (a) establishing a reliable glycemic response index for a standard comestible, wherein the index correlates glycemic response with glycemic load; (b) determining the glycemic response produced by a dietary comestible, and (c) identifying the standard comestible glycemic load from the index which is correlated with the glycemic response of the dietary comestible.

Description

[0001] The present invention relates to methods for establishing the Equivalent Glycemic Load of food products, and systems for selecting food products by consumers for the management of their intake of foods that elicit glycemic responses, primarily from digestible carbohydrates.[0002] Carbohydrates can be defined in three ways; structurally (based on molecular structure), analytically (such as, for example, as defined by Federal labeling regulations), and physiologically (based on glycemic impact).[0003] Carbohydrates defined structurally include compounds composed of at least one basic monosaccharide unit. Under this definition, carbohydrates may be further classified as simple carbohydrates and complex carbohydrates. Simple carbohydrates are monosaccharides and disaccharides. Complex carbohydrates are polysaccharides, or large molecules composed of straight or branched chains of monosaccharides.[0004] For labeling purposes, the Food and Drug Administration (FDA) has declared tha...

Claims


Application Information

Patent Timeline
Patent Type & Authority Applications(United States)
IPC IPC(8): A23L33/00A23L33/20
CPCA23L1/307A23L1/293A23L33/20A23L33/30
Inventor ANFINSEN, JON R.WOLEVER, THOMASSPOLAR, MATTHEWHITCHNER, ELINORWOLFF, PAUL D.
Owner ATKINS NUTRITIONALS
Why Eureka
Try Eureka