Method of monitoring the blending of a mixture
a technology of mixing and monitoring method, which is applied in the direction of fluorescence/phosphorescence, instruments, material analysis, etc., can solve the problems of adversely affecting the quality and effectiveness of the final pharmaceutical composition, ensuring the formation of homogenous mixtures, and monitoring the same can be costly and time-consuming, so as to facilitate rapid and reliable confirmation, improve overall cost-effectiveness and efficiency, and improve the effect of accuracy
- Summary
- Abstract
- Description
- Claims
- Application Information
AI Technical Summary
Benefits of technology
Problems solved by technology
Method used
Image
Examples
example 1
Method for Producing a Standard Homogenous Mixture
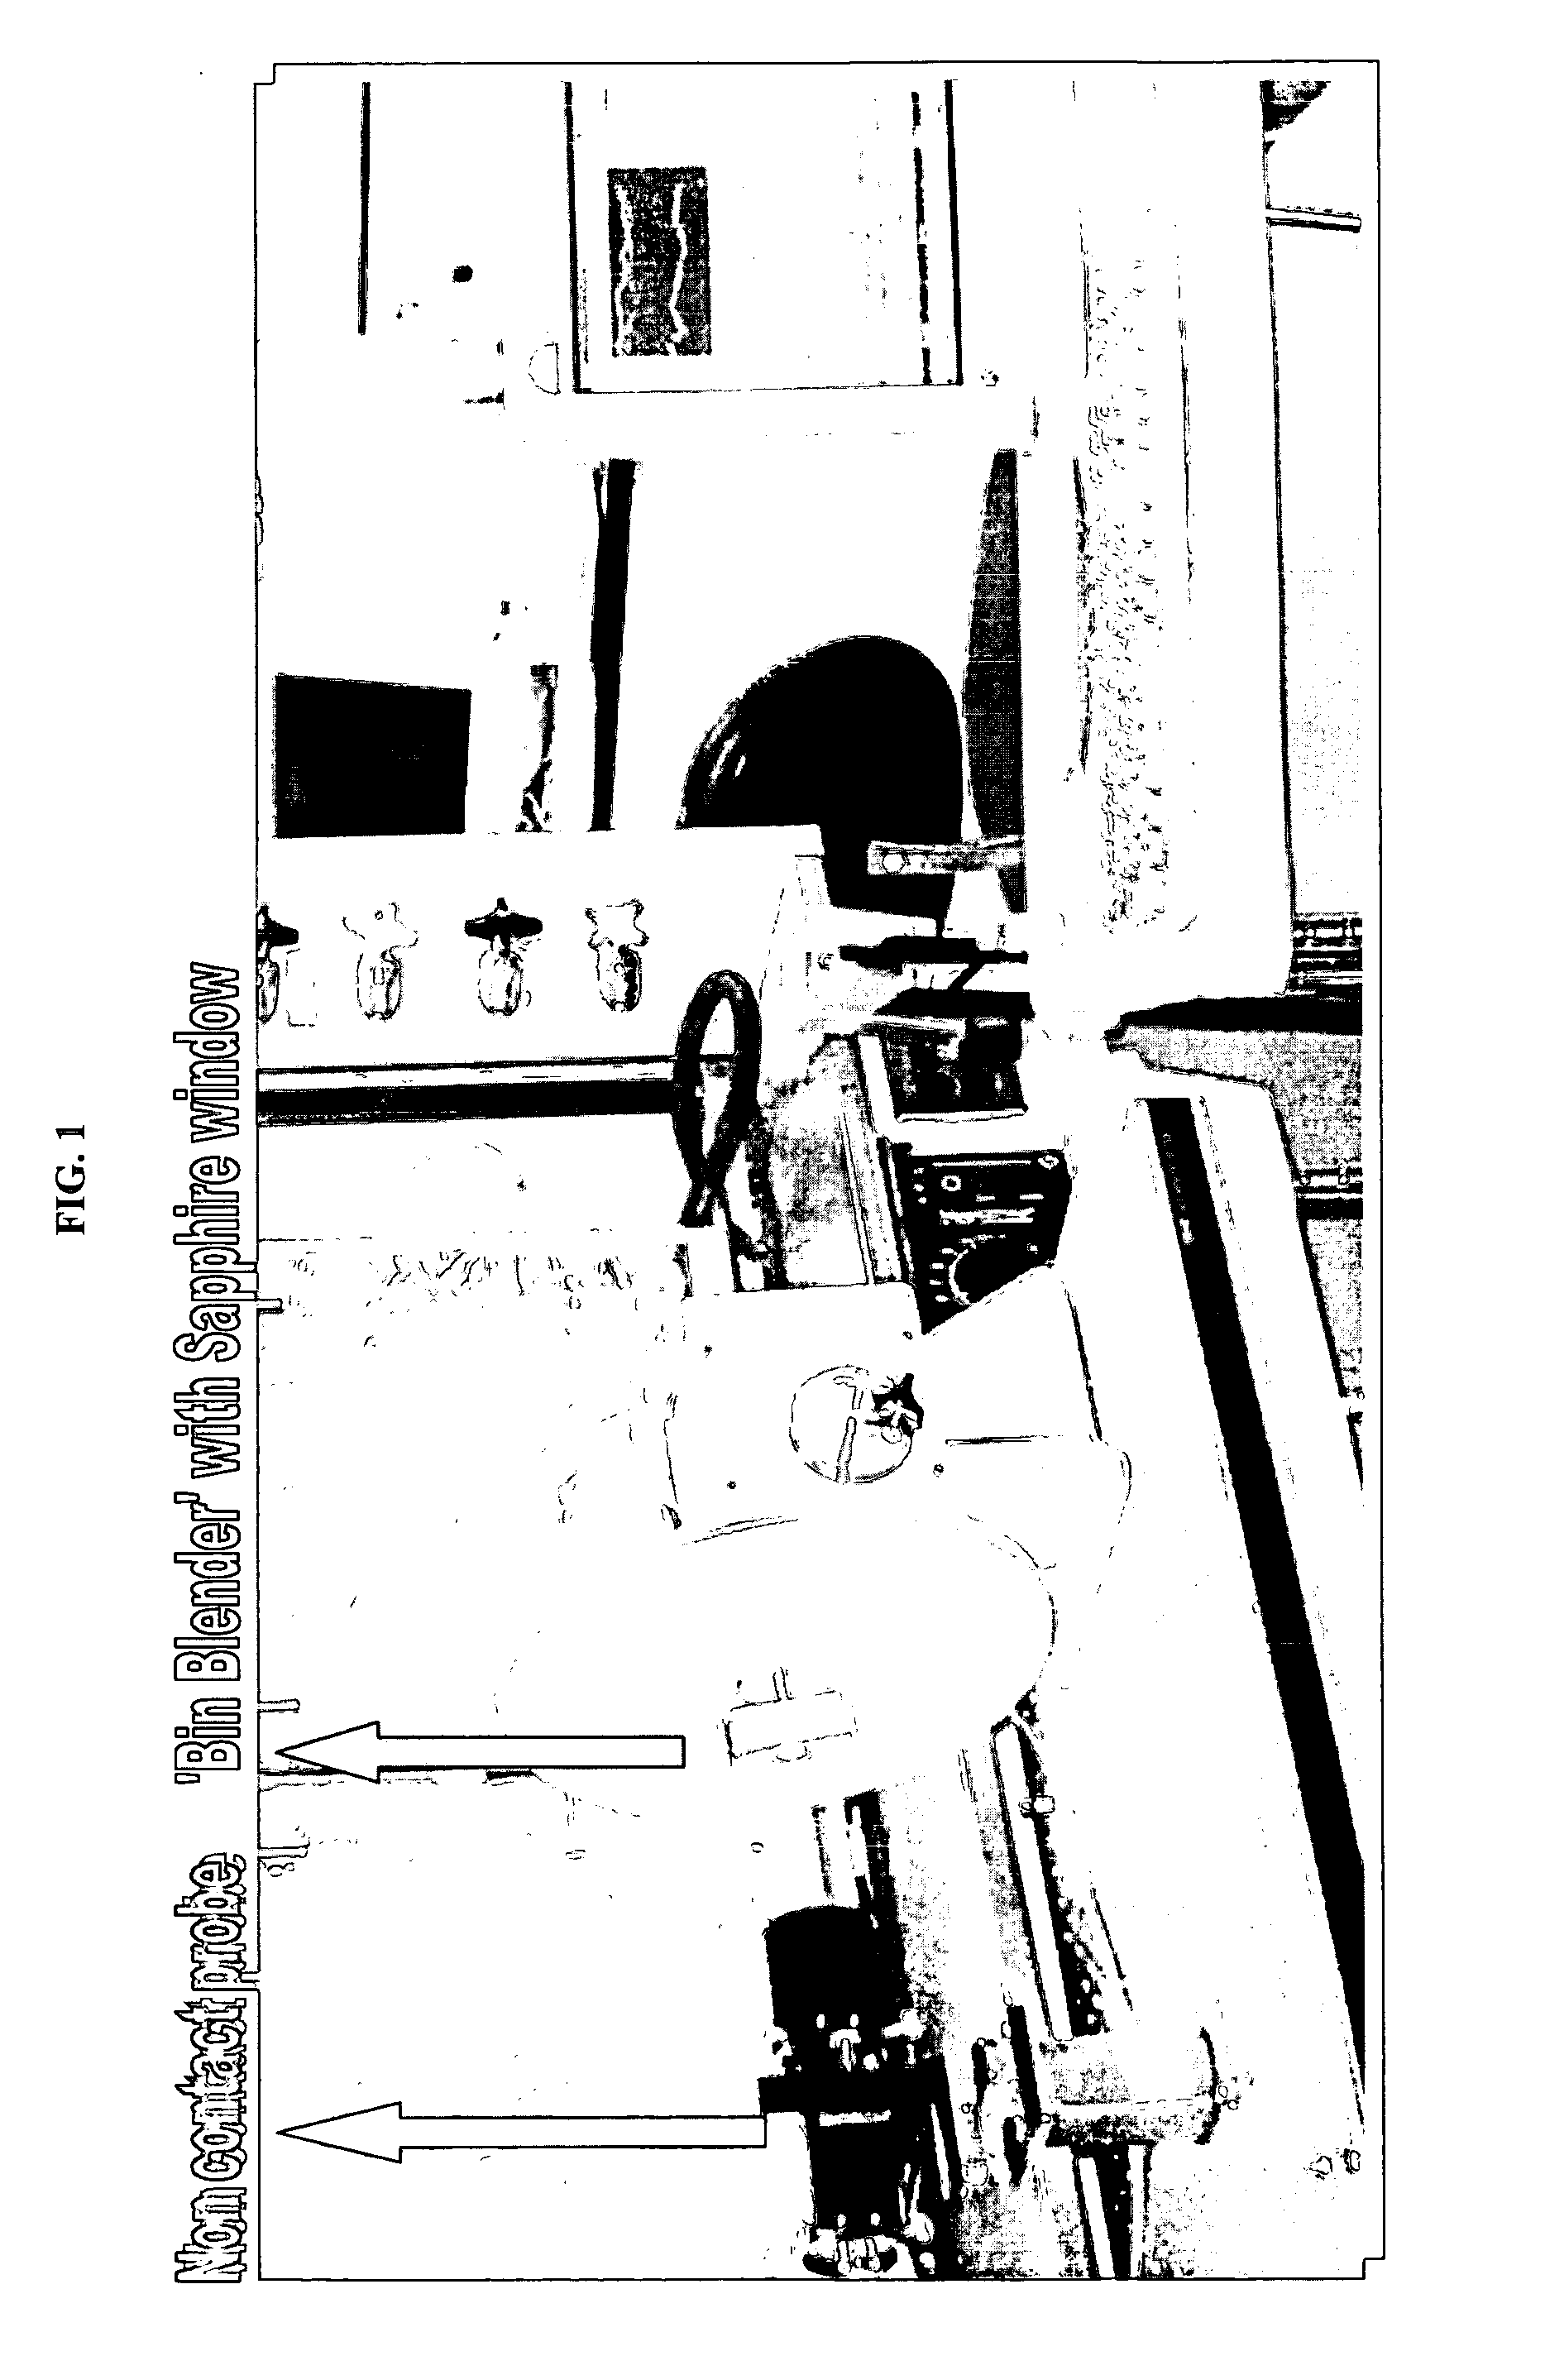
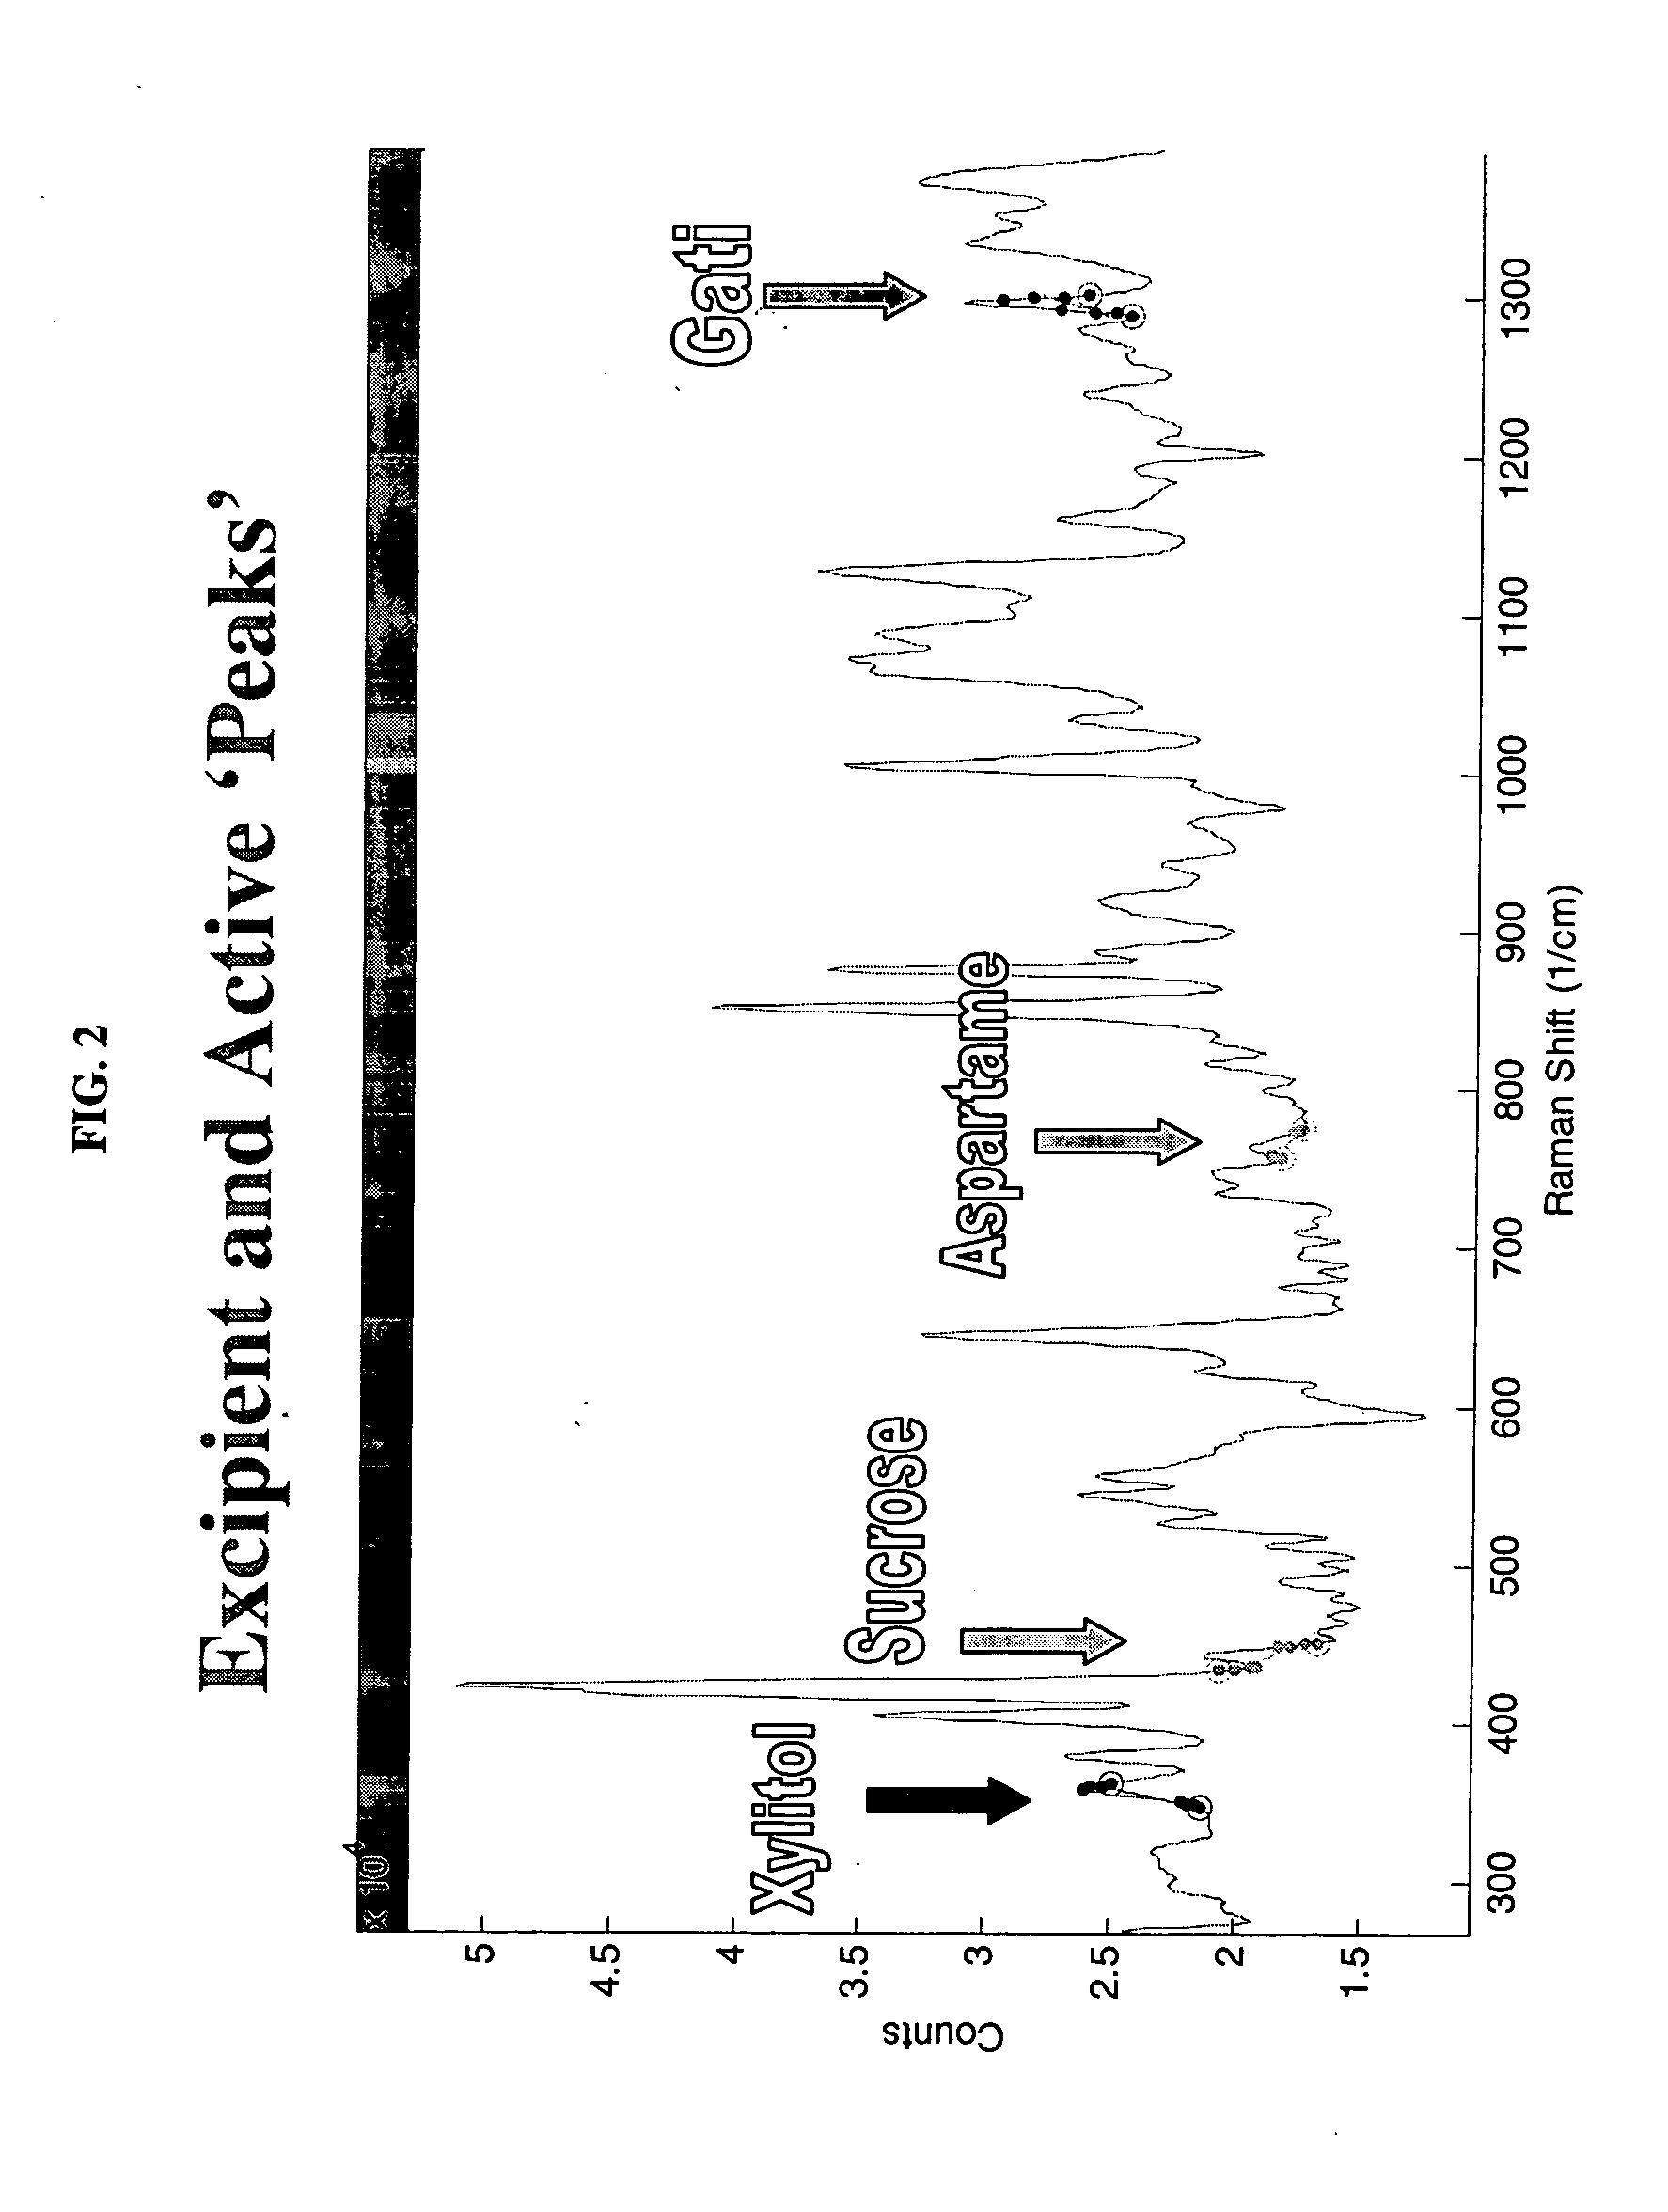
[0055] The following procedure provides a method for creating a standard homogenous mixture from which subsequent sample mixtures may be compared to determine whether the sample mixtures are homogenously blended. In this example, a Raman spectrometer was used to non-invasively monitor the blending of a mixture containing four components. The four components were xylitol, sucrose, aspartame, and gatifloxacin. A small scale bin blender was prepared for blending the components together. The bin blender included a blending vessel having an optical port composed of sapphire to enable remote monitoring. A Raman spectrometer equipped with a 5.5 inch focal length non-contact probe was arranged adjacent to the bin blender with the non-contact probe directed at the sapphire optical port. The Raman spectrometer and non-contact probe were acquired from Kaiser Optical Systems, Inc.
[0056] A computer was prepared and connected for receiving spect...
example 2
Method of Determining the Homogeneity of Blendable Components Through Comparison With a Known Standard Mixture
[0062] Employing the same experimental as described in Example 1, the components consisting solely of xylitol, sucrose, aspartame, and gatifloxacin were added to the bin blender and blending was begun. The computer periodically collected the spectra of the mixture via the Raman spectrometer.
[0063] For each of the spectra obtained, the areas bounded by the spectral response curve and at the endpoints of frequency ranges listed in Table 1 are measured for each component using the Holoreact software program. A ratio of the measured areas is thereafter calculated and monitored for each of the following pairs of components: xylitol and gatifloxacin; aspartame and gatifloxacin; and sucrose and gatifloxacin.
[0064] To determine whether the mixture was homogenous, the calculated ratios of areas were compared to the known standard mixture of Example 1. When the match was achieved, ...
PUM
| Property | Measurement | Unit |
|---|---|---|
| focal length | aaaaa | aaaaa |
| peak spectra | aaaaa | aaaaa |
| homogenous | aaaaa | aaaaa |
Abstract
Description
Claims
Application Information
 - R&D
- Intellectual Property
- Life Sciences
- Materials
- Tech Scout
- Unparalleled Data Quality
- Higher Quality Content
- 60% Fewer Hallucinations
Browse by: Latest US Patents, China's latest patents, Technical Efficacy Thesaurus, Application Domain, Technology Topic, Popular Technical Reports.
© 2025 PatSnap. All rights reserved.Legal|Privacy policy|Modern Slavery Act Transparency Statement|Sitemap|About US| Contact US: help@patsnap.com


