User interface for correlation of analysis systems

a technology of analysis system and user interface, applied in the field of digital processing system, can solve the problems of failure to provide desirable results in other situations or at other periods of time, work well, and company's current stock price to declin

Inactive Publication Date: 2005-04-28
ALPHACET
View PDF6 Cites 176 Cited by
  • Summary
  • Abstract
  • Description
  • Claims
  • Application Information

AI Technical Summary

Benefits of technology

[0014] In another embodiment the invention provides A method for predicting the performance of a system, the method executing on a computer system, the computer system including a processor coupled to a display and coupled to a user input device, the method comprising: displaying a plurality of indicators, wherein an indicator accepts one or more data points and provides a result; accepting a signal from the user input device to select a plurality indicators; associating a plurality of the data points with the plurality of indicators; storing a state of a process including an indication of the selected plurality of indicators and the associated plurality of the data points; and restoring the state of the process including the selected plurality of indicators and the associated plurality of the data points.

Problems solved by technology

Often different techniques may work well in some situations, or for a certain period of time, but will fail to provide desirable results in other situations or at other periods of time.
While this technique might work well where general market trends are the dominating factor in the market's price, the technique might not work well or even at all when a singular factor, such as an excessively high price to earnings ratio, can cause a company's current stock price to decline even when the general market trend for the that company's industry is increasing.
Although traditional techniques have proven to be useful for prediction and analysis of systems such as financial markets, as the number and complexity of techniques grows it is often difficult for a human user of the techniques to effectively use the techniques and to combine or correlate the various results provided by the techniques.

Method used


Image

  • User interface for correlation of analysis systems
  • User interface for correlation of analysis systems
  • User interface for correlation of analysis systems

Examples


Embodiment Construction

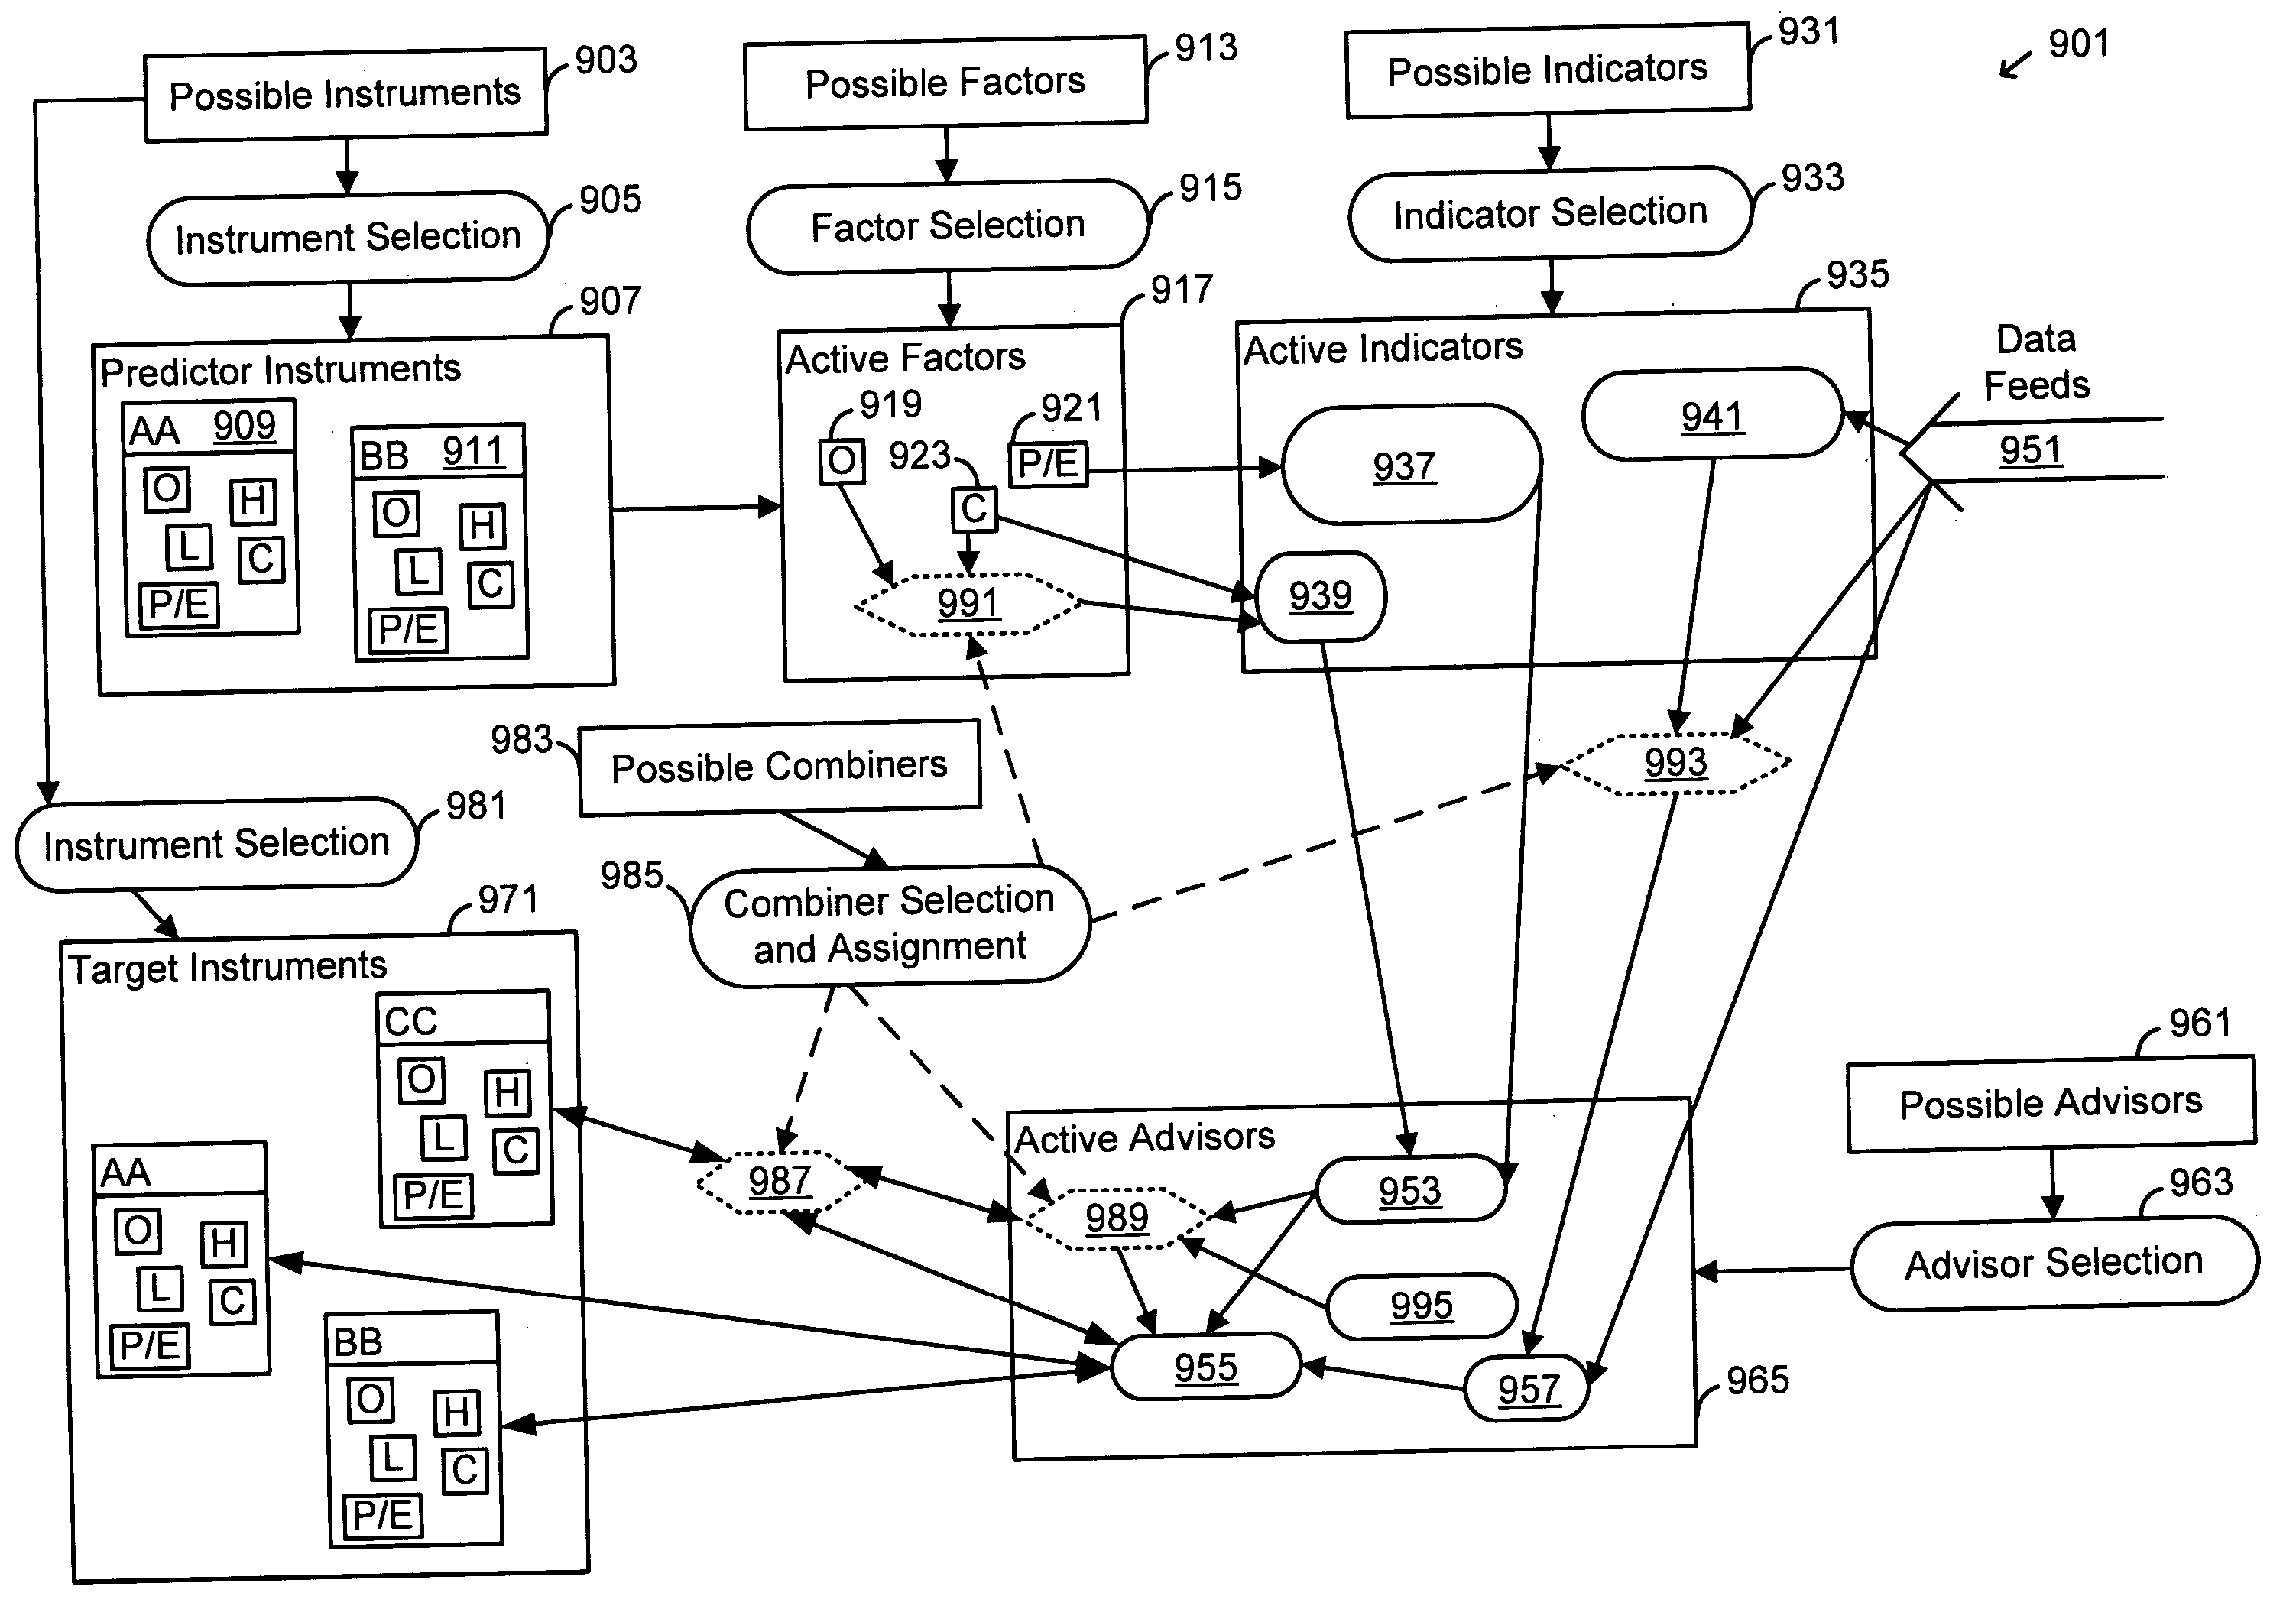
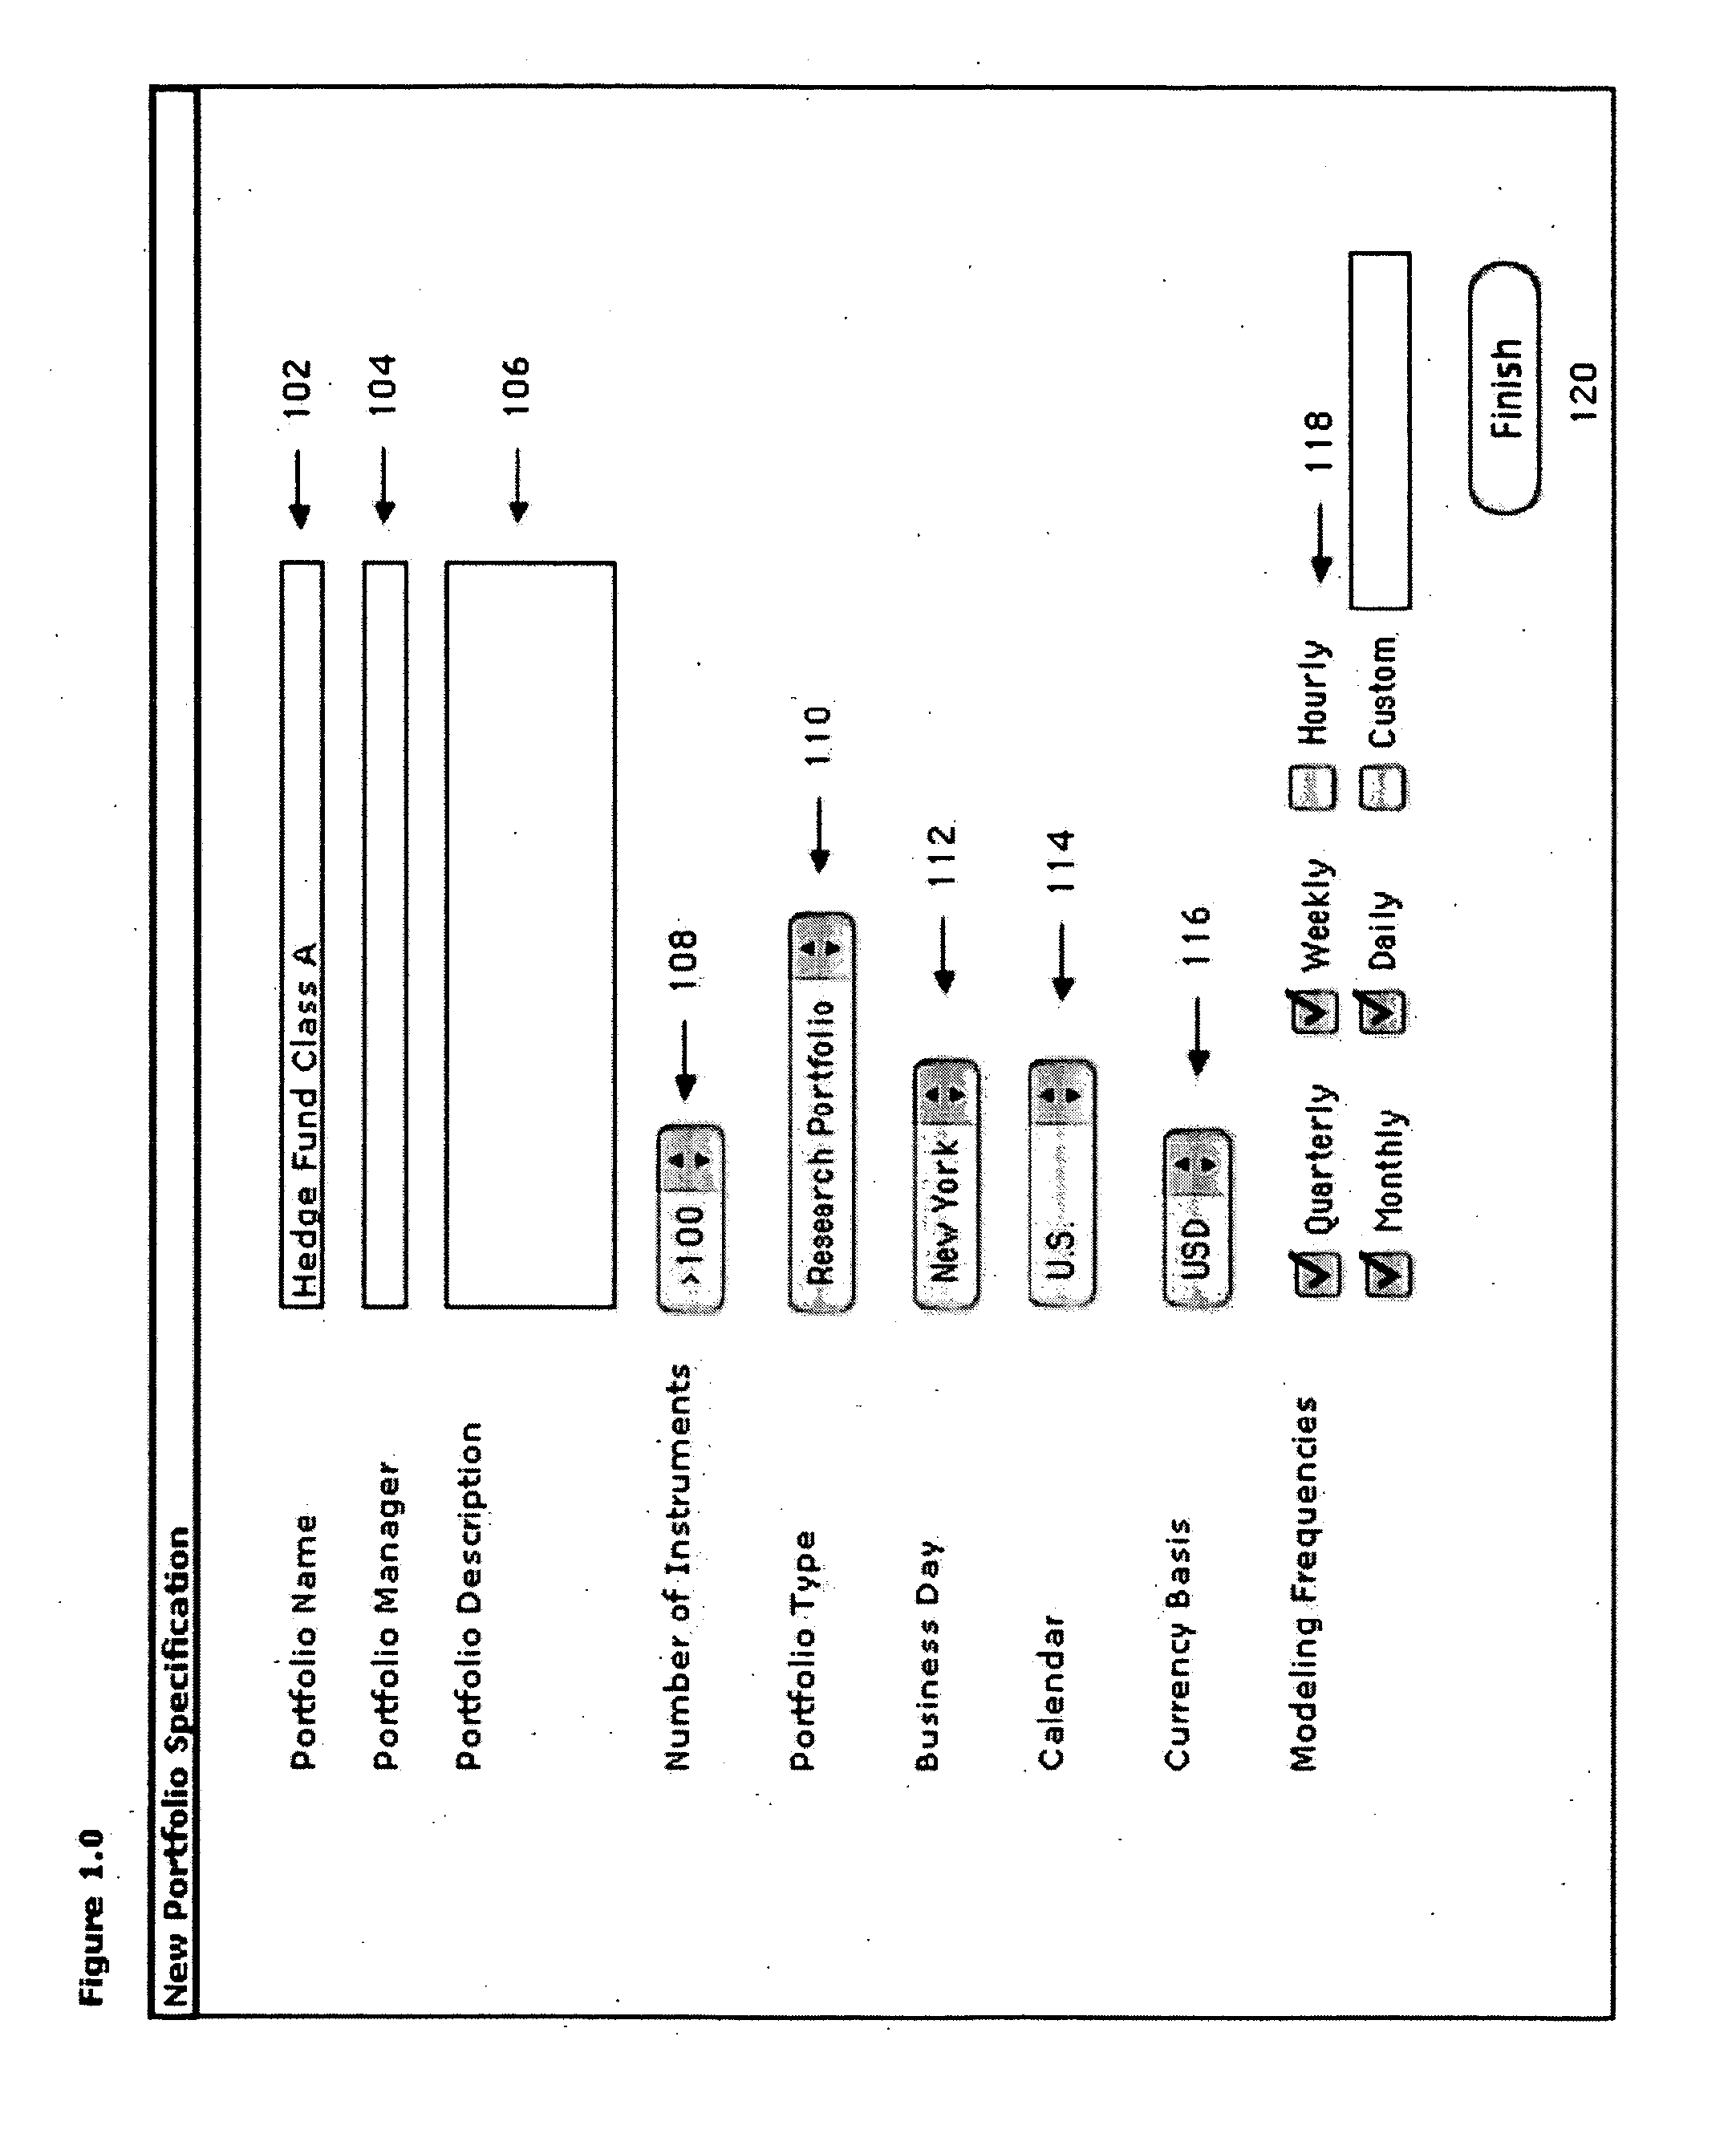
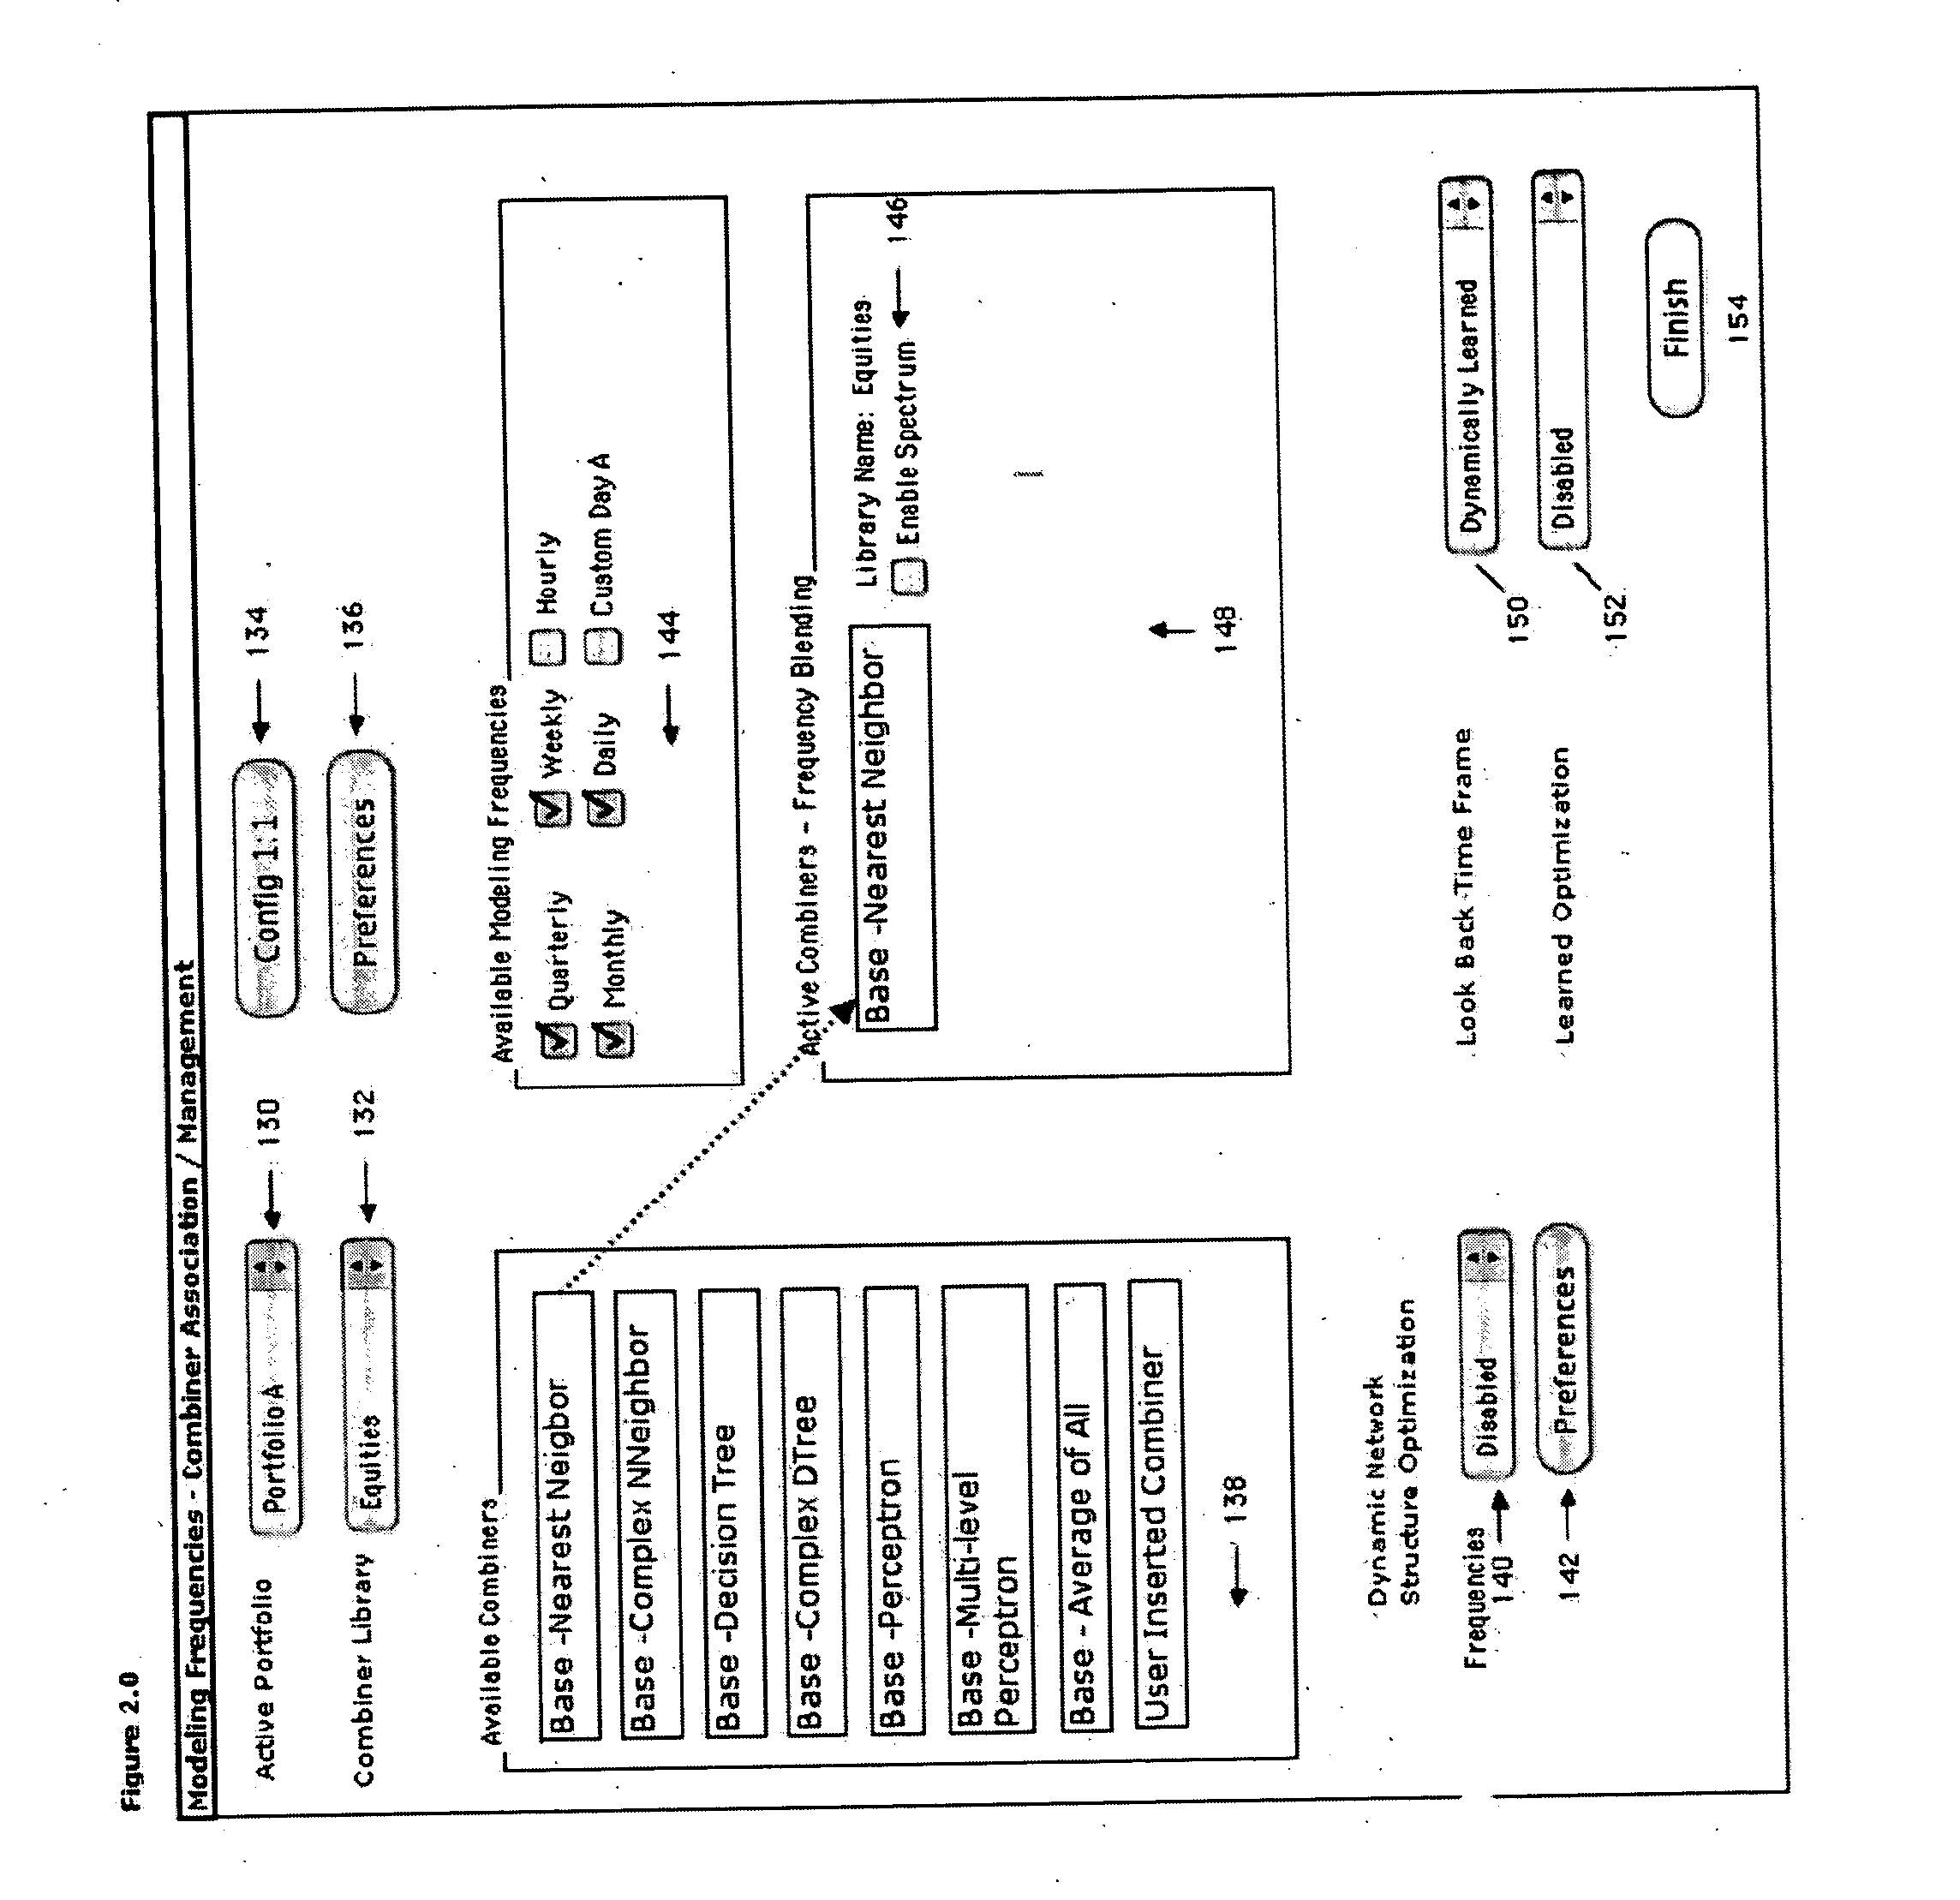
[0012] A system for management, correlation and combination of various analysis techniques, or “advisors.” Graphical user interface (GUI) controls and displays are provided to allow a user to configure different aspects of an analysis system. A financial analysis application allows a user to designate instruments whose data points, factors or other relevant data can be pre-processed with indicators. The outputs of the indicators are provided to advisors for calculation and grouping. A user is able to select the, types of raw data to use, the instruments, the factors, the data feeds and other sources for data, the indicators that perform processing and the advisors that perform analysis, grouping and outputting of results for combining using machine learning mechanisms. A user can set or adjust other parameters such as modeling frequency, scheduled processing, whether the system is running a simulation or is designed for higher performance execution. These and other characteristics o...


PUM


Abstract

A system for management, correlation and combination of various analysis techniques, or “advisors.” Graphical user interface (GUI) controls and displays are provided to allow a user to configure different aspects of an analysis system. A financial analysis application allows a user to designate instruments whose data points, factors or other relevant data can be pre-processed with indicators. The outputs of the indicators are provided to advisors for calculation and grouping. A user is able to select the types of raw data to use, the instruments, the factors, the data feeds and other sources for data, the indicators that perform processing and the advisors that perform analysis, grouping and outputting of results for combining using machine learning mechanisms. A user can set or adjust other parameters such as modeling frequency, scheduled processing, whether the system is running a simulation or is designed for higher performance execution. These and other characteristics of the system can be saved as a portfolio for later use and adjustment by the user. Other features are described.

Description

CLAIM OF PRIORITY [0001] This patent application claims the priority and benefit of the following provisional patent applications fully incorporated herein by reference thereto as if repeated verbatim immediately hereinafter. Benefit of these filing dates is claimed with respect to all common subject matter: [0002] Application No. 60 / 513,938, filed Oct. 23, 2003, entitled “SYSTEM AND METHOD FOR PREDICTING STOCK PRICES”; and [0003] Application No. 60 / 514,033 and filed Oct. 23, 2003, entitled “INTELLIGENT AGENTS FOR PREDICTIVE MODELING”. RELATED APPLICATIONS [0004] This invention is related to the following co-pending U.S. patent applications fully incorporated herein by reference thereto as if repeated verbatim immediately hereinafter: [0005] Ser. No. ______ [TBD] filed on Oct. 21, 2004, entitled “SYSTEM AND METHOD FOR PREDICTING STOCK PRICES”; and [0006] Ser. No. ______ [TBD] filed on Oct. 21, 2004, entitled “INTELLIGENT AGENTS FOR PREDICTIVE MODELING”.BACKGROUND OF THE INVENTION [0...

Claims


Application Information

Patent Timeline
Patent Type & Authority Applications(United States)
IPC IPC(8): G06Q40/00
CPCG06Q40/00G06Q40/06G06Q40/04
Inventor INGARGIOLA, ROSARIO MICHAELLEVINSON, ROBERT
Owner ALPHACET
Why Eureka
Try Eureka