Biometric quality control process

a biometric and quality control technology, applied in the direction of testing/monitoring control systems, instruments, testing circuits, etc., can solve the problems of frequent false alarms, large varying costs, and the structure continues to utilize a relatively complex statistical process control framework

Inactive Publication Date: 2005-06-09
BIO RAD LAB INC
View PDF5 Cites 15 Cited by
  • Summary
  • Abstract
  • Description
  • Claims
  • Application Information

AI Technical Summary

Benefits of technology

[0010] The present invention provides, in one aspect, systems and methods configured to guide and manage laboratory analytical process control operations. In certain aspects, the present invention provides a Biometric quality control (QC) process application configured to monitor bias and imprecision for each test, characterize patient population data distributions and compare, contrast, and correlate changes in patient data distributions to any change in QC data populations. The Biometric QC application of the present invention is also configured to provide alerts to an operator when actionable error is present and guide the operator in troubleshooting.

Problems solved by technology

Even with these improvements, the Westgard scheme continues to utilize a relatively complex statistical process control framework.
This approach, often misapplied, results in frequent alarms normally judged false or unwarranted when compared to medical decision limits (medical relevance).
While this patchwork generally results in acceptable outputs, it is marred by widely varying costs, inconsistent application and failed expectations.
Many labs may not understand how to apply the rules.
Consequently, false error detection may frequently lead to test operator indifference.
The basic premise is that the statistical control system they use creates too many unwarranted errors so they automatically assume the error flag is false.
Typically, the most common causes of QC error flags include random error, environmental conditions, control range too tight or incorrectly calculated, reagent (lot change, deterioration, contamination), control problems, calibration, sampling error, instrument malfunction, and poor maintenance.
Laboratory staff typically consider troubleshooting to be complex and often unguided.

Method used


Image

  • Biometric quality control process
  • Biometric quality control process
  • Biometric quality control process

Examples


Embodiment Construction

[0066] Definitions for various terms as used herein can be found at the glossary section at the end of this section in Appendix B.

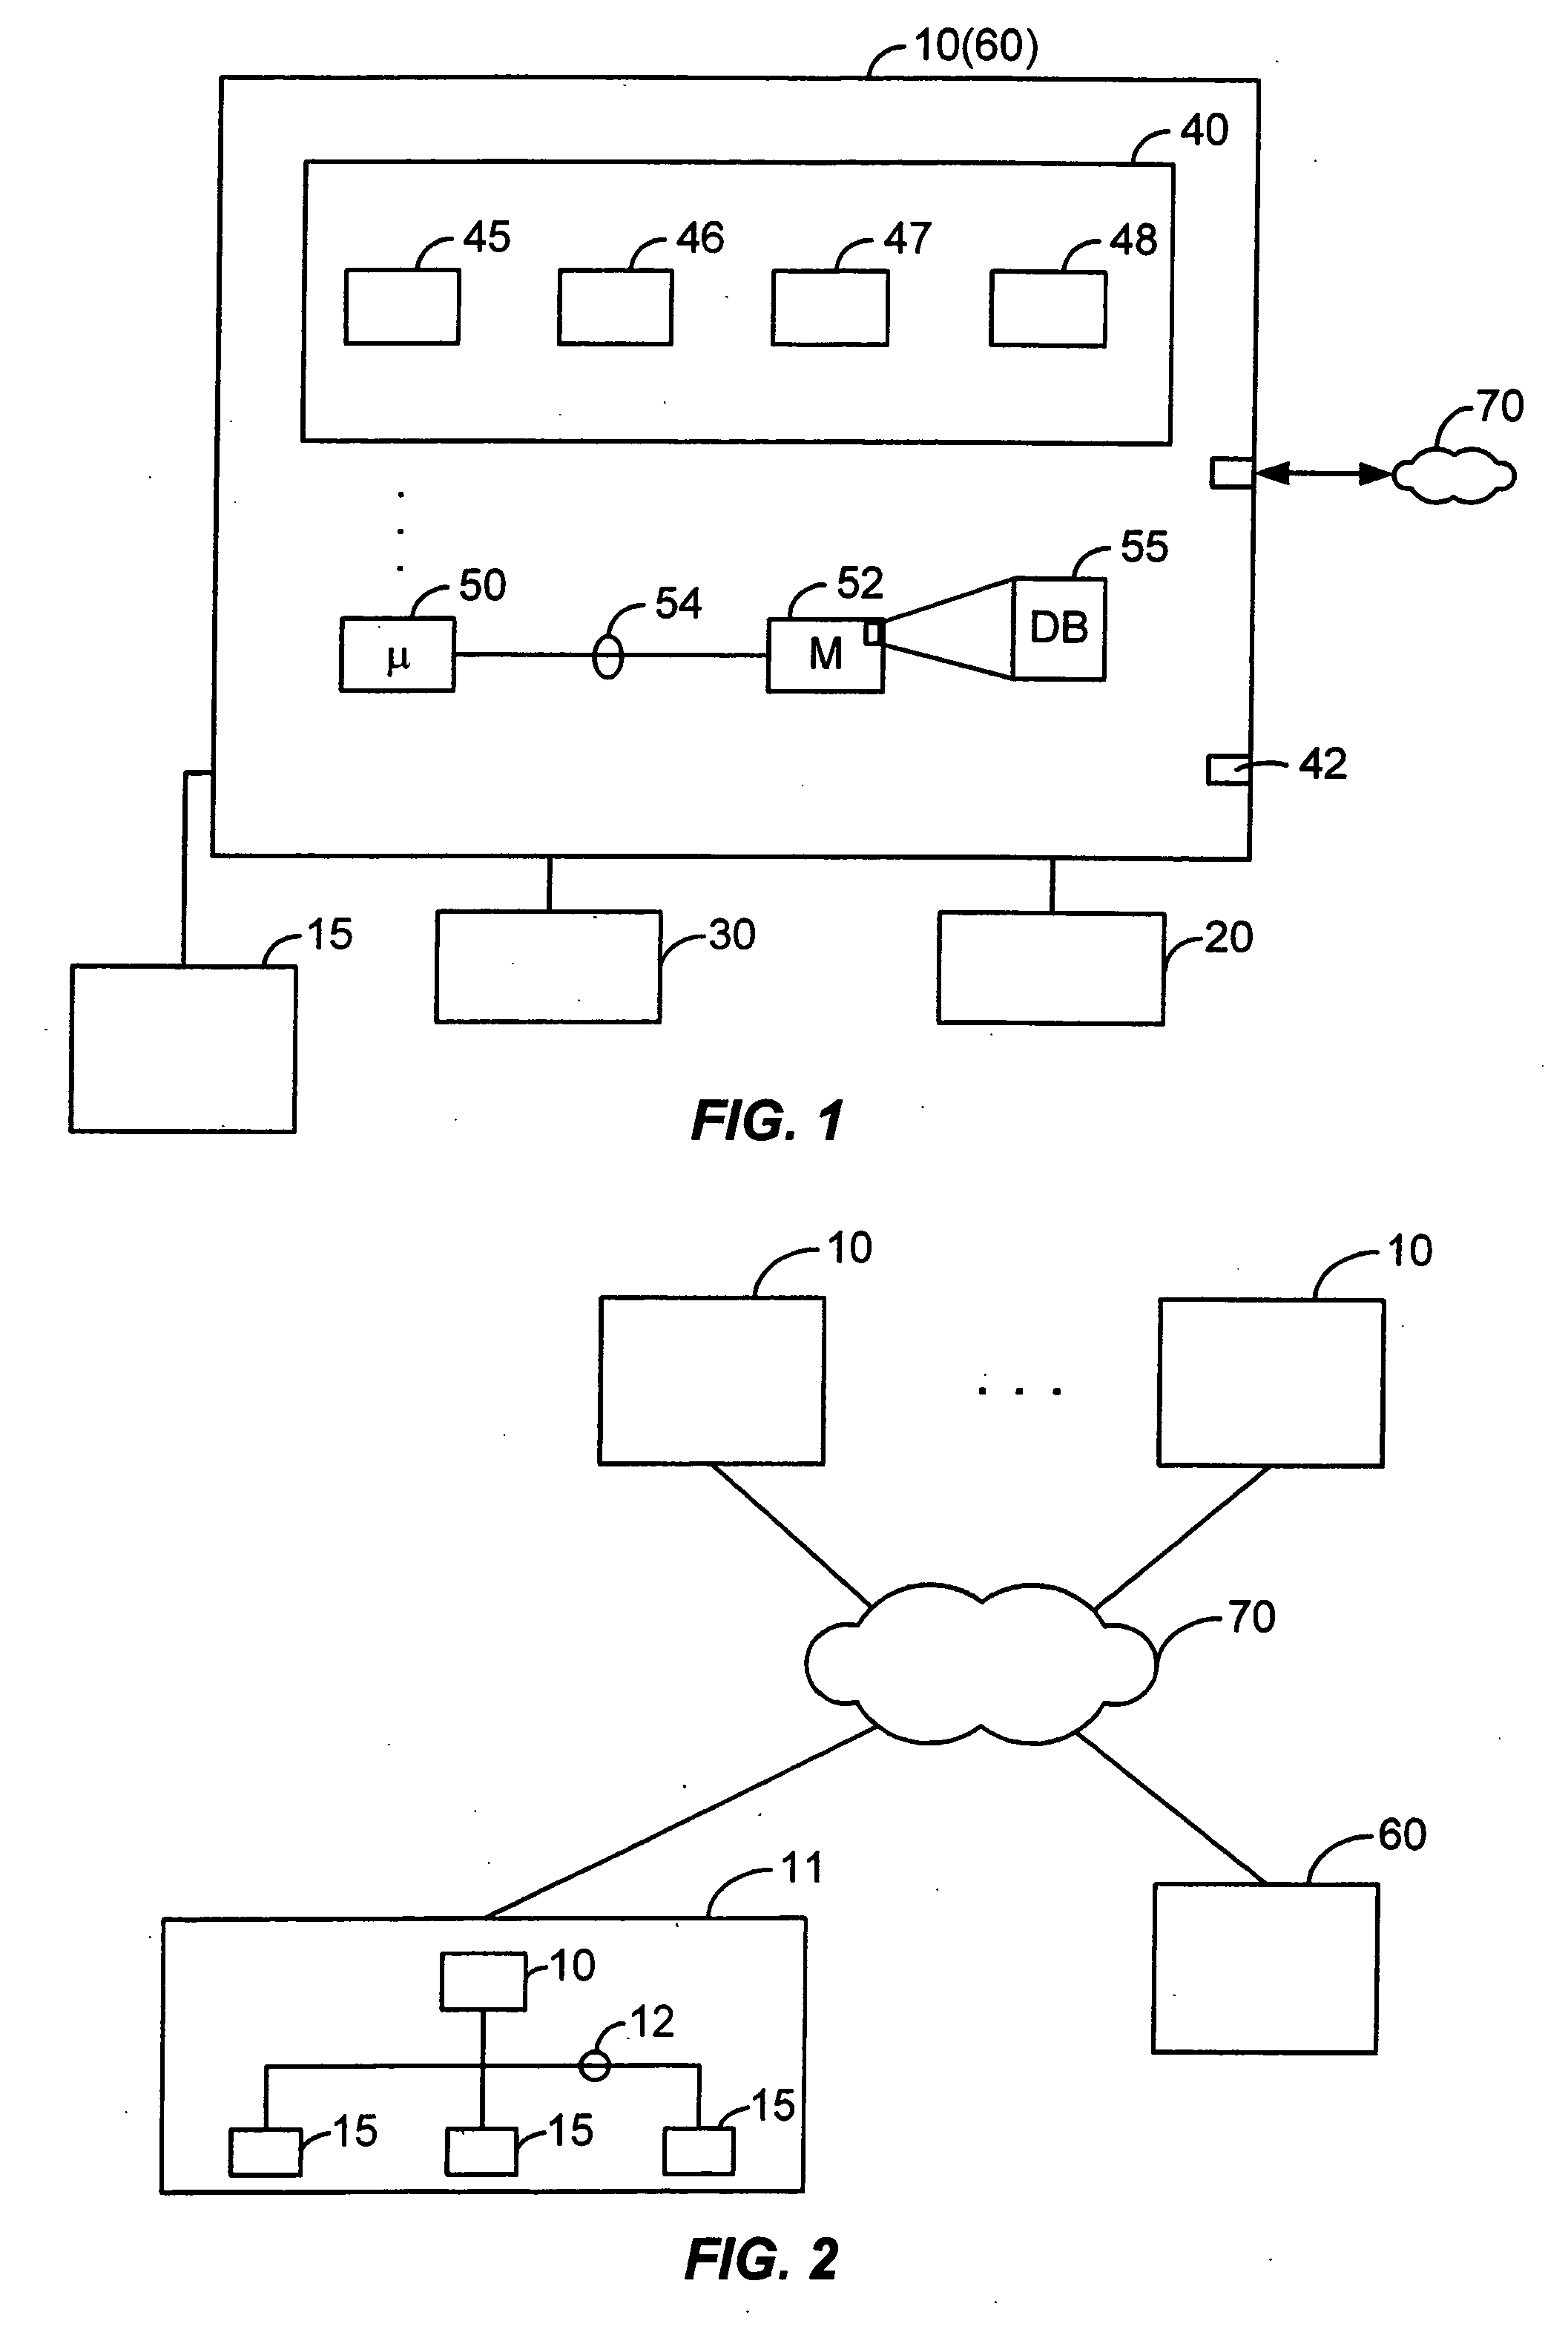
[0067]FIG. 1 illustrates a client computer system 10 configured with a Biometric QC application module 40 (also referred to herein as, for example, “Biometric QC application” or “Biometric QC module”) according to the present invention. FIG. 2 illustrates a network arrangement for executing a shared application and / or communicating data and commands between multiple computing systems and devices according to another embodiment of the present invention. Client computer system 10 may operate as a stand-alone system or it may be connected to server 60 and / or other client systems 10 and devices 15 over a network 70.

[0068] Several elements in the system shown in FIGS. 1 and 2 include conventional, well-known elements that need not be explained in detail here. For example, a client system 10 could include a desktop personal computer, workstation, laptop, or a...


PUM

PropertyMeasurementUnit
timeaaaaaaaaaa
timeaaaaaaaaaa
timeaaaaaaaaaa

Abstract

Systems and methods configured to guide and manage laboratory analytical process control operations. A Biometric quality control (QC) process application is configured to monitor bias and imprecision for each test, characterize patient population data distributions and compare, contrast, and correlate changes in patient data distributions to any change in QC data populations. The Biometric QC process monitors the analytical process using data collected from repetitive testing of quality control materials and patient data (test results). The QC process identifies the optimal combination of, for example, frequency of QC testing, number of QCs tested, and QC rules applied in order to minimize the expected number of unacceptable patient results produced due to any out-of-control error condition that might occur.

Description

CROSS-REFERENCES TO RELATED APPLICATIONS [0001] This application claims the benefit of U.S. Provisional Application Ser. No. 60 / 314,923, filed Aug. 24, 2001, entitled “Biometric Quality Control Process”, which is hereby incorporated by reference in its entirety for all purposes.BACKGROUND OF THE INVENTION [0002] The present invention relates generally to processes for implementing Biometric Quality Control (QC), and more particularly to systems and methods for guiding and managing laboratory analytical process control operations. [0003] Advances in laboratory technology have improved test performance beyond the ability of conventional process control systems to monitor performance effectively. The process control system used by most laboratories since the early 1980s is that of Westgard. (See, J. O. Westgard, P. L. Barry, M. R. Hunt: A Multi-Rule Shewhart Chart for Quality Control in Clinical Chemistry CLIN. CHEM. 27 / 3, 493-501, 1981). This system is based on a set of six core stati...

Claims


Application Information

Patent Timeline
Patent Type & Authority Applications(United States)
IPC IPC(8): G01B3/22G01B5/20G01B11/24G01N35/00G01N33/48G01R27/28G01R31/00G01R31/14G06Q10/00G06Q50/00G16H10/40G16H10/60G16H40/20
CPCG01N35/00594G06F19/327Y10T436/10G06Q10/10G06Q50/22G06F19/366G16H40/20G16H10/40G16H10/60
Inventor PARVIN, CURTISCEMBROWSKI, GEORGECOOPER, WILLIAM G.
Owner BIO RAD LAB INC
Why Eureka
Try Eureka