Method of identifying paths with delays dominated by a particular factor

a delay and factor technology, applied in the field of design performance analysis, can solve the problems of affecting the design performance, and a much higher fraction of wire delay,

Inactive Publication Date: 2005-11-03
GLOBALFOUNDRIES INC
View PDF13 Cites 5 Cited by
  • Summary
  • Abstract
  • Description
  • Claims
  • Application Information

AI Technical Summary

Problems solved by technology

However, a disadvantage of path-based approaches is that the number of paths through a digital network (and hence the runtime of the method) can be exponential in the size of the overall network, and thus examination of all paths in real designs may be impossible in practice.
However, a problem with this approach is that the analysis may miss a path which is significant in its timing delay and which may affect the design performance.
Traditionally, this is a difficult problem with conventional node-based static timing analysis because only the information about the longest or shortest path to a node is retained on that node.
However, there may be sub-critical paths (paths which are not the longest or shortest) which have a much higher fraction of wire delay than the longest or shortest path.
In fact, the only known conventional methods known to answer this problem involve tracing all paths in the network; however this may be impractical due to excessive runtimes, as described above.
However, while the above-referenced prior art techniques and systems were adequate for the purposes for which they were designed, their solutions have not distinguished between various types of delays in the paths through a network, and have rather focused on the total delay of all the paths.

Method used


Image

  • Method of identifying paths with delays dominated by a particular factor
  • Method of identifying paths with delays dominated by a particular factor
  • Method of identifying paths with delays dominated by a particular factor

Examples


first embodiment

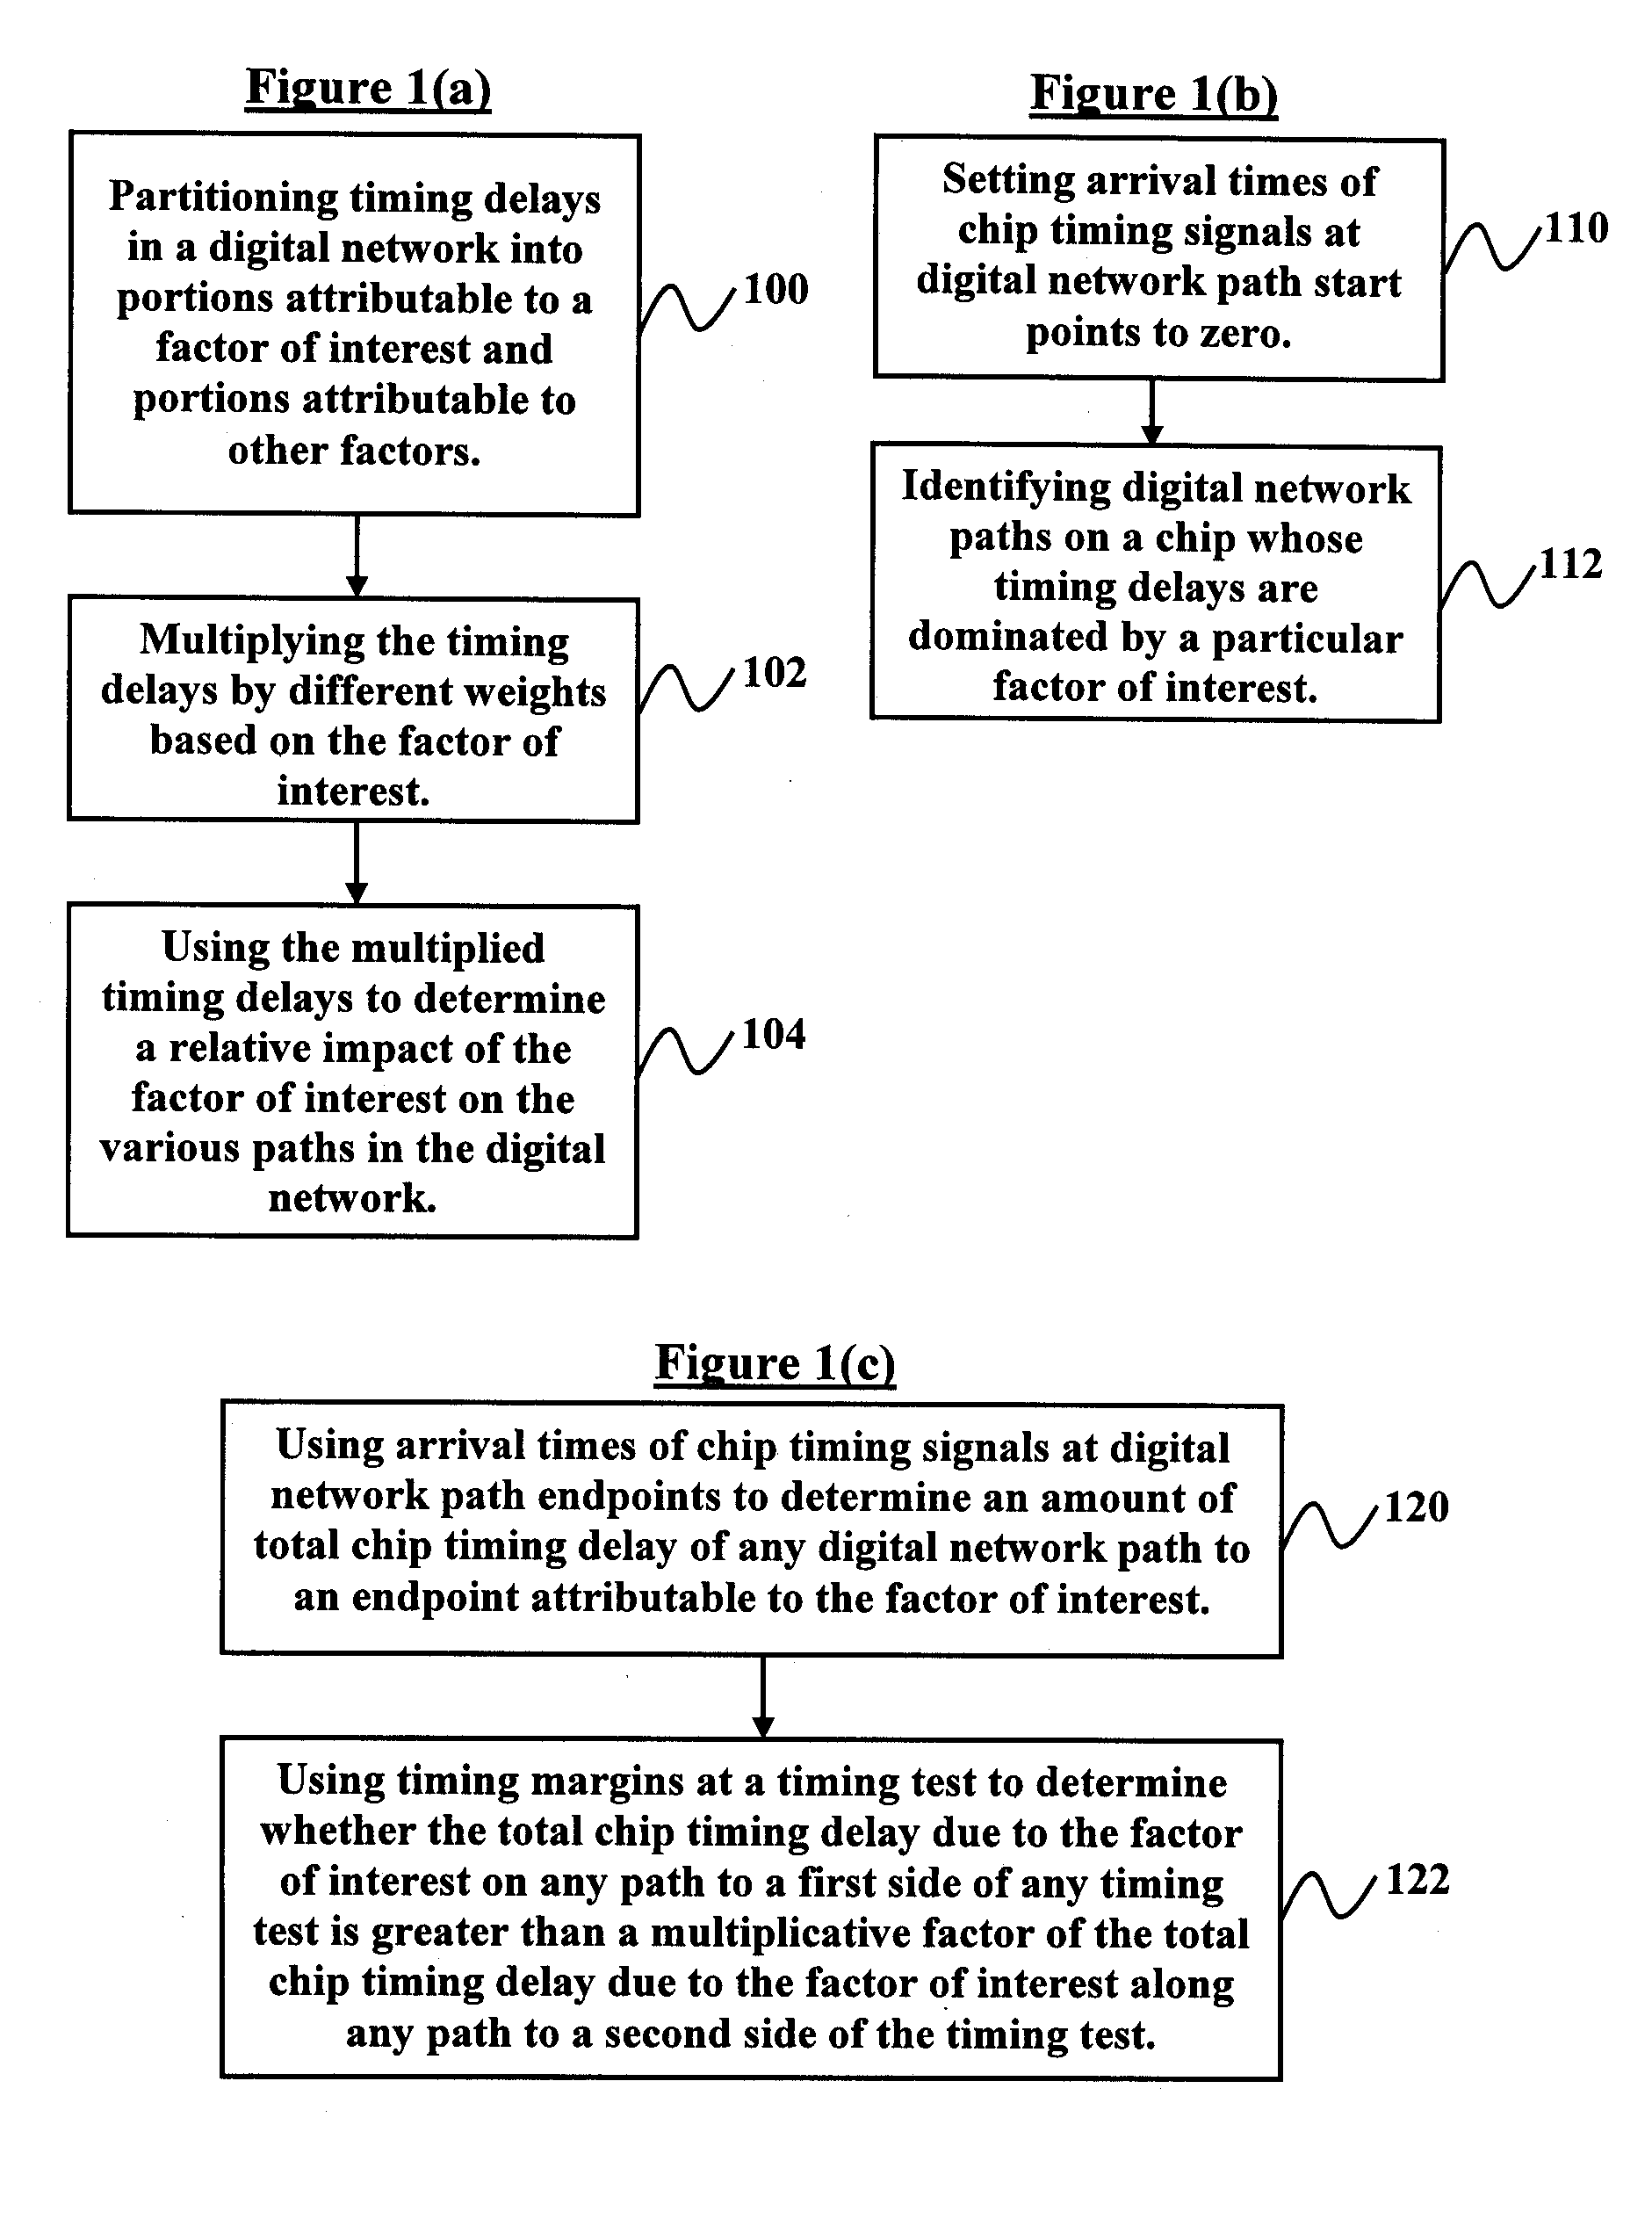
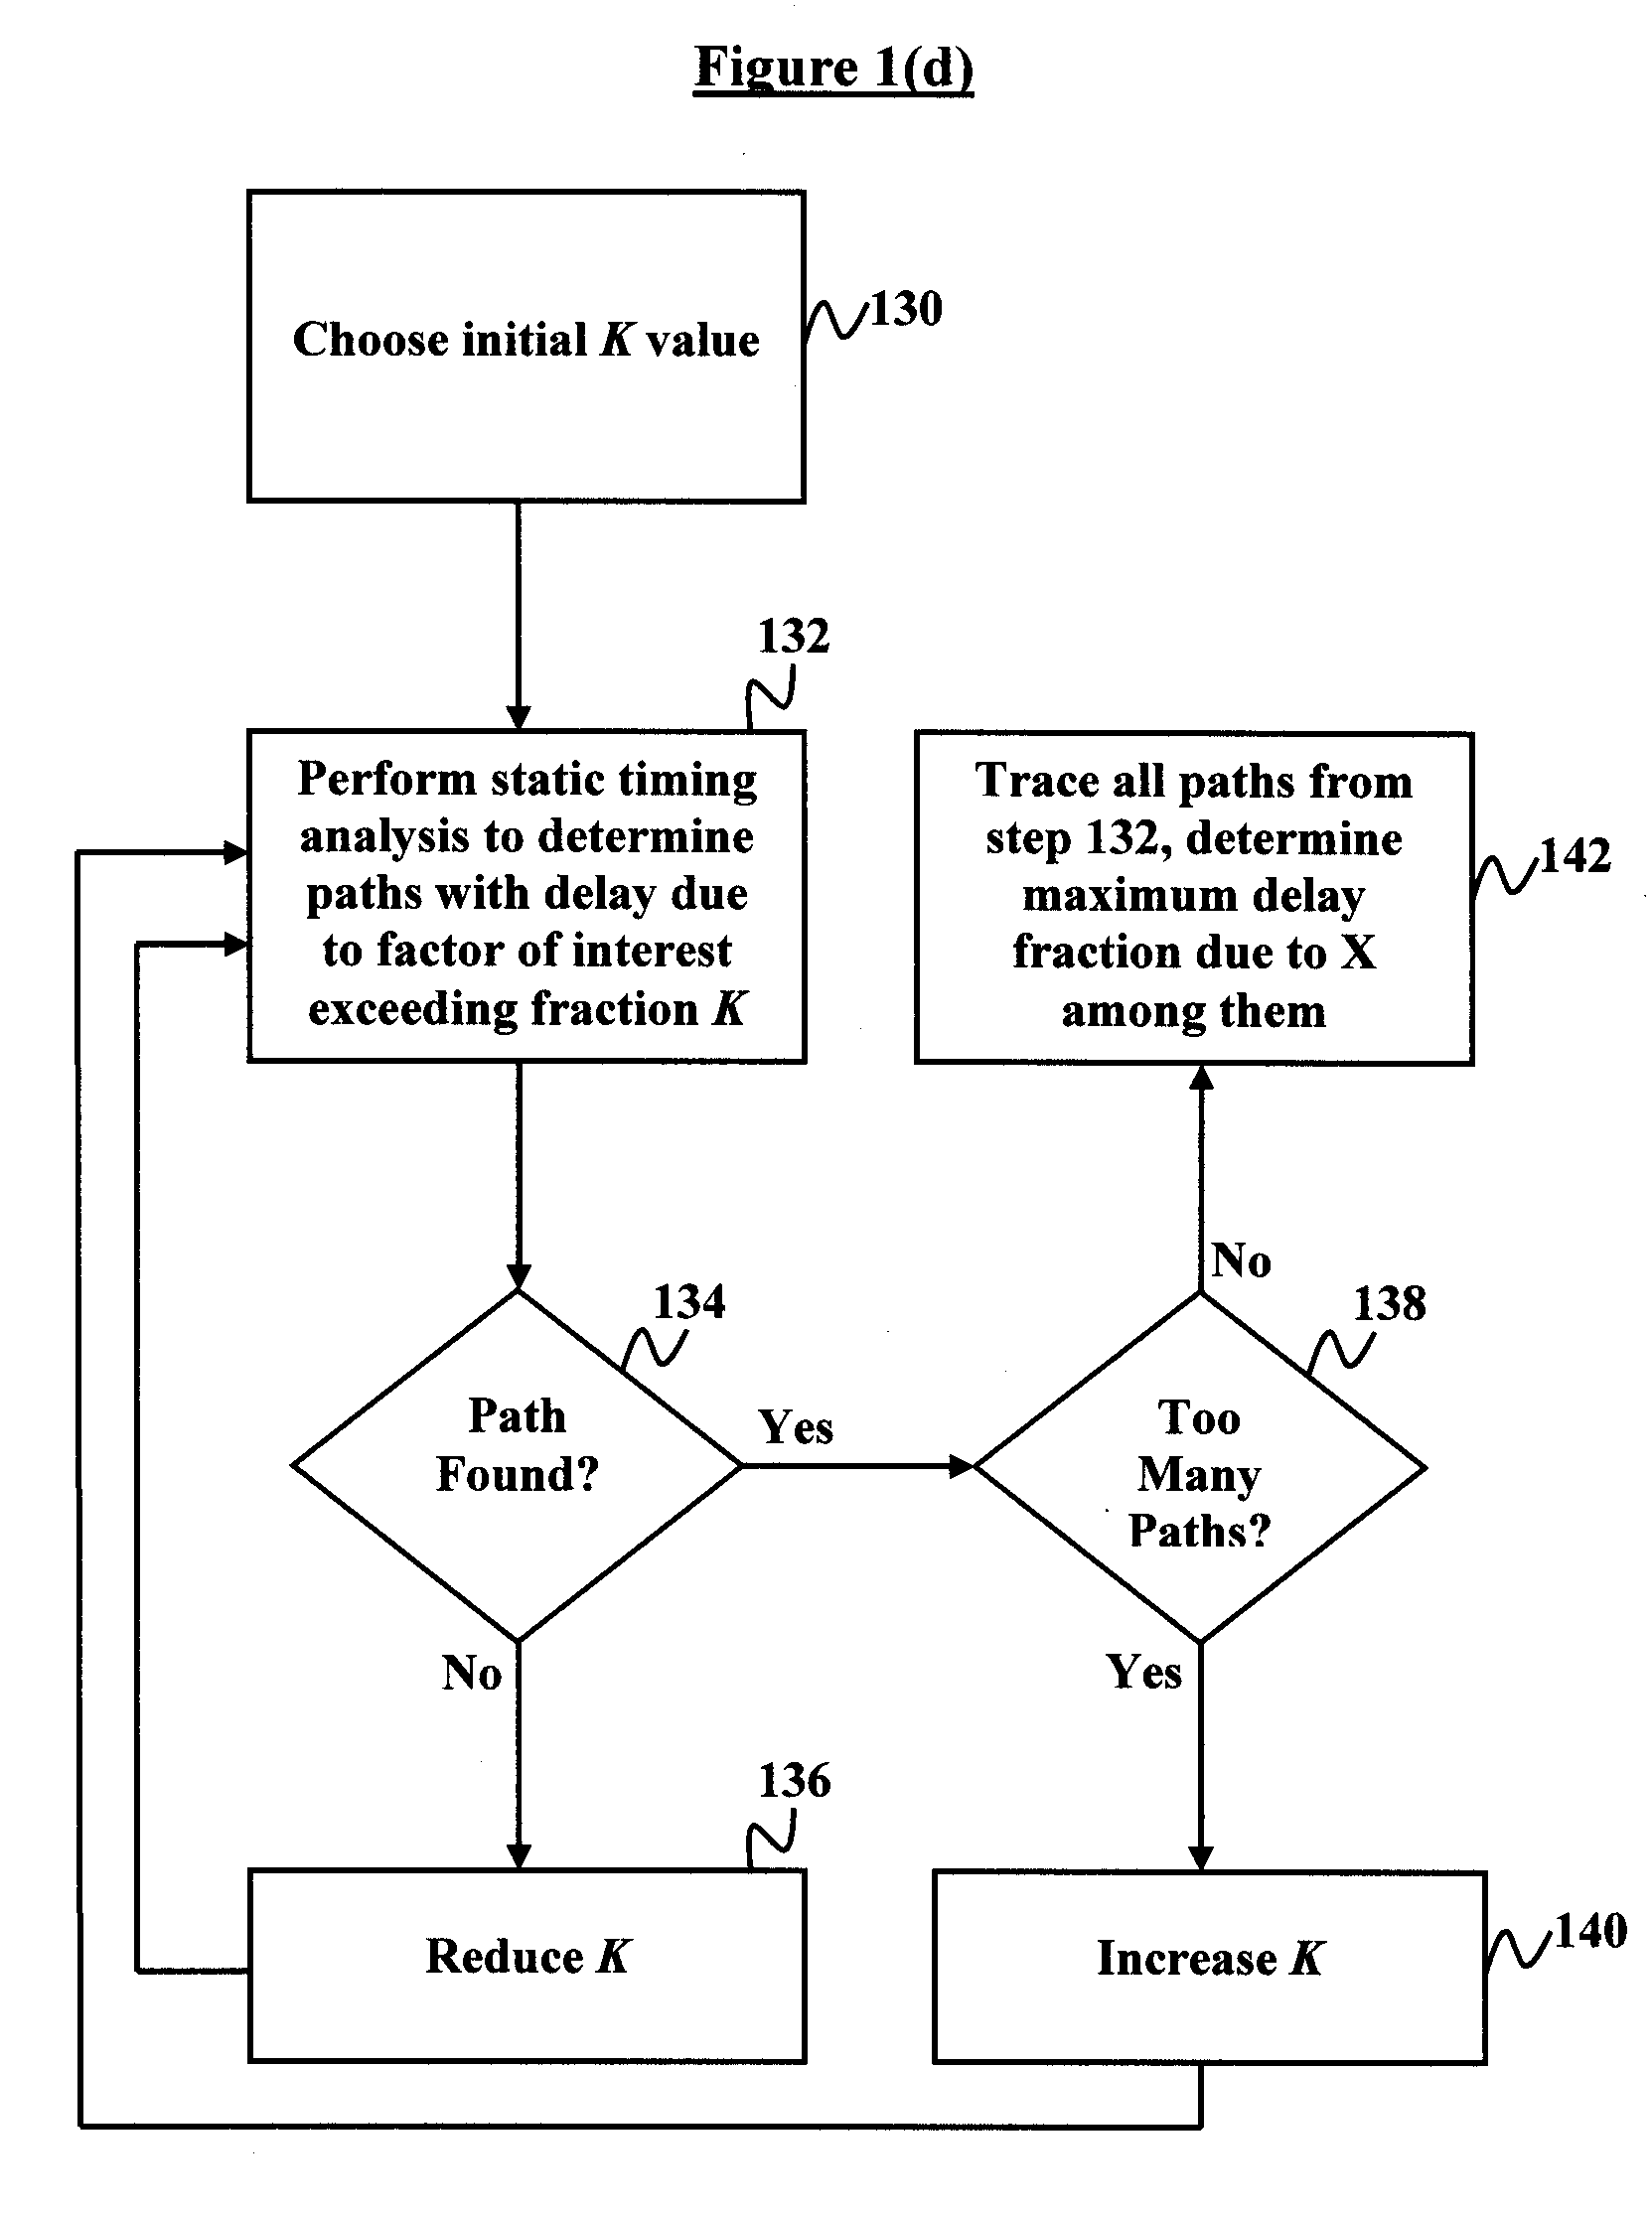
[0035] In the invention all paths in a network are identified whose fraction of delay due to some factor x is greater than some specified threshold K. Next all delays dx (i.e., delay due to factor x) are multiplied by any arbitrary positive factor Kx and all delays do (i.e., delay due to other factors o) are multiplied by Kx*K / (1−K). One choice is to set Kx=1 / K, so that all delays dx may be multiplied by 1 / K and all delays do may be multiplied by −1 / (1−K).

[0036] Thereafter, ATs at all path start points are set to zero. If all X-dominated paths are to be traced, then the required arrival times (RATs) at all path endpoints may be set to zero, allowing normal slack-based late mode path tracing to be used to determine the X-dominated paths. Whereas, if it is only desirable to determine whether at least one AT-dominated path exists to any given path endpoint, no RAT setting or propagation is required. A normal late mode node-oriented static timing analysis is then performed. Any path end...

third embodiment

[0040] In a third embodiment, it is determined which timing tests in which the portion of the delay of the late mode path to the test which is due to factor X is greater than R times the portion of the delay of the early mode path to the test which is due to factor X. In this case the start node arrival times are again set to zero, the delays dx in the late mode paths are multiplied by any positive factor Kx, and the delays do in the late mode paths are multiplied by 0 (i.e., they are omitted). The delays dx in the early mode paths are multiplied by Kx*R, and the delays do in the early mode paths are also multiplied by 0. A normal static timing analysis is then performed. Any test with a negative slack indicates that the portion of the delay of some late mode path to the test which is due to factor X is greater than R times the portion of the delay of some early mode path to the test which is due to factor X.

[0041] Once again normal path tracing (using the RATs computed due to the t...


PUM


Abstract

A method of performing node-based static timing analysis on a digital network and a program storage device for implementing the method, wherein the method comprises partitioning timing delays in the digital network into portions attributable to a factor of interest and portions attributable to other factors; multiplying the timing delays by different weights based on the factor of interest to produce weighted timing delays; and using the multiplied timing delays to determine a relative impact of the factor of interest on the various paths in the digital network. The method further comprises setting arrival times of timing signals at digital network path start points to zero and identifying digital network paths whose timing delays are dominated by a particular factor of interest. The different weights comprise any of a positive weight, a negative weight, and a zero weight.

Description

BACKGROUND OF INVENTION [0001] 1. Field of the Invention [0002] The invention generally relates to design performance analysis, and more particularly to static timing analysis used in digital design testing. [0003] 2. Description of the Related Art [0004] In the technological field relating to static timing analysis, various methods are used to determine whether a digital design satisfies a given set of predefined performance requirements. For performance analysis purposes, the digital design may be represented as a timing graph consisting of nodes and edges. Nodes typically represent pins of circuits comprising the digital design, and edges represent connections between pins, either from source to sink of a wire or from input to output of a logic gate. Each edge has an associated delay (or in some cases a minimum and maximum delay), and a path through the design is a chain of connected nodes and edges from an input of the design to an output of the design. The delay of each edge re...

Claims


Application Information

Patent Timeline
Patent Type & Authority Applications(United States)
IPC IPC(8): H04J3/06H04L12/24
CPCH04L41/14H04L43/16H04L43/0852
Inventor HATHAWAY, DAVID J.KALAFALA, KERIM
Owner GLOBALFOUNDRIES INC
Why Eureka
Try Eureka