Method for discovery and troubleshooting of network application usage and performance issues

a network application and performance problem technology, applied in the field of network application performance monitoring, can solve the problems of inconvenient and time-consuming network monitoring, inconvenient discovery of network application usage and performance issues, and inability to identify the source of problems, etc., and achieve the effect of little or no assistance from traditional network monitoring methods

Active Publication Date: 2006-04-06
RIVERBED TECH LLC
View PDF7 Cites 55 Cited by
  • Summary
  • Abstract
  • Description
  • Claims
  • Application Information

AI Technical Summary

Benefits of technology

[0007] The present invention provides for extracting, during monitoring of network traffic made up of Internet protocol (IP) packets, network application monitoring metrics; aggregating the metrics into logical group types; and analyzing logically grouped and aggregated metrics by identifying group sets of the logical group types, correlating anomalous conditions across the logically grouped and aggregated metrics, and isolating the anomalous conditions to one or more related members of the logical group types. The metrics may include one or more of usage metrics, network performance metrics and application performance metrics.
[0008] Usage metrics may include: Goodput, Payload, Throughput and Transaction Throughput. Network performance metrics may include: Packet Loss, Retransmission Delay, Retransmission Rate and Round Trip Time. Application performance metrics may include: Application Response Rate, Application Response Time, Client Reset Rate, Connection Duration, Connection Established Rate, Connection Request Rate, Connection Setup Time, Connections Failed Rate, Data Transfer Time, Server Reset Rate and Time to First Byte.
[0009] In one embodiment, analyzing logically grouped and aggregated metrics may include displaying a graphical representation of metric information in response to user selection of a quick launch element of a graphical user interface. Isolating the anomalous conditions to one or more related members of the logical group types may be accomplished by decomposing metric information by respective related member, presenting metric information of related members for operator review, and revealing those related members contributing to identified anomalous conditions. Metric information may be decomposed by related members by establishing a hierarchical relationship between respective ones of the logical group types and its related members. This may involve establishing a relationship between a business group and users that are members or constituents of the business group.

Problems solved by technology

Today, information technology professionals often encounter a myriad of different problems and challenges during the operation of a computer network or network of networks.
For example, these individual must often cope with network device failures and / or software application errors brought about by such things as configuration errors or other causes.
Unfortunately for these individuals tracking down the sources of such problems can be tedious and difficult, in part because conventional technologies and methodologies for network troubleshooting tend to focus only on the network devices themselves, rather than on applications making use of the networks.
Because of such shortcomings, traditional network monitoring methods provide little or no assistance when it comes to evaluating how problems with network devices or applications actually impact a user's experience.
That is, the limited visibility offered by current network monitoring techniques, focused on a limited set of network-only metrics, translates into an inability for a troubleshooter to definitively resolve whether a poor user experience is due to problems in the network or in the network application.
Traditional network monitoring solutions group network traffic according to whether a network node is a “client” or a “server” but often fail to appreciate the dynamic nature of these labels.
That is, the traditional device-centric monitoring methods do not distinguish between, for example, a personal computer acting as a client for some applications and a server for others and so the results provided by those methods are less useful than they otherwise might be.
Moreover, these processes tend to be manually intensive and, hence, rapidly become unmanageable in the face of network reconfigurations and scaling.

Method used


Image

  • Method for discovery and troubleshooting of network application usage and performance issues
  • Method for discovery and troubleshooting of network application usage and performance issues
  • Method for discovery and troubleshooting of network application usage and performance issues

Examples


Embodiment Construction

[0015] Described herein is a method for discovery and troubleshooting of network application usage and performance issues. In the following description, for purposes of explanation, numerous specific details are set forth in order to provide a thorough understanding of the invention. However, it will be apparent to one with ordinary skill in the art that these specific details need not be used to practice the present invention. In other instances, well-known structures and devices are shown in block diagram form in order to avoid unnecessarily obscuring the present invention.

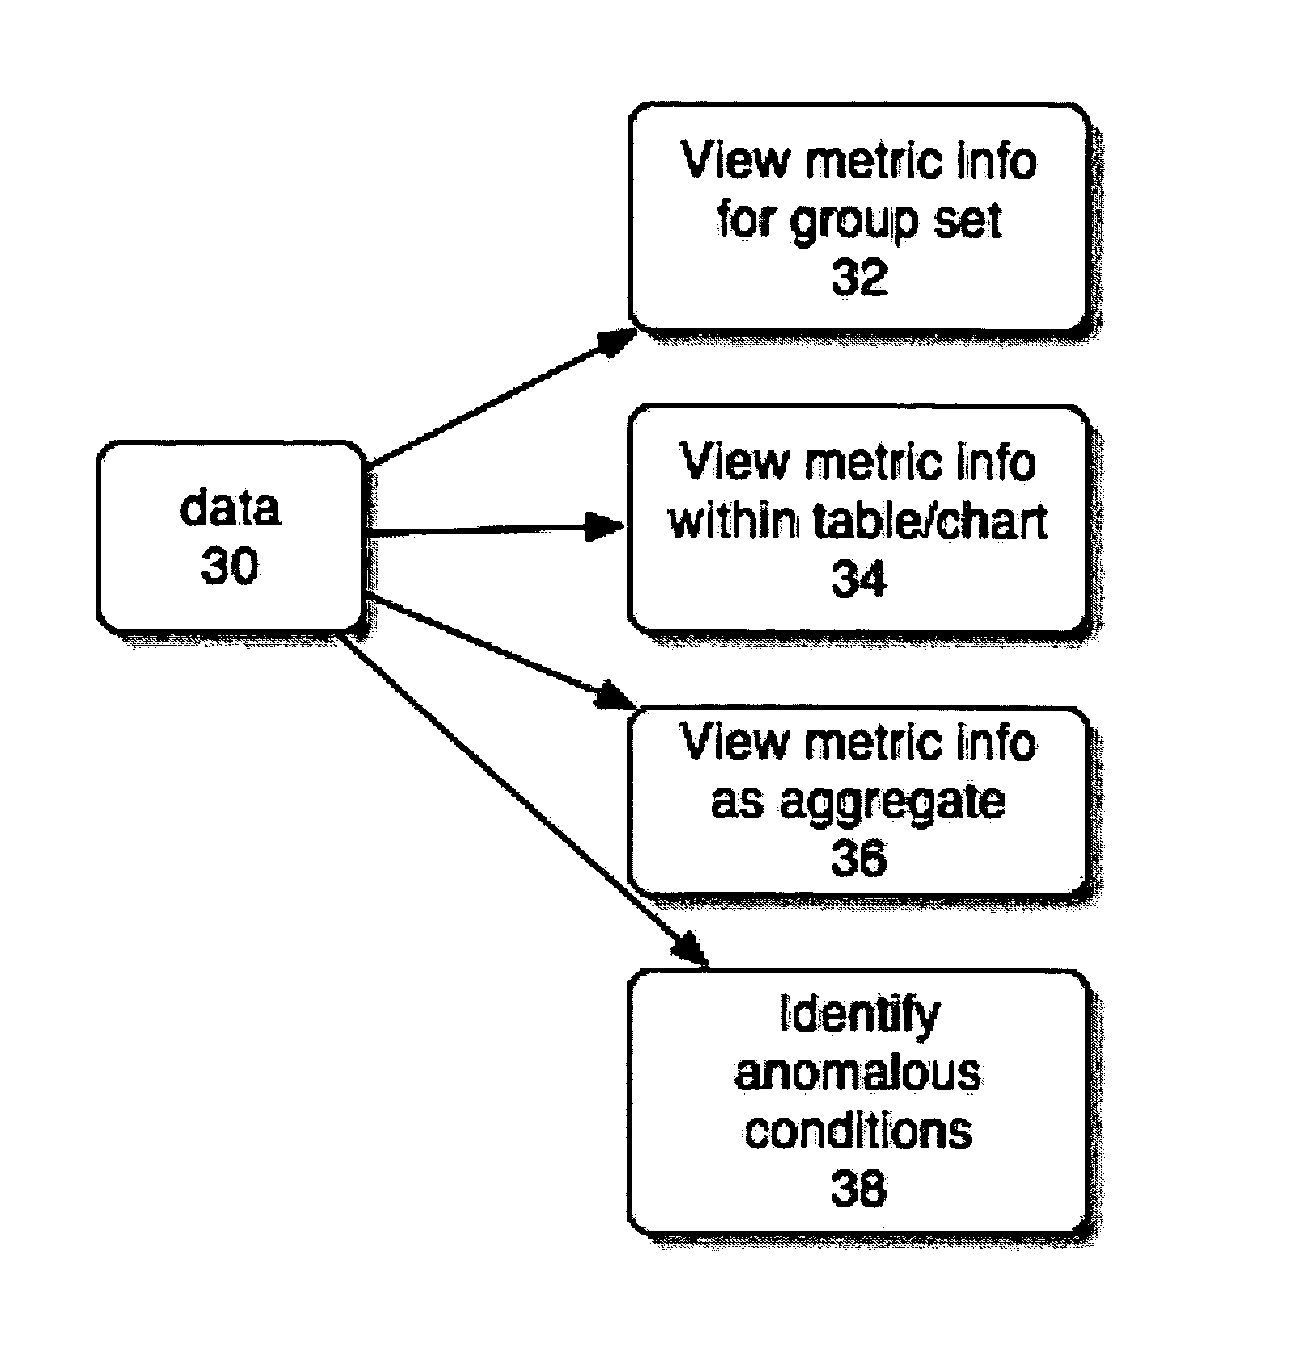
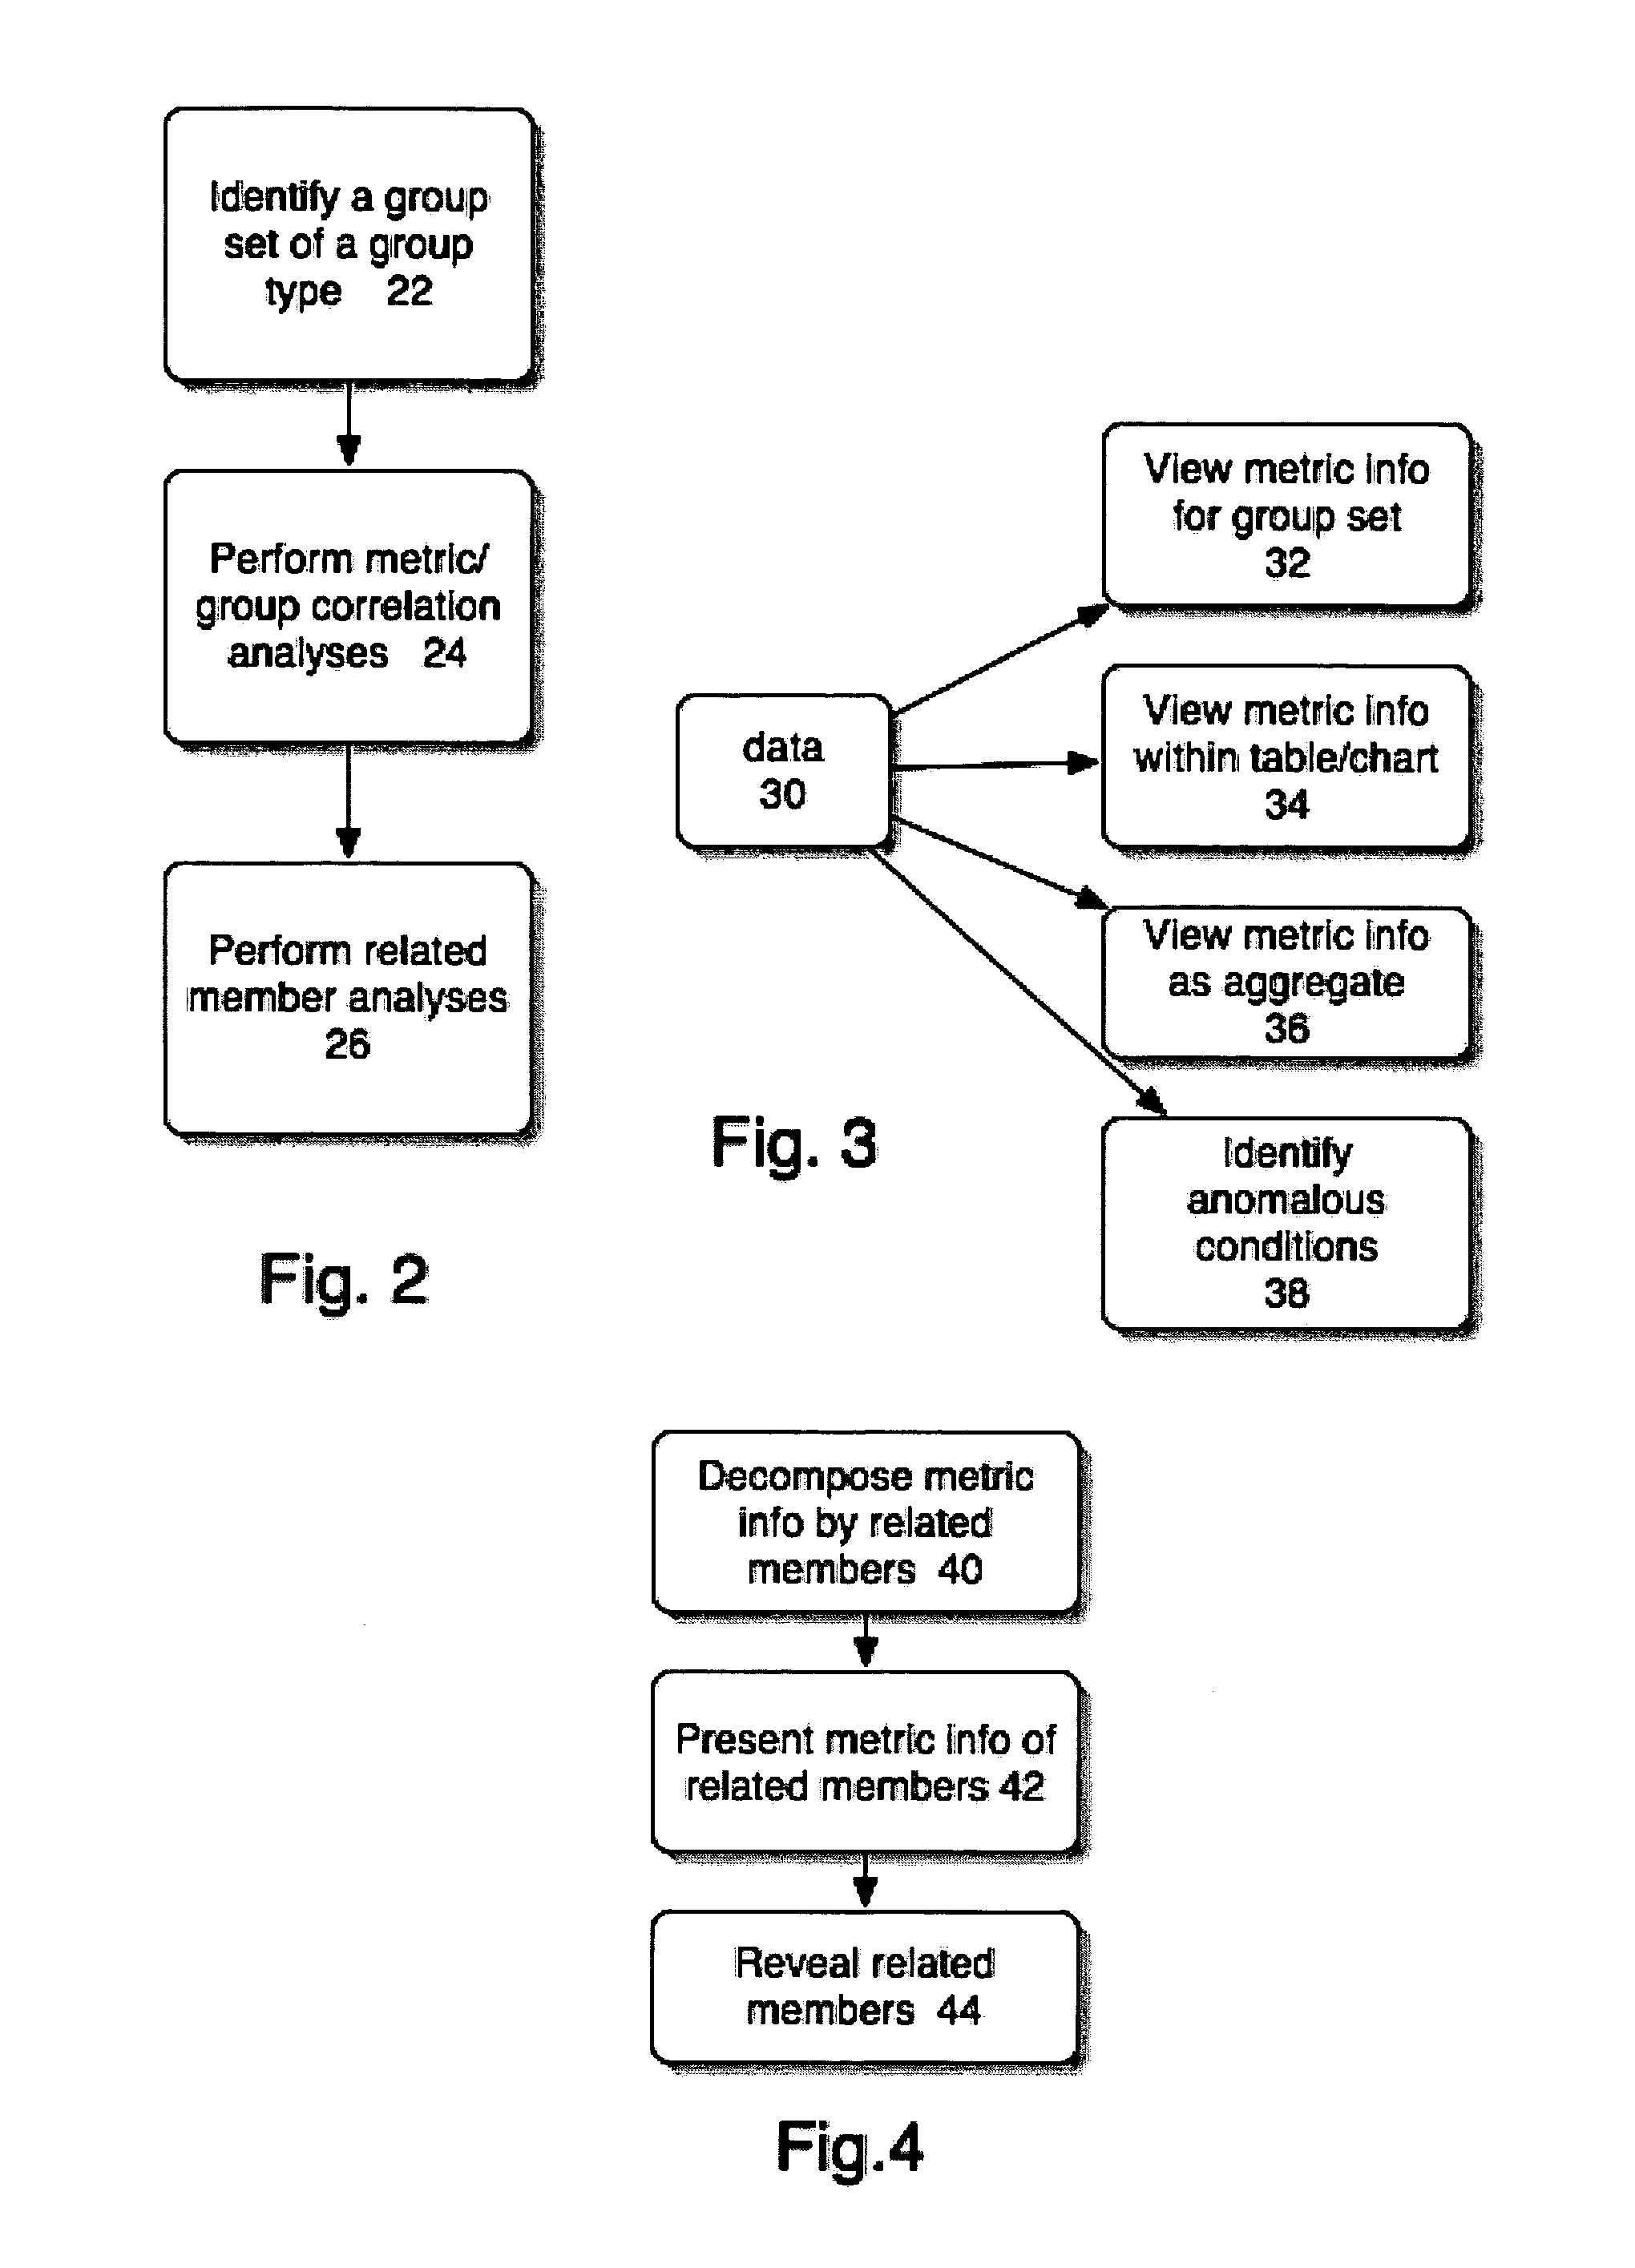
[0016] The present methods allow a user to detect problems and / or discover relevant information with respect to network application usage / performance and then isolate the problem / information to specific contributors (e.g., users, applications or network resources). As will be more fully discussed below, the present process involves, in one embodiment, grouping monitored performance metrics by type, identifying ...


PUM


Abstract

During monitoring of IP network traffic, network application monitoring metrics are extracted, aggregated into logical group types and subsequently analyzed by identifying group sets of the logical group types, correlating anomalous conditions across the logically grouped and aggregated metrics, and isolating the anomalous conditions to one or more related members of the logical group types. The metrics may include usage metrics, network performance metrics and application performance metrics.

Description

RELATED APPLICATIONS [0001] This application is a continuation-in-part of, claims the priority benefit of and incorporates by reference U.S. patent application Ser. No. 10 / 937,986, filed Sep. 10, 2004.FIELD OF THE INVENTION [0002] The invention relates to network application performance monitoring in general and, in particular, to a process for discovering and / or troubleshooting problems with such performance. BACKGROUND [0003] Today, information technology professionals often encounter a myriad of different problems and challenges during the operation of a computer network or network of networks. For example, these individual must often cope with network device failures and / or software application errors brought about by such things as configuration errors or other causes. Unfortunately for these individuals tracking down the sources of such problems can be tedious and difficult, in part because conventional technologies and methodologies for network troubleshooting tend to focus o...

Claims


Application Information

Patent Timeline
Patent Type & Authority Applications(United States)
IPC IPC(8): G06F15/173
CPCH04L63/1408H04L63/14
Inventor WEN, HANZIOULAS, GEORGEGUARINI, STEPHENAHMED, MASOODSEILNACHT, ERIK
Owner RIVERBED TECH LLC
Why Eureka
Try Eureka