System and method for monitoring and analyzing data trends of interest within an organization

a technology of data trends and systems, applied in the field of systems and methods for monitoring and analyzing data trends and patterns of interest within an organization, can solve the problems that the acquisition and formatting of this data would take several hours or days, and achieve the effect of maximizing the value of the data and facilitating the identification of anomalous data

Inactive Publication Date: 2006-05-18
SANTOS SUSAN R +2
View PDF5 Cites 5 Cited by
  • Summary
  • Abstract
  • Description
  • Claims
  • Application Information

AI Technical Summary

Benefits of technology

[0014] The system and method of the present invention provide unique features that overcome many of the problems experienced in the art of identifying, monitoring, and analyzing various trends and patterns of interest within an organization in order to maximize valued aspects thereof, including, for example, productivity, efficiency, and employee health and safety. More specifically, the present invention utilizes a centralized data repository to accessibly store and maintain data; date gap analysis to avoid aggregation on calender or other artificial boundaries; control chart analysis to allow for easy understanding of the data; workload adjustments to avoid false indicators; tabular and graphical data displays which facilitates identifying anomalous data and monitoring for data quality; and a drill down mechanism for investigating trends and anomalous data points in detail.
[0016] After performing date gap analysis, the control chart analysis is performed and the results thereof displayed in tabular or graphical form. The graphical format represents the date gap between successive events plotted in temporal sequence, which allows for quick visual identification of slow and gradual trends as well as rapid changes in the frequencies of events. The graphical format also includes control limits computed based upon the variability of the date gaps, which allow the user to easily separate special causes of variation (“signals”) from common cause of variation (i.e., random noise). Data quality checking is provided in the form of control limits representing variation beyond that expected from common causes. When a data gap exceeds the upper control limit, a reporting irregularity may be indicated and should be investigated.

Problems solved by technology

In the prior art, acquiring and formatting this data would take several hours or days to complete.

Method used


Image

  • System and method for monitoring and analyzing data trends of interest within an organization
  • System and method for monitoring and analyzing data trends of interest within an organization
  • System and method for monitoring and analyzing data trends of interest within an organization

Examples


Embodiment Construction

, below.

BRIEF DESCRIPTION OF THE DRAWING FIGURES

[0019] A preferred embodiment of the present invention is described in detail below with reference to the attached drawing figures, wherein:

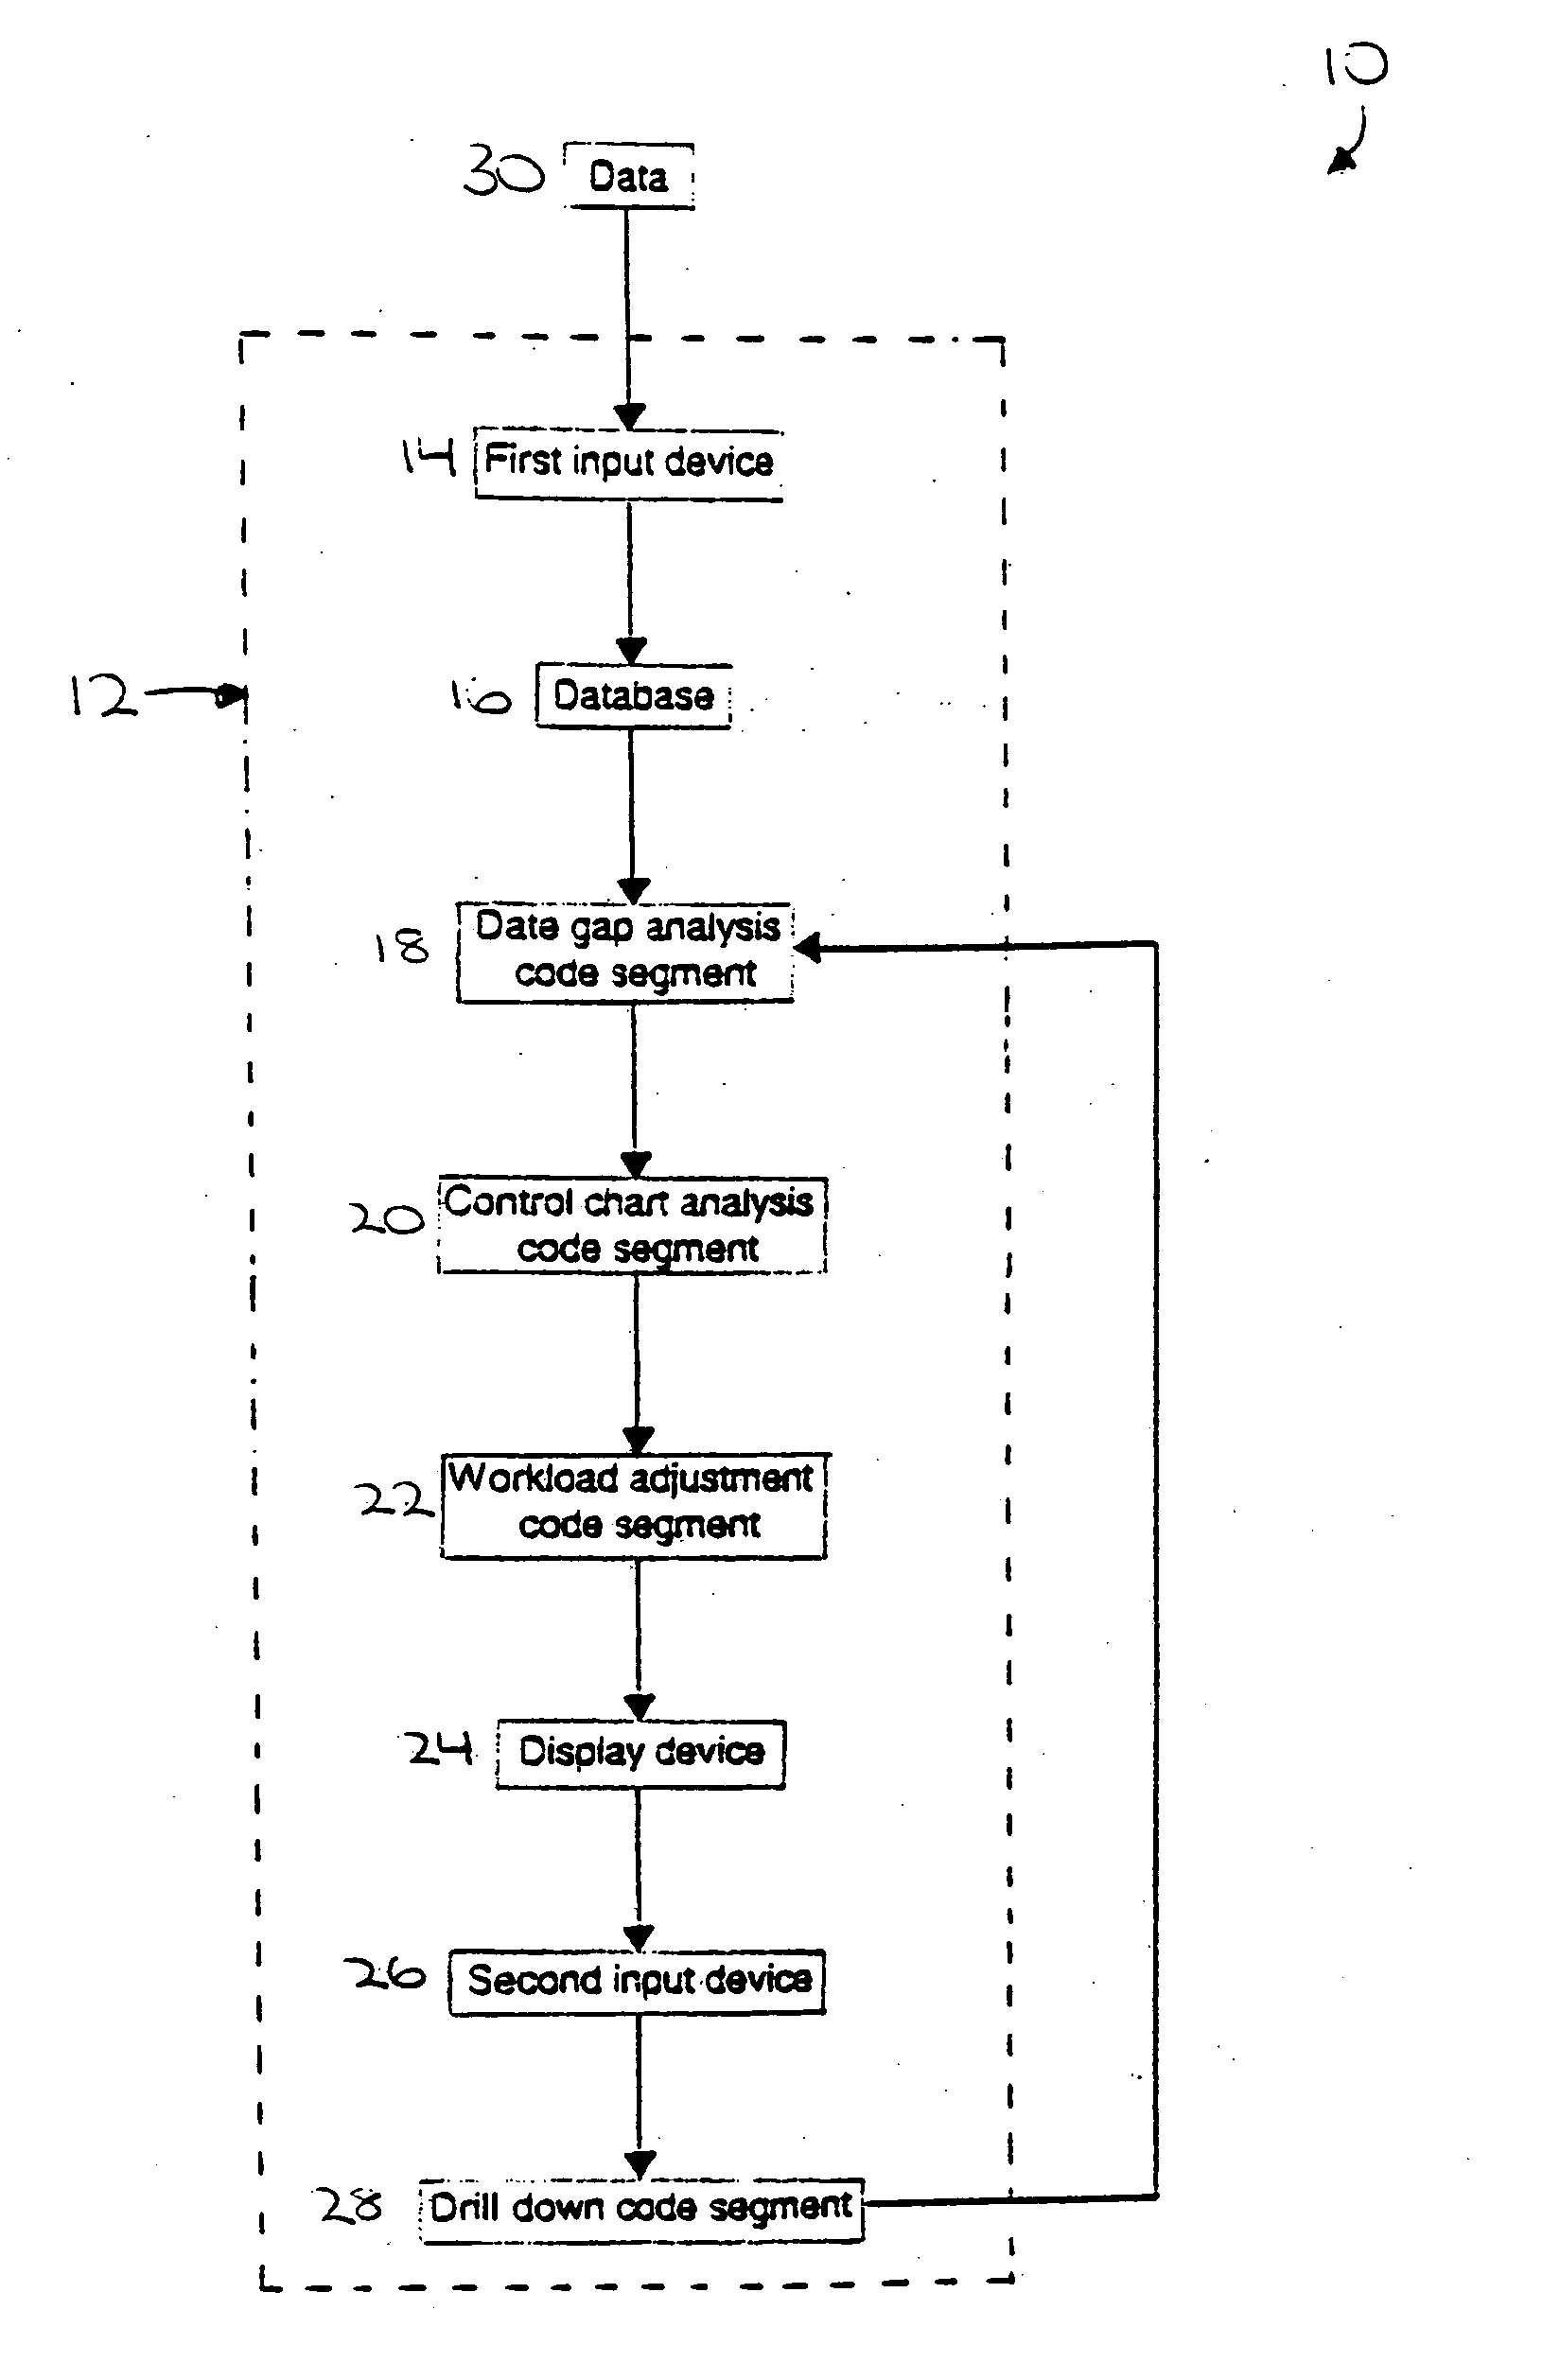
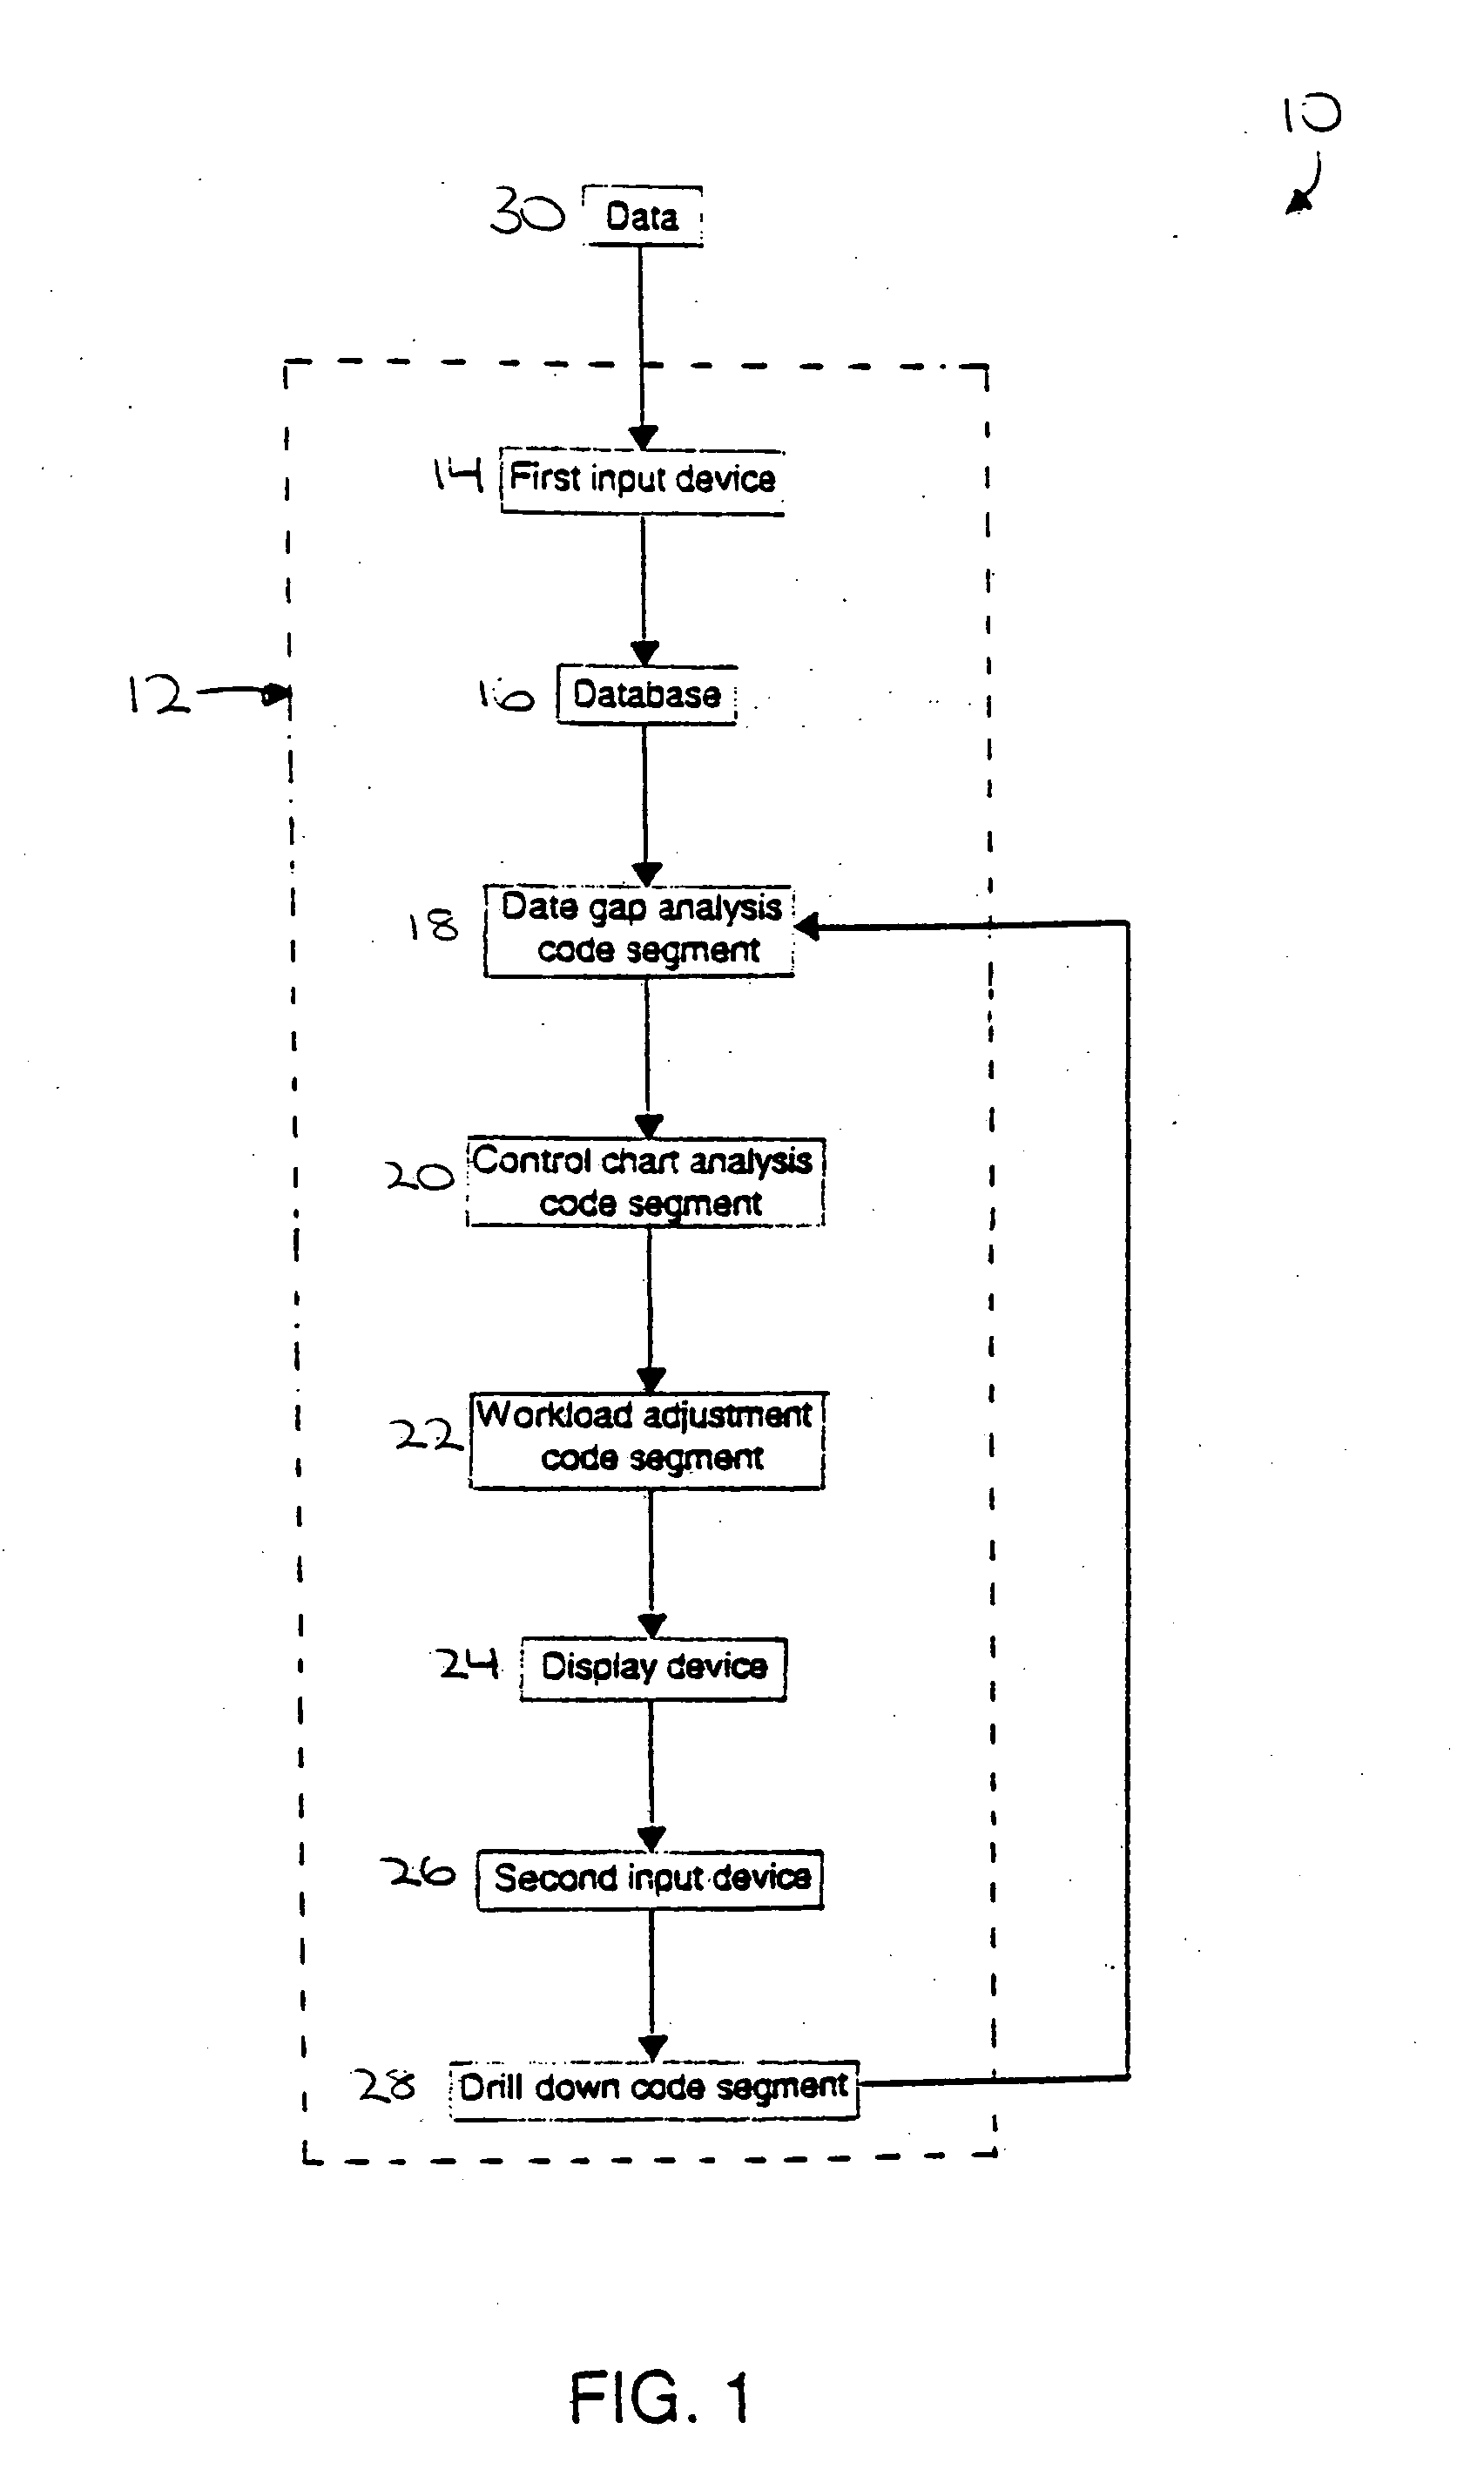
[0020]FIG. 1 is a block diagram of computer hardware and code segments which may be used to implement a preferred embodiment of the present invention.

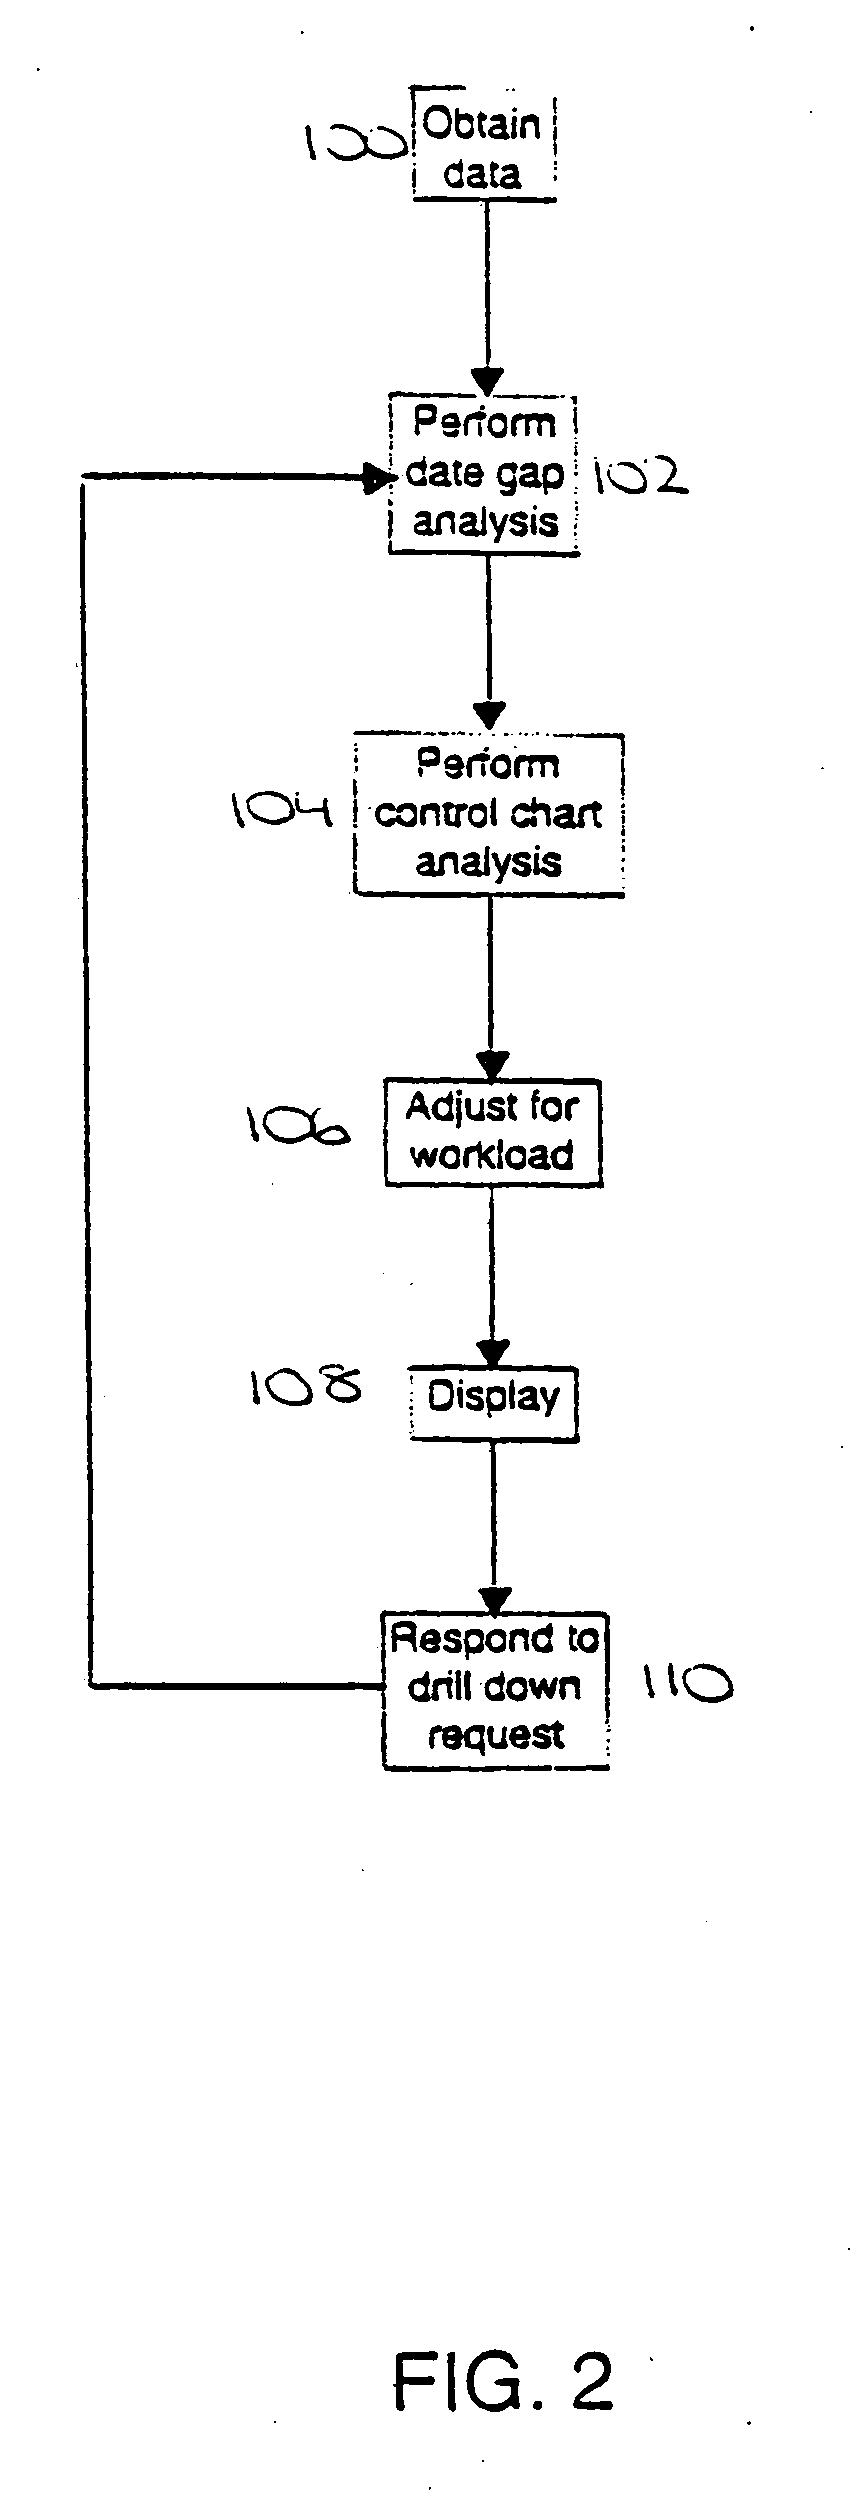
[0021]FIG. 2 is a flow diagram broadly depicting the steps of a preferred embodiment of the method of the present invention.

[0022]FIG. 3 is a conventional X-bar control chart showing a range of plotted data moving about a centerline and bounded, for the most part by, control limits.

[0023]FIG. 4 is control chart resulting from a preferred embodiment of the present invention.

DETAILED DESCRIPTION OF A PREFERRED EMBODIMENT

[0024]FIG. 1 illustrates a preferred embodiment of a computer-based system 10 for monitoring and analyzing workplace illnesses and injuries. Though described and illustrated in terms of this specific application, the present inven...


PUM


Abstract

A system and method for identifying, monitoring, and analyzing various trends and patterns of interest within an organization in order to maximize aspects thereof, including, for example, productivity, efficiency, and employee health and safety. The invention utilizes a centralized data repository to accessibly store and maintain data; date gap analysis to avoid aggregation on calender or other artificial boundaries; control chart analysis to allow for easy understanding of the data; workload adjustments to avoid false indicators; tabular and graphical data displays which facilitates identifying anomalous data and monitoring for data quality; and a drill down mechanism for investigating trends and anomalous data points in detail. Analysis may be performed on various normalized data sets and the results simultaneously displayed to allow comparison and easier identification of interrelated variables and, thereby, of cause and effect. The effectiveness of remedies and intervention schemes may also be monitored and analyzed.

Description

RELATED APPLICATIONS [0001] The present application is a divisional patent application of earlier-filed U.S. nonprovisional patent applications titled “A SYSTEM AND METHOD FOR MONITORING AND ANALYZING DATA TRENDS OF INTEREST WITHIN AN ORGANIZATION”, Ser. No. 09 / 751,858, filed Dec. 29, 2000. The present application claims priority benefit of the earlier-filed application, and the identified earlier-filed application is hereby incorporated by reference into the present application.BACKGROUND OF THE INVENTION [0002] 1. Field of the Invention [0003] The present invention relates to systems and methods for monitoring and analyzing trends and patterns of interest within an organization. More particularly, the present invention relates to a computer-based surveillance and analysis tool for identifying, monitoring, and analyzing trends and patterns of interest within an organization, and having features allowing for more detailed investigation and analysis of specific data or ranges of data...

Claims


Application Information

Patent Timeline
Patent Type & Authority Applications(United States)
IPC IPC(8): G06F17/50G06Q10/06G06Q10/10G06Q20/10G06Q30/02
CPCG06Q10/063G06Q10/10G06Q20/108G06Q30/0201
Inventor SANTOS, SUSAN R.SIMON, STEPHEN D.COX, KAREN
Owner SANTOS SUSAN R
Why Eureka
Try Eureka