Method and apparatus for selecting, analyzing, and visualizing related database records as a network

a database and network technology, applied in the field of data mining and analysis, can solve the problems of information overload, unsubstantial improvement of human mental capacity to asimilate and comprehend information, and unfavorable new arrivals

Active Publication Date: 2006-05-18
BOSTON CONSULTING GROUP
View PDF31 Cites 470 Cited by
  • Summary
  • Abstract
  • Description
  • Claims
  • Application Information

AI Technical Summary

Benefits of technology

[0095] The method may further include iteratively executing the identifying and connecting steps while modifying the one or more descriptive criteria, so as to change the selected two or more database records. The one or more descriptive criteria may include for example a range of dates.
[0096] The method may further include selecting additional database records from a record class other than the common record class of patent records, and associating network nodes, network links, or both, to instances of one or more attributes from the additional database records. The other record class may describe for example licensing history associated with the patent records, litigation history associated with the patent records or maintenance fee history associated with the patent records.
[0097] In another aspect, a method of providing a network graphical representation of two or more database record includes selecting the two or more database records according to one or more descriptive criteria. The method further includes identifying two or more common attributes of the database records, and associating network nodes to instances of a first one of the common attributes from the database records. The method also includes connecting the network nodes with network links that designate network nodes having common instances of one of the two or more common attributes, so as to form a first network graphical representation. The method further includes transforming the first network graphical representation into a second network graphical representation by associating the network nodes to instances of a second one of the common attributes from the database records, and connecting the network nodes with network links that designate network nodes having common instances of the second attribute.
[0098] In another aspect, a method of providing a network graphical representation of two or more database records includes selecting the two or more database records according to one or more descriptive criteria. The method further includes identifying two or more common attributes of the database records, associating a first set of network nodes to instances of a first one of the common attributes from the database records, and associating a second set of network nodes to instances of a second one of the common attributes from the database records. The method also includes connecting one or more members of the first set of network nodes to one or more members of the second set of network nodes with network links that designate associations between the network nodes, so as to form a first network graphical representation.
[0099] In another aspect, a method of providing a network graphical representation of two or more database records includes selecting the two or more database records according to one or more descriptive criteria. The method further includes identifying two or more common attributes of the database records, associating a first set of network nodes to instances of a first one of the common attributes from the database records, and associating a second set of network nodes to instances of a second one of the common attributes from the database records. The method also includes containing the second set of network nodes presented in a network configuration, within one or more of the first set of network nodes presented in a network configuration. Each of the second set of network nodes shares a common attribute instance with the network nodes of the first attribute within which the second set of network nodes is contained. The method may further includes associating a third set of network nodes with a third one of the common attributes of the database records, containing the third set of network nodes presented in a network configuration, within one or more of the second set of network nodes presented in a network configuration. Each of the third set of network nodes shares a common attribute instance with the network node of the second attribute within which the third set of network nodes is contained. The method may further include associating one or more additional sets of network nodes with other ones of the common attributes from the database records, and grouping one or more members of the additional sets of network nodes within other network nodes, such that each group of network node members is characterized by the attribute associated with the grouping network node.
[0100] In another aspect, a Network Visualization System includes a computer readable medium with stored instructions adapted for providing a network graphical representation of two or more database records. The stored instructions implement the steps of the one or more methods described herein.

Problems solved by technology

Regardless of the reliability of these estimates, they all point to undeniable explosion in new information.
Despite the rapid growth of available information, human mental capabilities to assimilate and comprehend information have not significantly improved.
The explosion of available information and our inability to assimilate it leads to information overload.
The vast stores of information make it increasingly difficult to find the right information and even more difficult to make sense of the vast amount of new knowledge that is available.
Workers in the knowledge economy operate in an environment in which they are awash in information but are unable to distill insights.
However, despite the availability of information that could inform and improve their decision-making, there is no practical way to find or assimilate it.
Statistical analysis can provide some useful insight into the set of documents under evaluation, but is clearly limited as to the amount of insight that can be obtained.
They do not provide information about how the various documents are related to each other, and they do not provide a means for interacting with the metadata in a way that allows the user to explore what the various attributes of the documents reveal about the overall document set.
The value of the best known clustering tools is limited in two important ways.
First, the metadata provided about the contents of the document set is only as good as the taxonomy into which it is clustered.
This is an inherent limitation of both fixed and dynamic taxonomy clustering techniques.
Fixed taxonomies are limited in their usefulness by a number of factors: The taxonomy is based on the priorities of its creator, not the searcher.
Often, the priorities of the taxonomer are not aligned with the needs of the information user, thus limiting the value of the clustering metadata provided.
Fixed taxonomies can not easily be adjusted as the contents of the database evolve.
Once a taxonomy has been established and users have begun using it, it becomes rigid and difficult to change.
This makes it difficult to compare results over time.
This makes the presentation of clustering metadata problematic when based on a fixed taxonomy.
Another issue related to fixed taxonomies is that the documents in the data set typically do not fall into a single classification.
This creates a classification problem that has typically been solved by assigning the documents into multiple categories within the taxonomy.
This multiple-assignment creates a challenge for how to display the clustered results when many documents fall into multiple categories.
Both solutions have problems.
The other major limitation of fixed taxonomies is the difficulty in assigning documents to the categories.
Once again, both options have problems.
Author classification suffers from a lack of consistency, while centralized classification is extraordinarily time consuming when large numbers of documents must be classified.
However, they have limitations of their own which diminish their usefulness in providing metadata about a large document set.
The problem with this is that all languages are extremely imprecise when it comes to expressing ideas.
A second linguistic issue associated with semantic clustering is multiple languages.
Semantic clustering tools completely fail when documents of different languages are included in the data set.
As the trend toward globalization continues, this problem will continue to increase in importance.
Some attempts have been made to use multilingual thesauri to allow linguistic comparison of multilingual document sets, but this research is still in its infancy.
A final limitation of dynamic taxonomies is the lack of comparability between clusters from one document set or search result and another.
Dynamic taxonomies also suffer from the multiple classification problem described above.
The second limitation of the clustering technique is that any taxonomy only describes the document set or search result in relation to a single attribute.
While this information is useful, there is no system known by the inventors that allows users to simultaneously make use of clustering information as well as the variety of other available sources of metadata that describes the document set or search result.
Each of these leading examples of hierarchical data visualization is based on latent semantic information contained within the documents and as such, suffers from the limitations of semantic analysis as described above in the section describing fixed and dynamic taxonomies.
While quite useful in developing a general understanding of the information contained in a large dataset, the spatial visualization tools known to the inventors base their visualization solely on latent semantic information contained within the documents and as such, suffer from the limitations of semantic analysis as described above in the section describing dynamic taxonomies.
In recent years, various scientific and academic researchers have come to the realization that reductionist analysis, (e.g. analysis that focuses on breaking a problem down into its component parts and thoroughly analyzing each component) is limited.
Some of the inherent limitations of these prior art systems include the following: Database records from any data source can not be visualized because they do not contain node and link information that is usable by the system.
There is no way to specify particularly useful node and link definitions to be used repeatedly with data from a particular source.

Method used


Image

  • Method and apparatus for selecting, analyzing, and visualizing related database records as a network
  • Method and apparatus for selecting, analyzing, and visualizing related database records as a network
  • Method and apparatus for selecting, analyzing, and visualizing related database records as a network

Examples


example 1

Method and Apparatus for Making Sense of the Patent Database

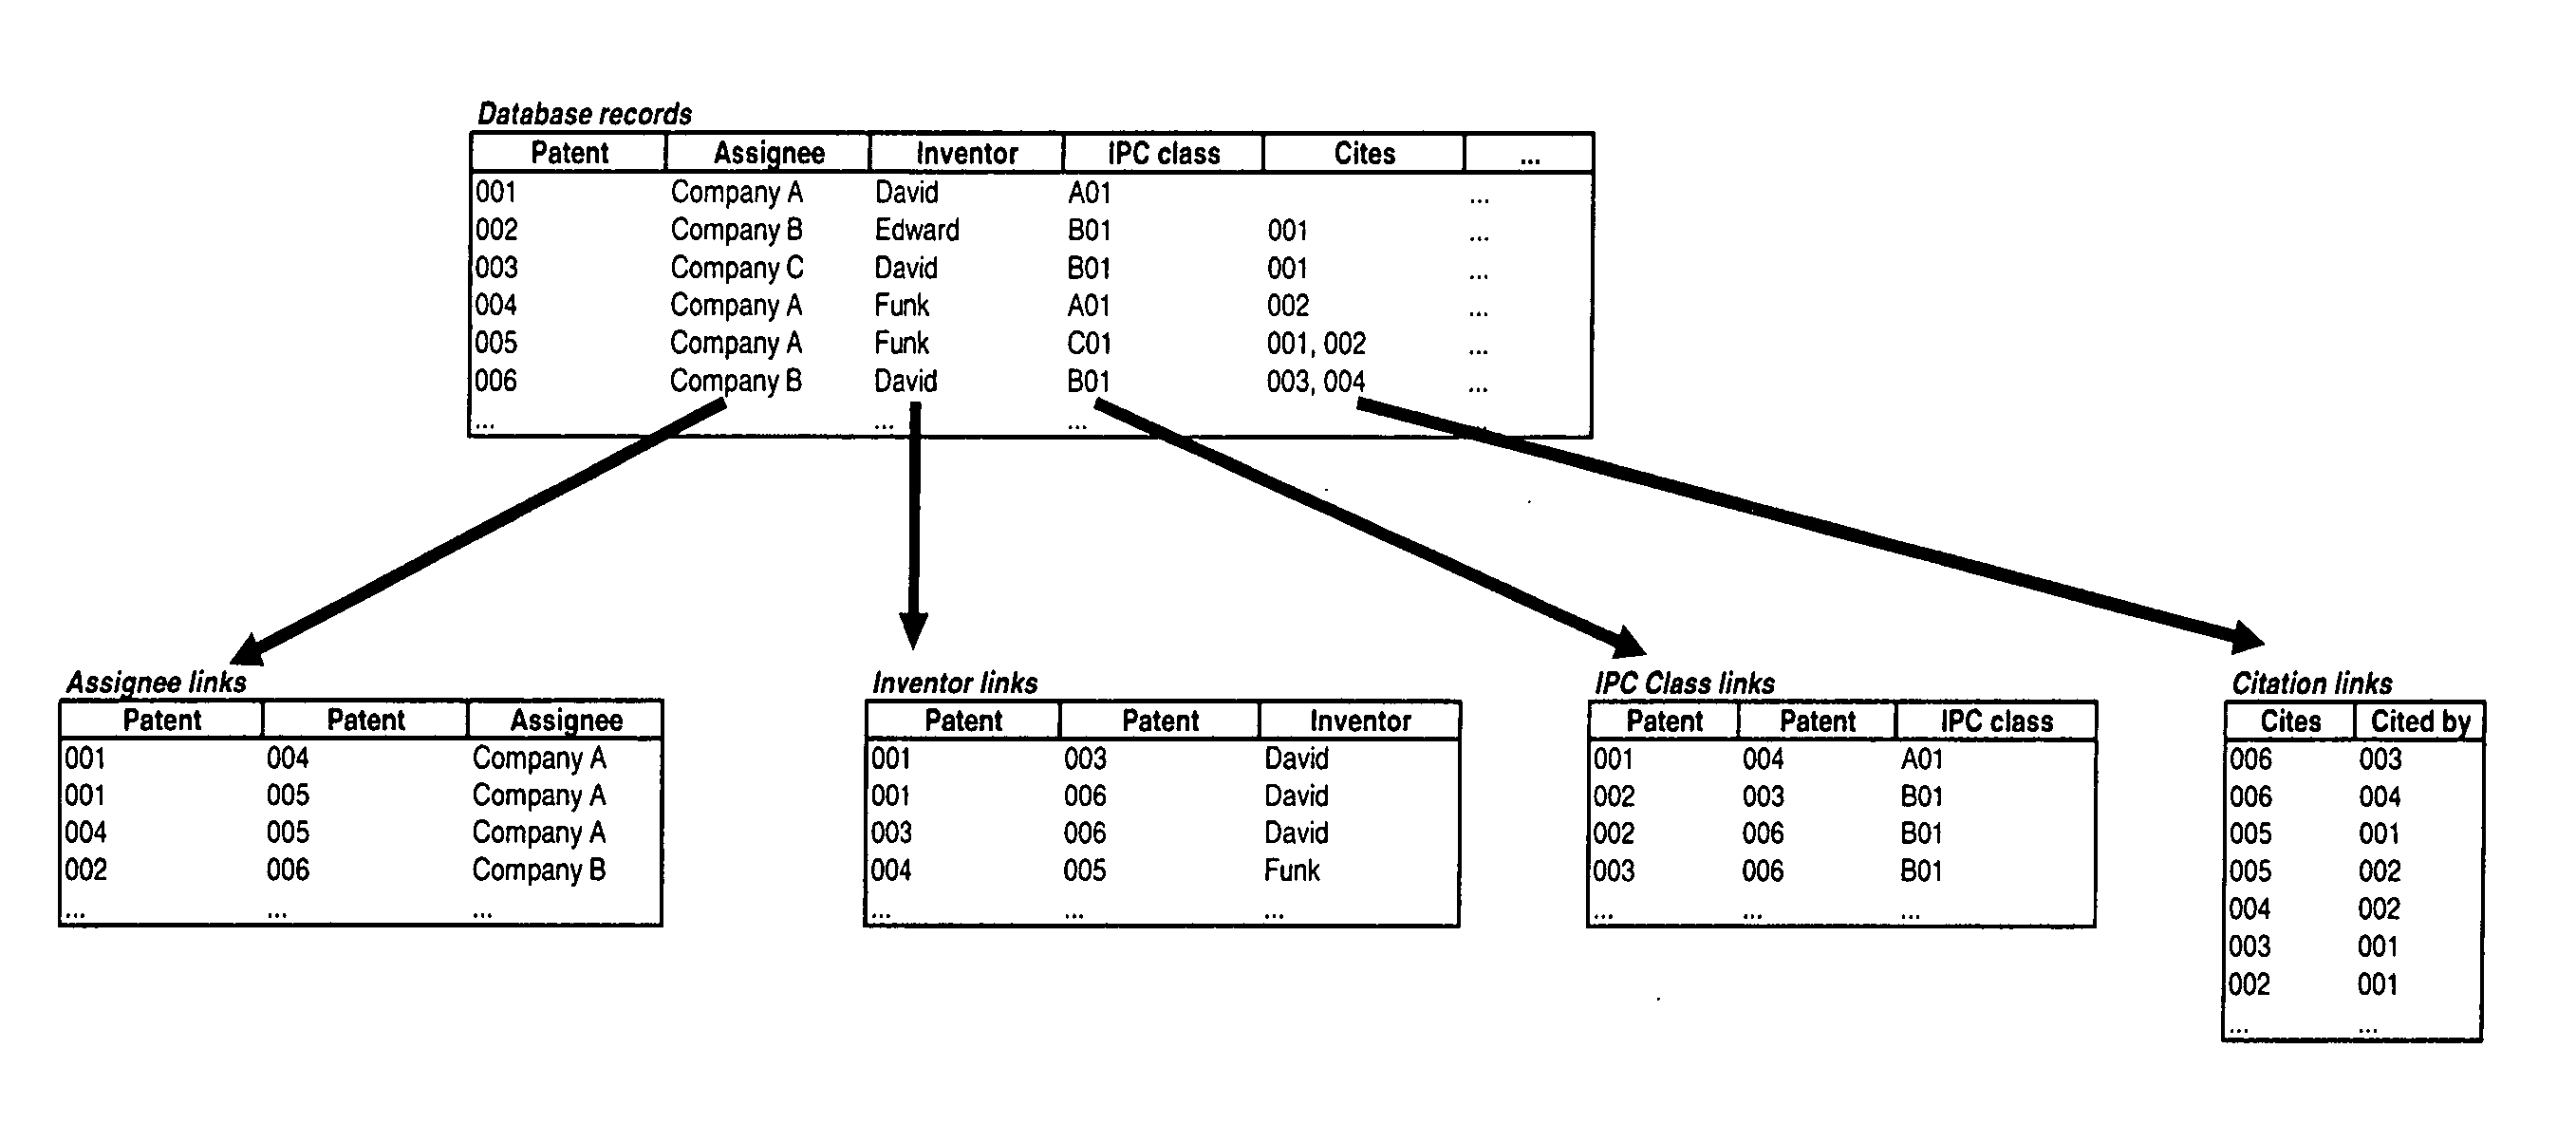
[0244] One or more embodiments of the invention relate to an improved method for making sense of patents in a patent database. One attribute of the patent database is that it is easy to establish the relatedness of documents to each other based on their citation relationship. The following discussion on using citations as a basis for establishing relatedness among patents applies equally to all databases that have citations including but not limited to academic / scientific / medical literature as well as hyperlinks embedded in pages on the World Wide Web which can also be thought of as a type of citation.

[0245] Various embodiments of the present invention can be used to help a business person, engineer, scientist, attorney, patent examiner or other interested party, make sense out of a large set of patents. The challenge is to take a large set of patent documents and find ways to understand the technological developments the...

example 2

Method and Apparatus for Searching for and Analyzing Documents in a Medical Publication Database

[0350] In a second example, one or more embodiments of the invention are applied to searching for and analyzing documents in a database of academic literature. One example of such a database is the medical publication database known as the PubMed database. Application to other academic databases is also possible.

[0351] The PubMed database is a large database of medical research papers appearing in nearly 200 medical journals. It is a rich repository of information about the research domain in the world of medicine. The PubMed database is most frequently used by doctors or other medical professionals who are looking for information about a specific disease, treatment or other subject of medical interest. Their research invariably begins with a Boolean search for a keyword, author or journal after which they are presented with a list of papers matching their selected criteria. The researc...


PUM


Abstract

A method and apparatus for selecting and converting database records or sets of related documents into network data and presenting that data in a network visualization system that enables users to select among, and move between various network displays by selecting one or more attributes of the data to be represented as the nodes and links of the network.

Description

CROSS-REFERENCE TO RELATED APPLICATIONS [0001] This application claims the benefit of U.S. Provisional Patent Application Ser. No. 60 / 567,997 filed May 4, 2004, the entire contents of which is incorporated herein by reference.FIELD OF THE INVENTION [0002] The present application generally relates to the field of data mining and analysis. More particularly, it relates to methods and systems for presenting related database records in a network graphical representation. BACKGROUND [0003]“Information age” and “knowledge economy” are just two of the terms commonly used to describe the explosion of digital information that characterizes our era. Whatever you call it, there is no question that the volume of information that is created is growing at unprecedented rates. Numerous attempts have been made to quantify the rate of new knowledge development and have produced various estimates of its exponential growth. Various sources describe and attempt to quantify this information explosion. A...

Claims


Application Information

Patent Timeline
Patent Type & Authority Applications(United States)
IPC IPC(8): G06F7/00G06F17/30
CPCG06F17/30696G06F2216/11G06F16/338G06F16/3323G06F16/3328G06F17/40
Inventor ECKARDT, RALPH W. IIIWOLF, ROBERT G. JR.SHAPIRO, ALEXANDERRIVETTE, KEVIN G.BLAXILL, MARK F.
Owner BOSTON CONSULTING GROUP
Why Eureka
Try Eureka