
Spreadsheet user-interfaced business data visualization and publishing system

a business data and publishing system technology, applied in the field of business data visualization and publishing systems, can solve the problems of limited data visualization capabilities, high system cost, and inability to publish, and achieve the effects of improving communication and collaboration, improving strategic decisions, and enhancing visualization

Inactive Publication Date: 2006-05-25
MACNICA
View PDF6 Cites 456 Cited by
  • Summary
  • Abstract
  • Description
  • Claims
  • Application Information

AI Technical Summary

Benefits of technology

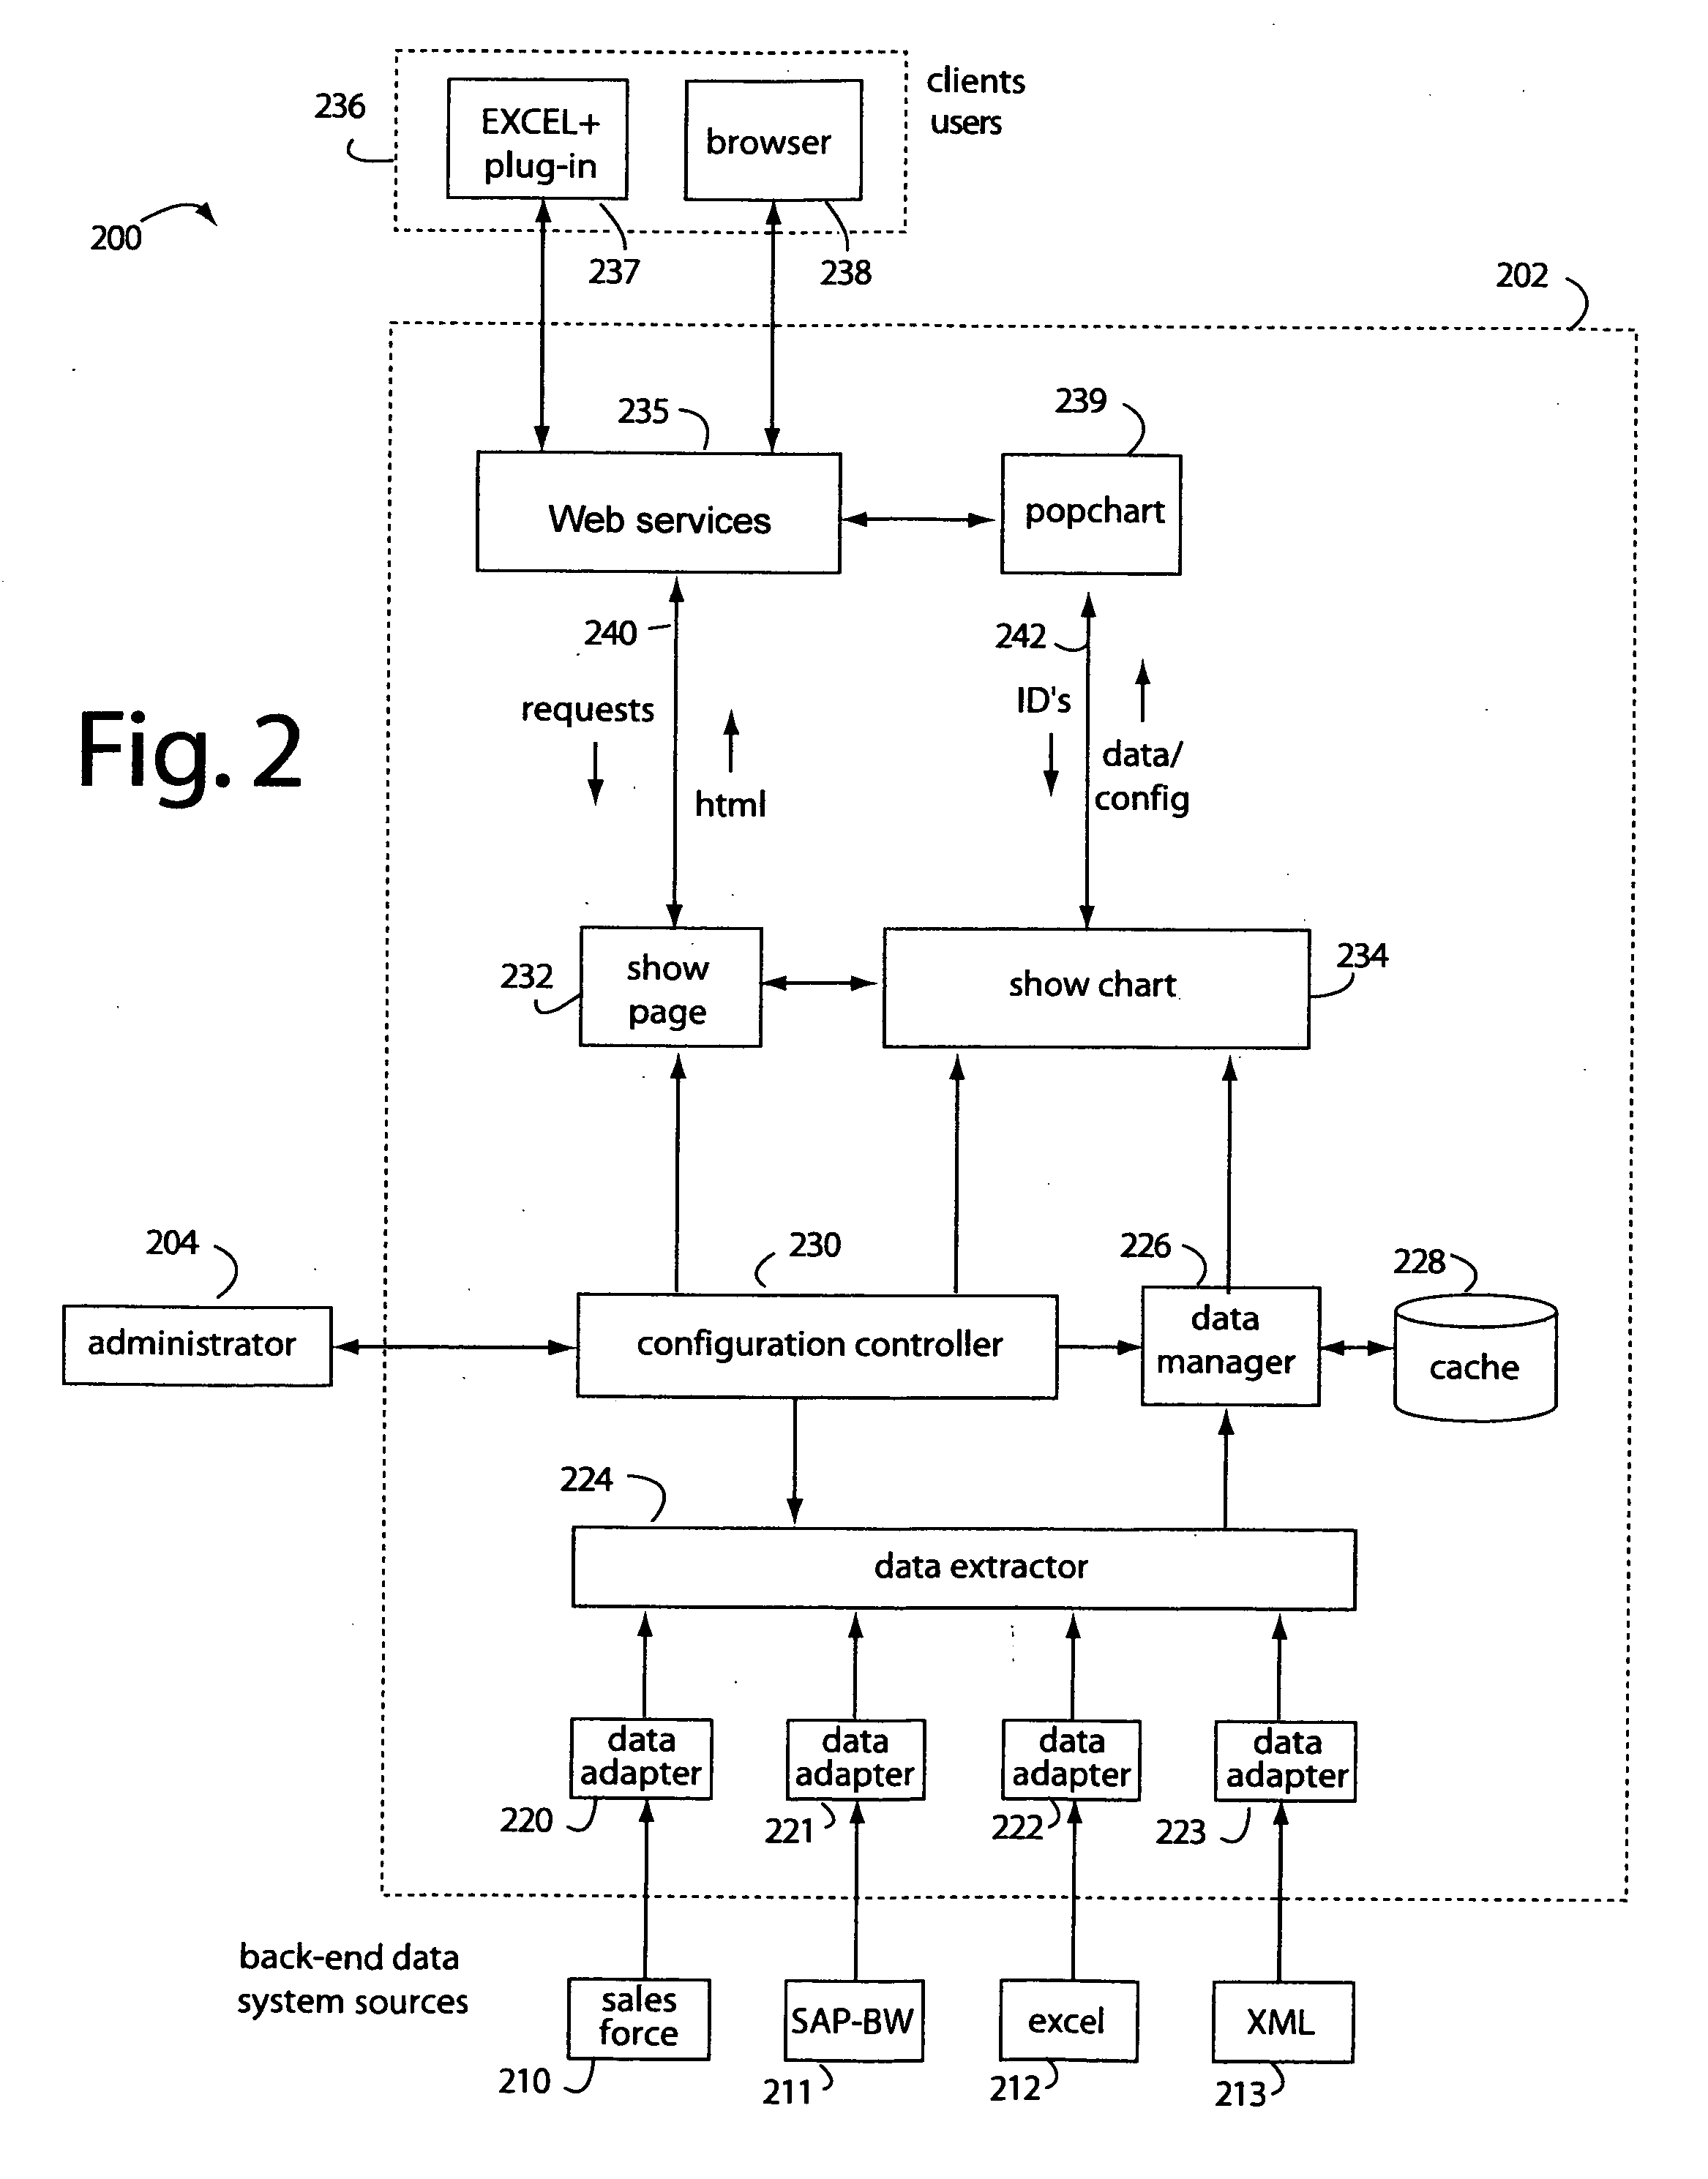
[0022] Briefly, a spreadsheet user-interfaced web-based business data publishing system embodiment of the present invention allows users to input and visualize field data and analytical results with interactive charts through a familiar MS-EXCEL UI. A plug-in module for EXCEL enables a background, web-services connection over the Internet to a management sub-system which extracts, transforms, and publishes data. ETL functionality is used to extract data from SAP BW, SAP Reports, SForce (SALESFORCE), SQL, XML, Excel, plain text files, and other diverse sources. A transformation engine provides sophisticated data transforms through a menu interface, without relying on programming or scripting. CORDA POPCHART™ is included to generate charts, graphs, and map graphics. Charts are customized using a WYSIWYG interface, and business dashboards are constructed through a simple drag-n-drop process. An account management system is included with access control to protect information security. The system is used for visualizing data managing reports, providing special tools to use SAP data, access Query Cubes in SAP BW, and standard and custom R / 3 reports. Once data has been extracted from SAP, it is transformed, merged with other data sources, and published as a dashboard or in a business portal. Its management and configuration functions are suited for enterprise reporting and sharing business data.
[0024] Another advantage of the present invention is that a familiar spreadsheet user interface is extended with a plug-in module to all a business system server on the Internet to help visualize data, publish it to the Web, and share it amongst other users.
[0025] An advantage of the present invention is that a system is provided that analyzes business data to improve strategic decisions.
[0028] A still further advantage of the present invention is that a system is provided that generates rich charts, graphs, and maps for enhanced visualization.
[0030] Another advantage of the present invention is that a system is provided to normalize, prepare, and convert data into a form suitable for visualization.

Problems solved by technology

It has limited capabilities to visualize data, publish it to the Web, and share it amongst users.
These systems tend to be expensive, and are intended to be used by highly skilled specialists and top-level managers.

Method used


Image

  • Spreadsheet user-interfaced business data visualization and publishing system
  • Spreadsheet user-interfaced business data visualization and publishing system
  • Spreadsheet user-interfaced business data visualization and publishing system

Examples


Embodiment Construction

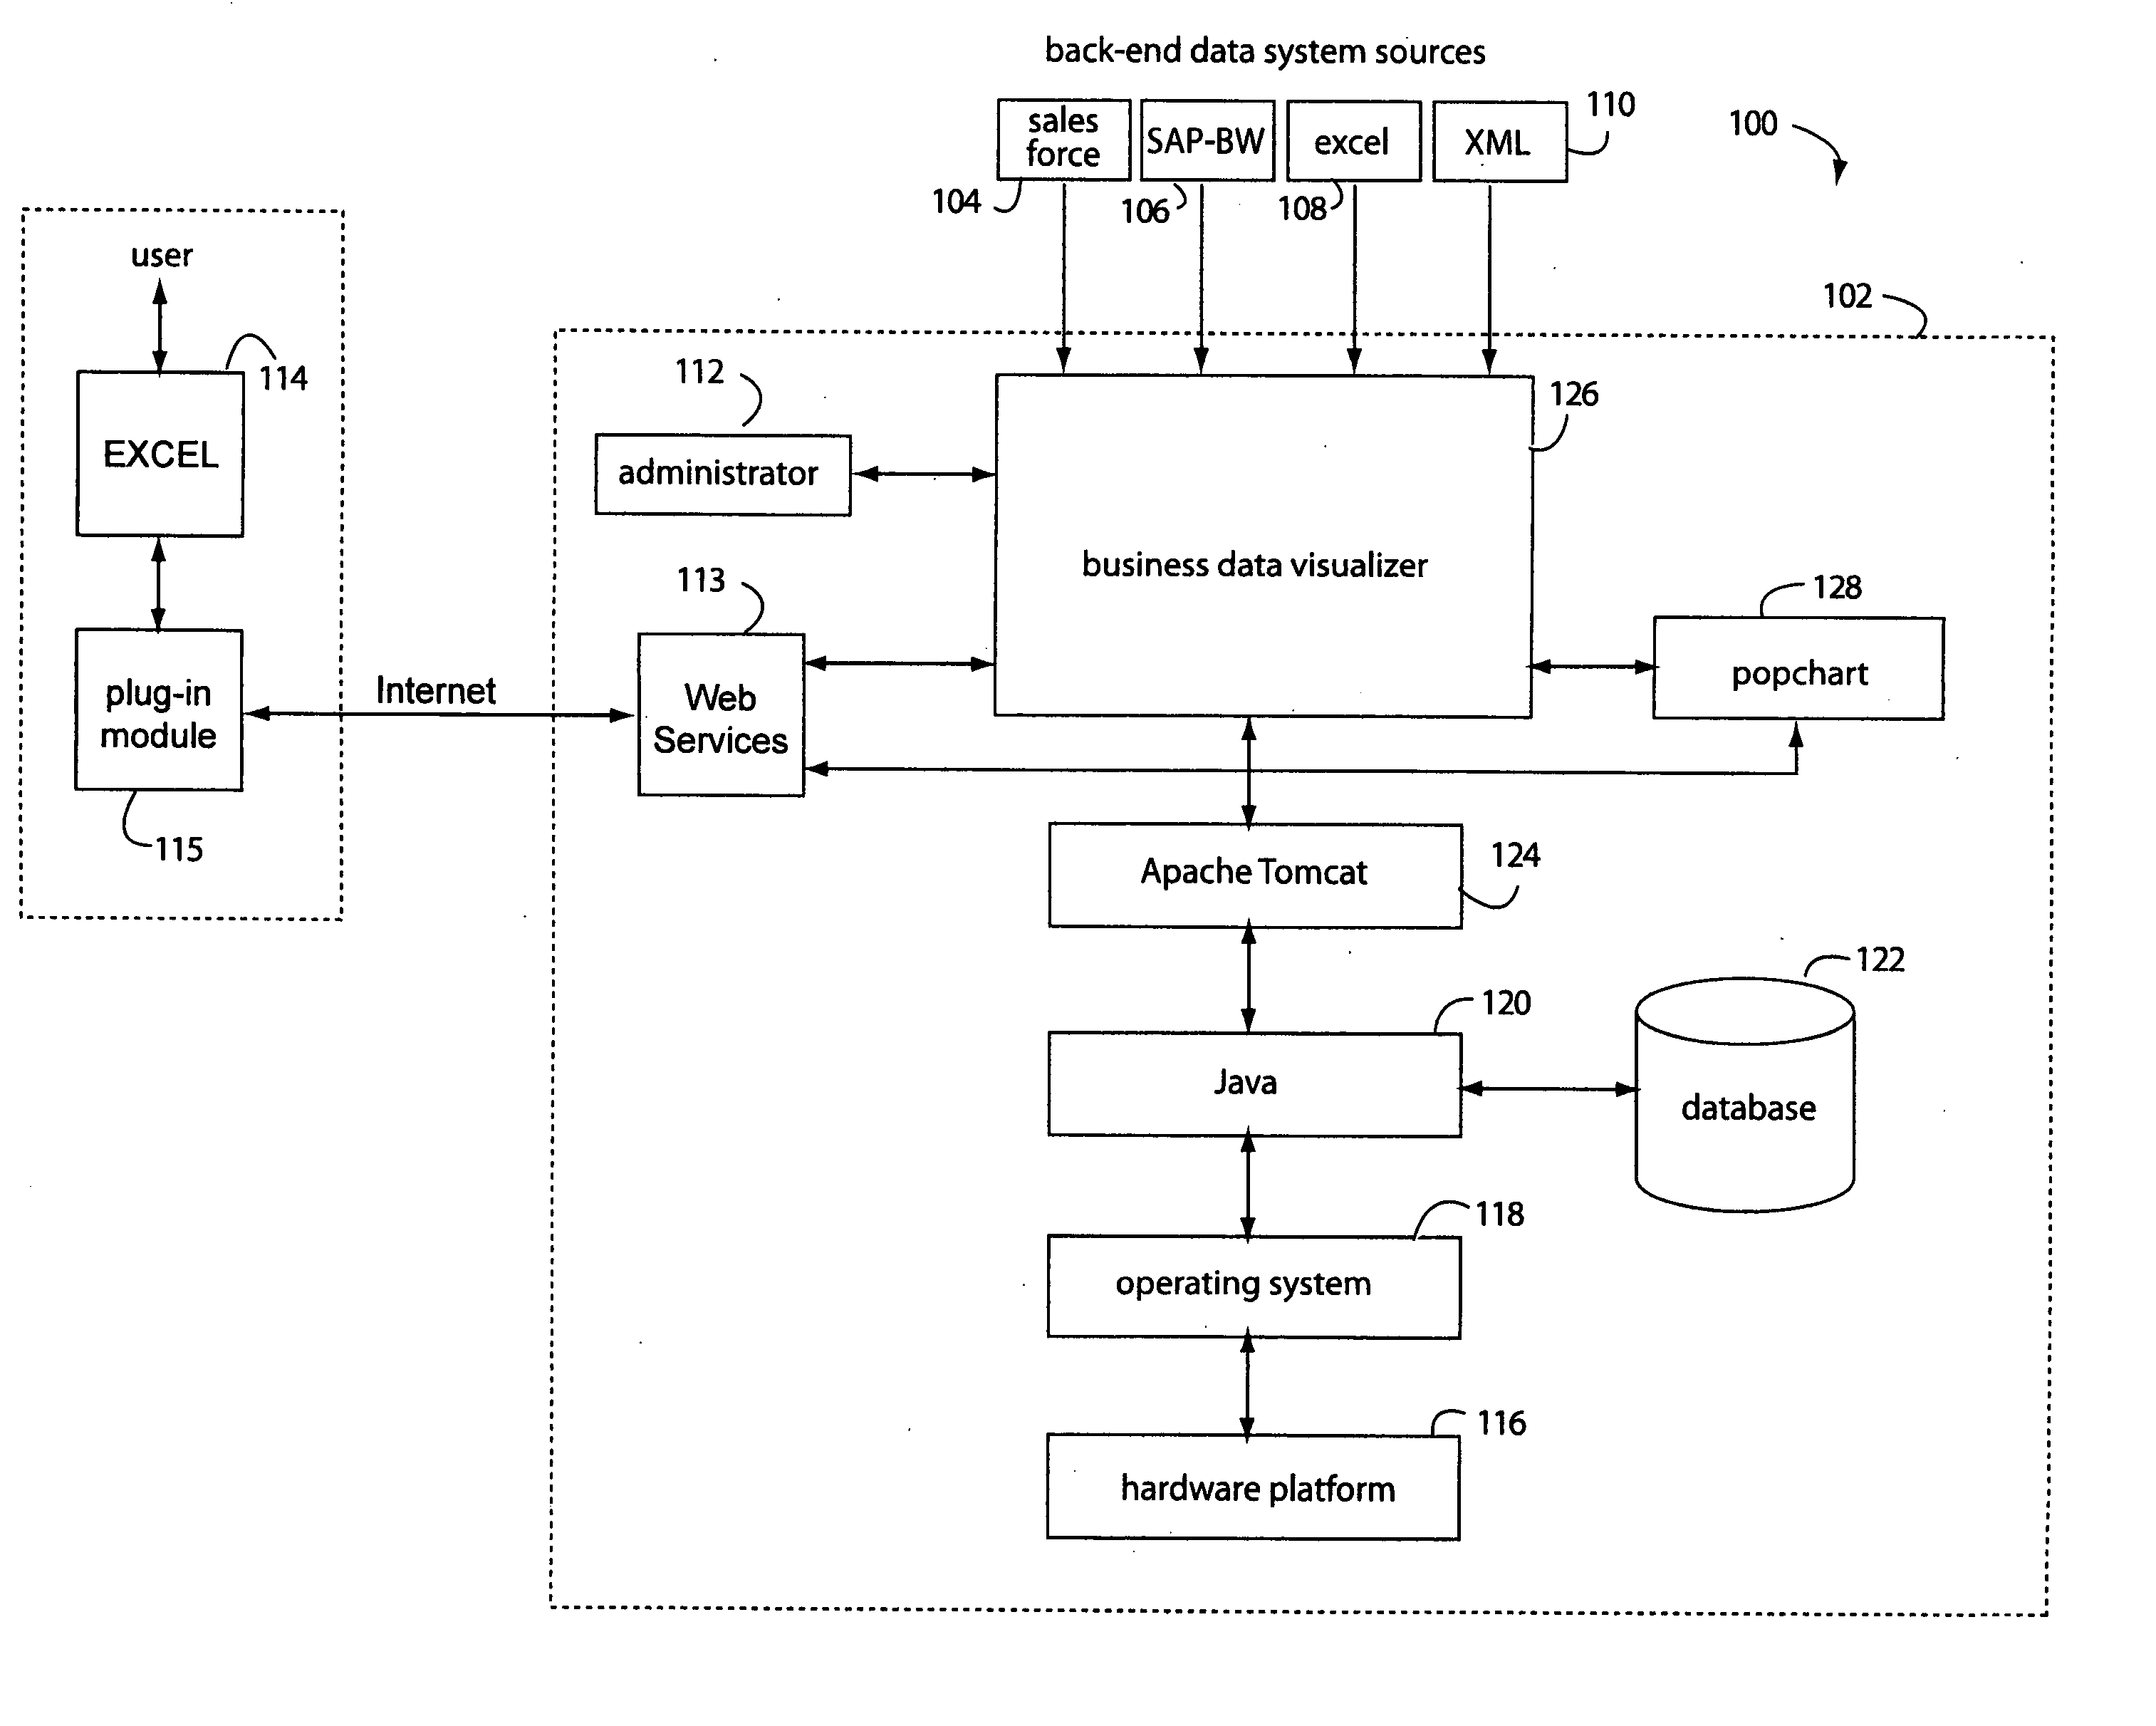
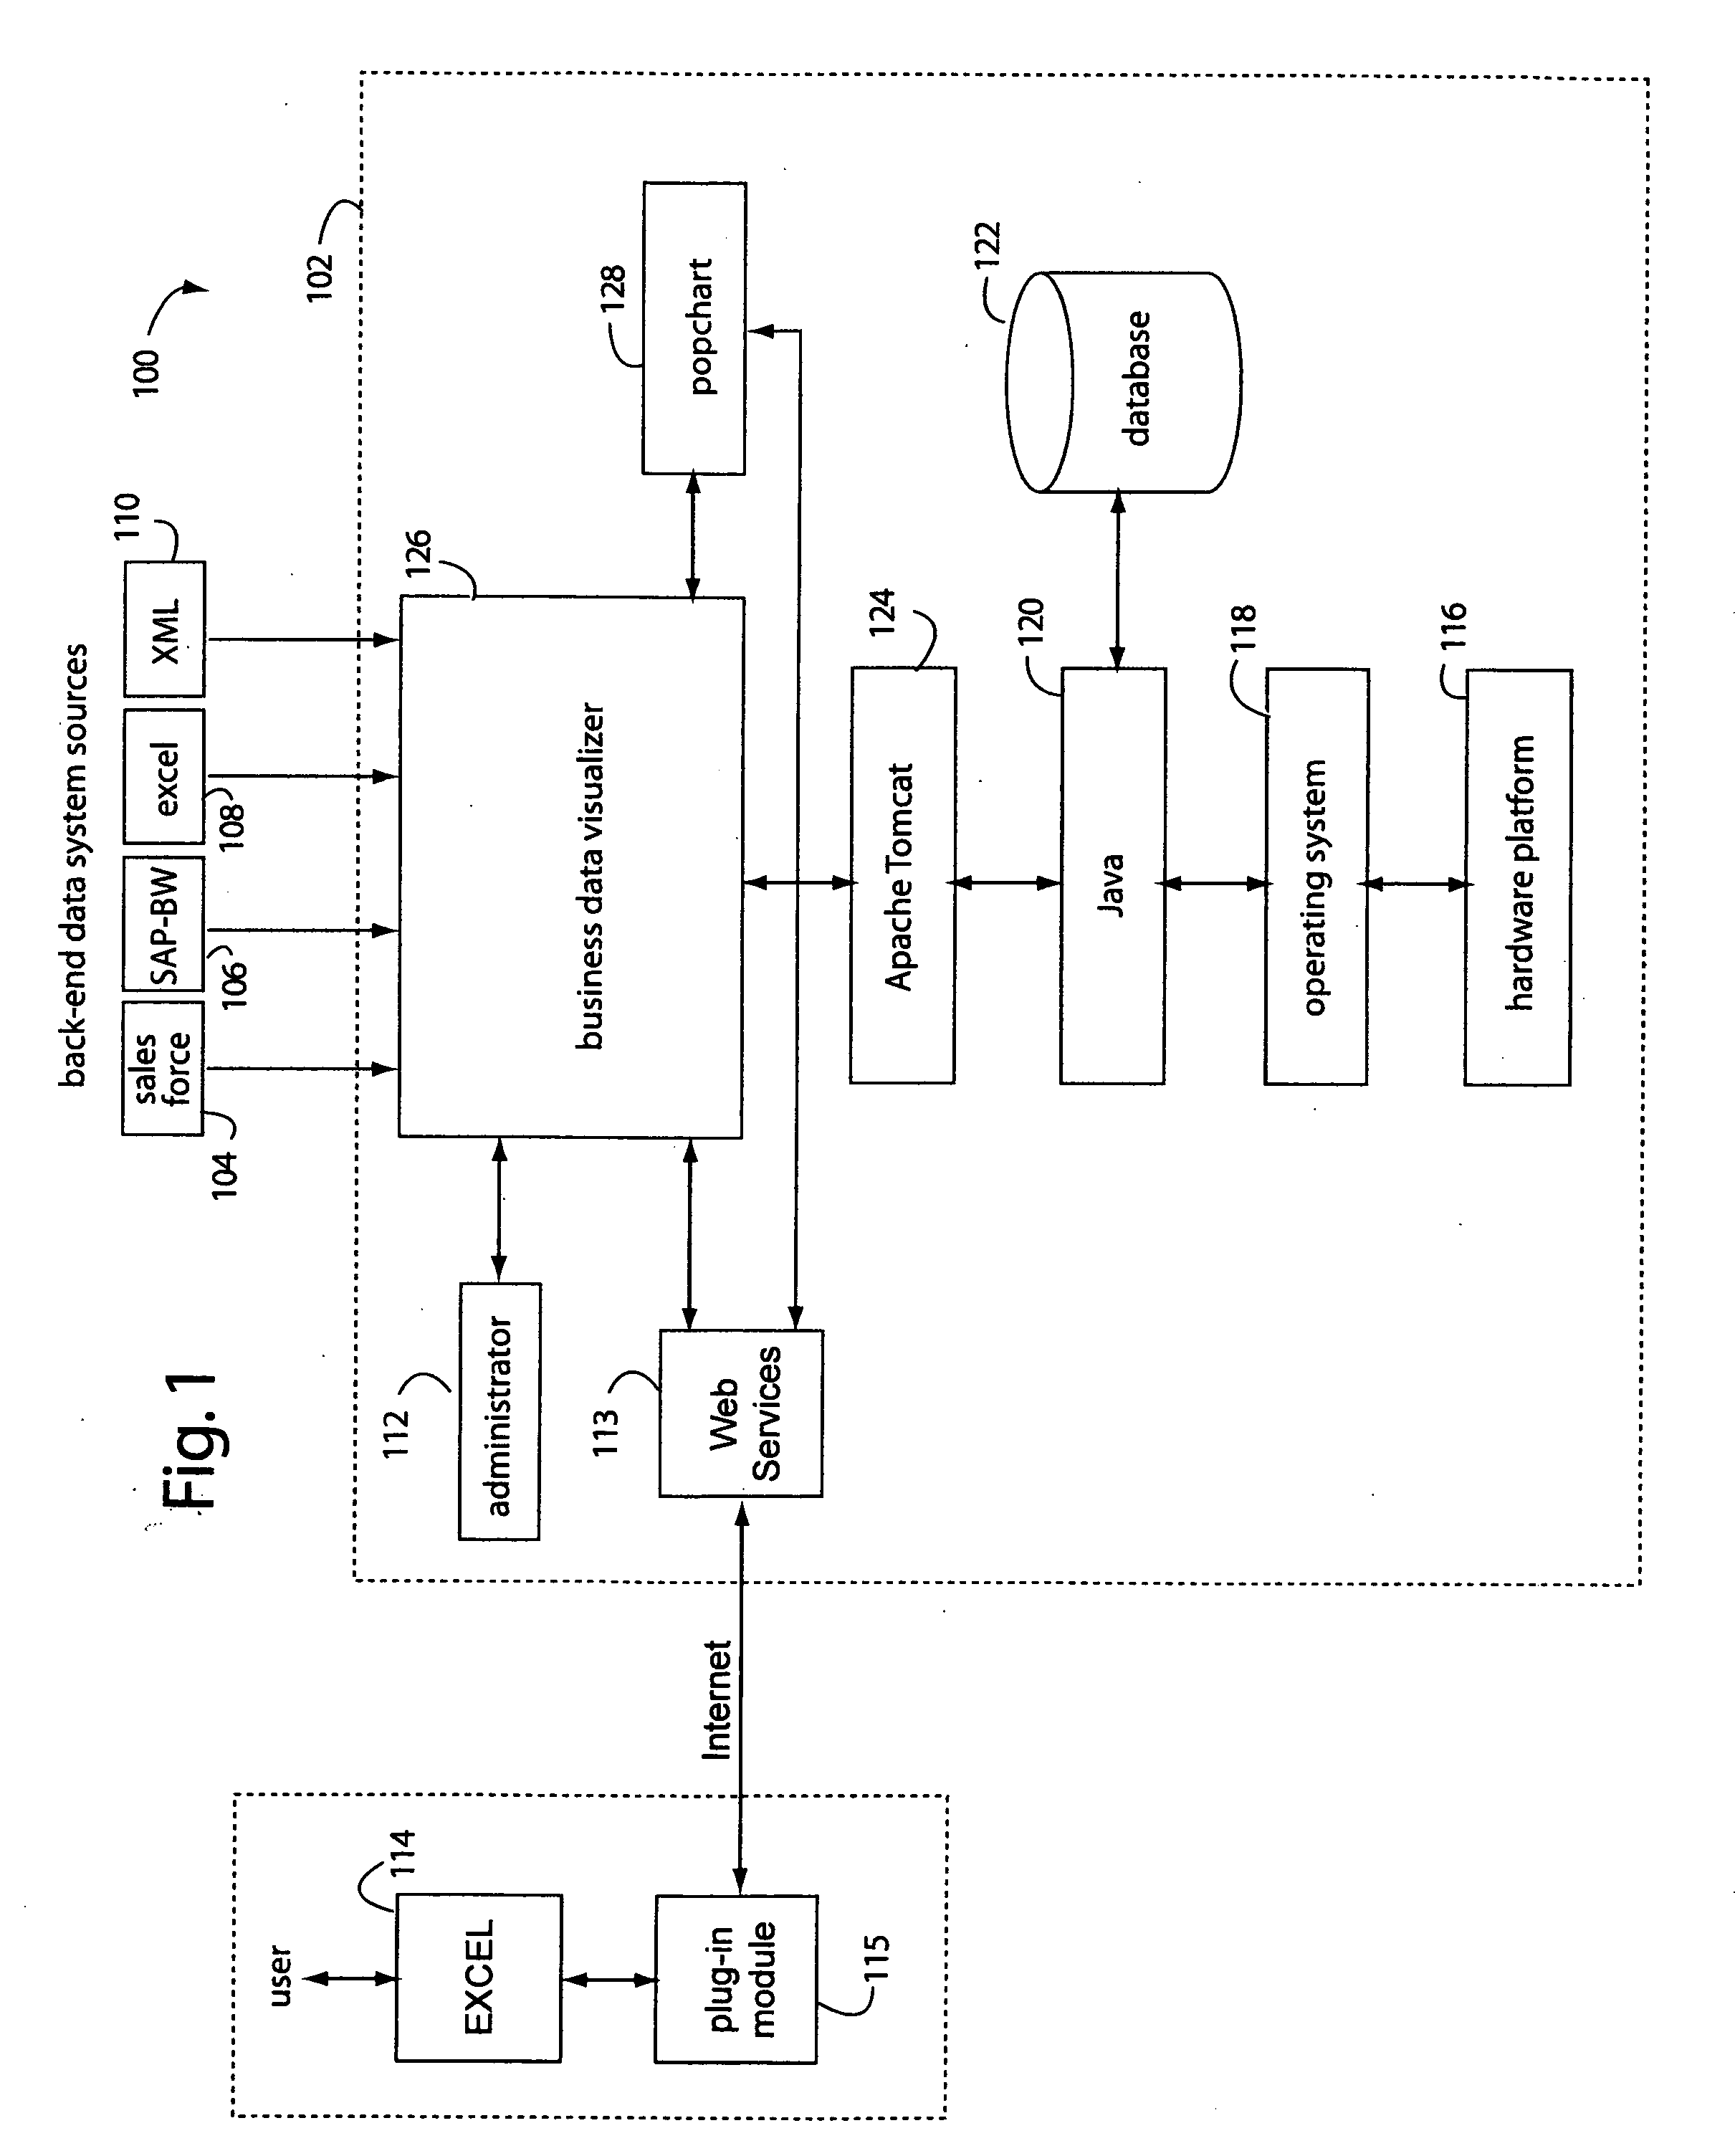
[0039]FIG. 1 represents a business data visualization and publishing system embodiment of the present invention, and is referred to herein by the general reference numeral 100. The system 100 comprises a network server 102 that receives field data from several back-end data system sources related to a particular enterprise. For example, the back-end data system sources can include SALESFORCE™104, SAP BW™106, Microsoft Excel 108, and XML 110 formatted data. A system administrator 112 controls all aspects of how information from data received from the back-end data system sources is extracted, stored, manipulated, correlated, and displayed at a number of Internet-connected clients. Such users log-in and receive standardized and predefined displays of data that help them do their jobs by giving them insights into the performance of the enterprise.

[0040] A web services application program interface (API) 113 connects to the Internet and allows a plurality of subscribing users to better...


PUM


Abstract

A spreadsheet user-interfaced web-based business data publishing system allows users to input and visualize field data and analytical results with interactive charts through a familiar MS-EXCEL user interface. A plug-in module associated with the user's browser and EXCEL application enables a background, web-services connection over the Internet to a management sub-system which extracts, transforms, and publishes data. Charts are customized using a WYSIWYG interface, and business dashboards are constructed through a simple drag-n-drop process. An account management system is included with access control to protect information security. The system is used for visualizing data managing reports, providing special tools to use SAP data, access Query Cubes in SAP BW, and standard and custom R / 3 reports. Once data has been extracted from SAP, it is transformed, merged with other data sources, and published as a dashboard or in a business portal. Its management and configuration functions are suited for enterprise reporting and sharing business data.

Description

RELATED APPLICATION [0001] This application is a continuation-in-part of U.S. patent application Ser. No. 10 / 996,773, filed Nov. 25, 2004 by Indra J. HECKENBACH, and titled, BUSINESS DATA VISUALIZATION AND PUBLISHING SYSTEM.BACKGROUND OF THE INVENTION [0002] 1. Field of the Invention [0003] The present invention relates to business data visualization and publishing systems, and in particular to solutions that have familiar spreadsheet user interfaces. [0004] 2. Description of the Prior Art [0005] EXCEL is a popular spreadsheet application program marketed by Microsoft (MS) Corporation and its user-interface (UI) is very familiar to millions of users worldwide. EXCEL is commonly used for data reporting and analysis in businesses. It has limited capabilities to visualize data, publish it to the Web, and share it amongst users. [0006] EXCEL allows other producers to customize and extend its capabilities through the use of plug-in modules. Data entered through the EXCEL front-end interf...

Claims


Application Information

Patent Timeline
Patent Type & Authority Applications(United States)
IPC IPC(8): G06F17/00G06F7/00
CPCG06F17/246G06F40/18
Inventor CLARK, KYLE A.HECKENBACH, INDRA J.
Owner MACNICA
Learn More