
Method and user interface for enhanced graphical operation organization

a graphical operation and user interface technology, applied in the field of methods and user interfaces for enhanced graphical operations, can solve the problems of inordinate time spent by developers, inability to realize appreciable performance increases, and time-consuming, so as to reduce the execution time of graphical operations, enhance the processing of a graphical application, and reduce the number of graphics pipeline adjustments

Active Publication Date: 2008-02-07
NVIDIA CORP
View PDF66 Cites 10 Cited by
  • Summary
  • Abstract
  • Description
  • Claims
  • Application Information

AI Technical Summary

Benefits of technology

[0006]Accordingly, a need exists to more conveniently and effectively reduce the execution time of graphical operations of graphical applications. Additionally, a need exists to reduce the number of graphics pipeline adjustments made when enhancing the processing of a graphical application. A need also exists to make adjustments to a graphics pipeline which improve performance yet maintain the image quality. Embodiments of the present invention provide novel solutions to these needs and others as described below.
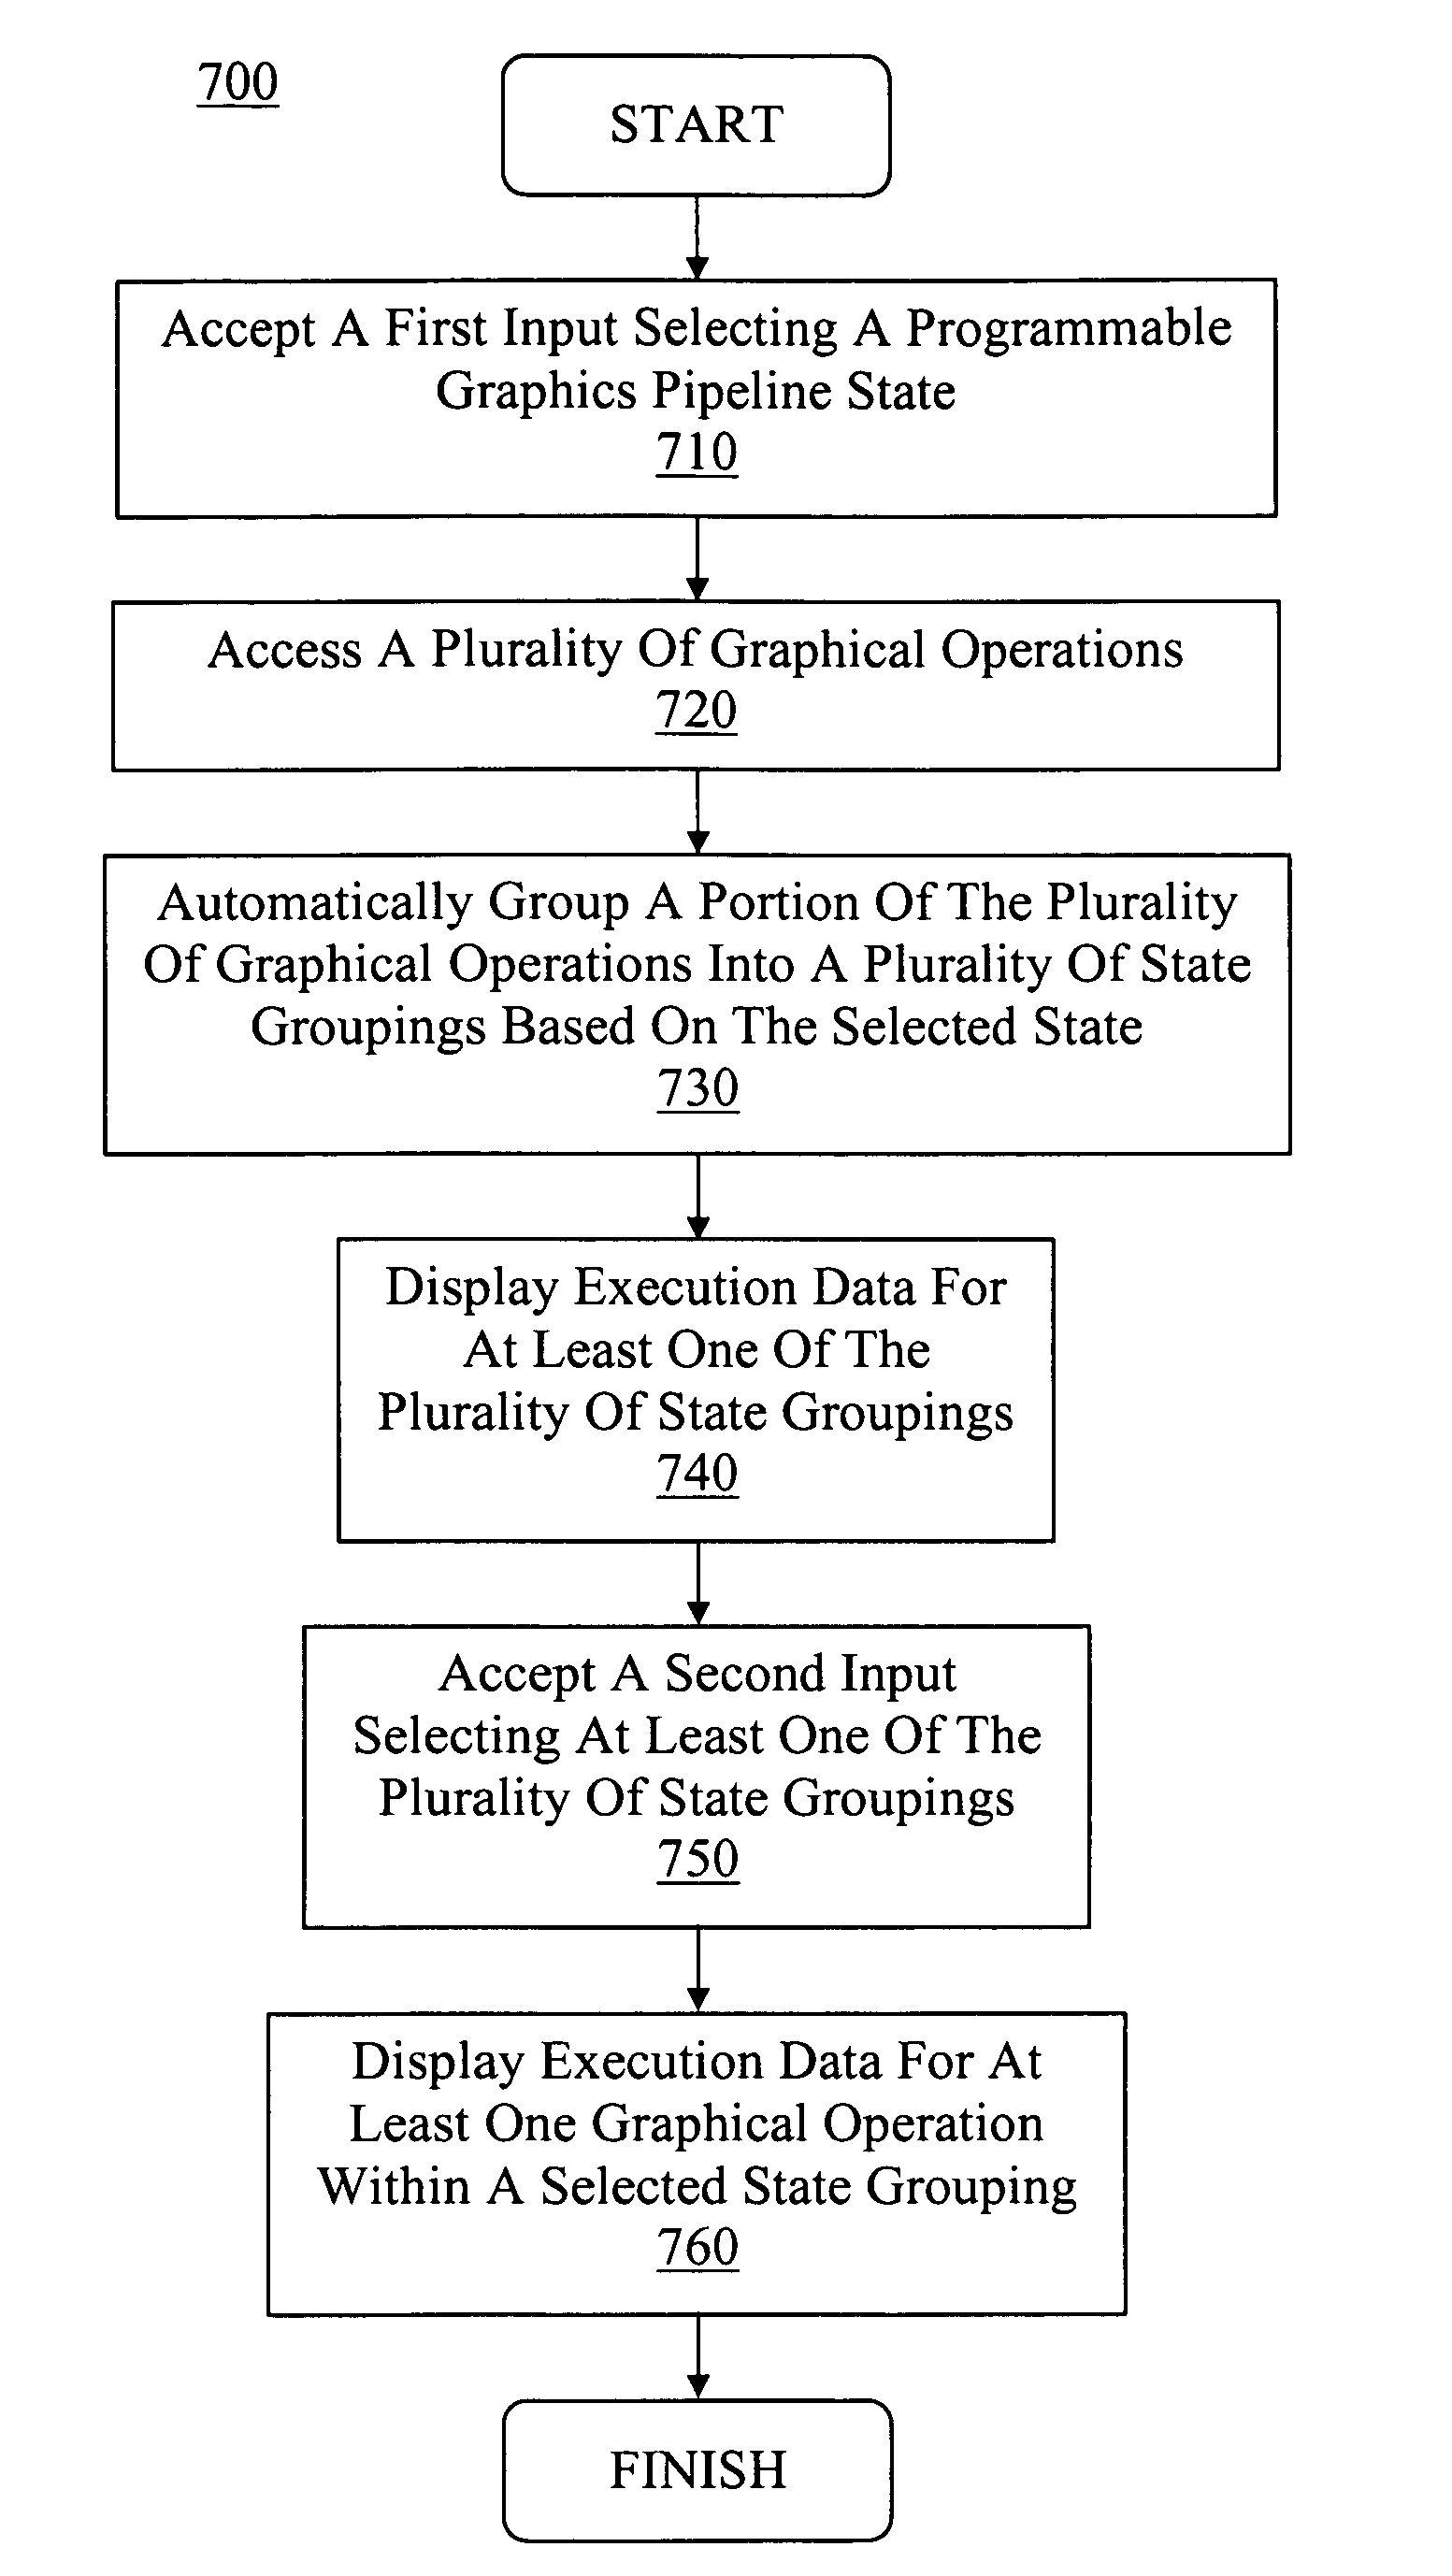
[0007]Embodiments of the present invention are directed to a computer-implemented method and user interface for organizing graphical operations and displaying performance data of a graphics processing pipeline. More specifically, embodiments provide a convenient and effective mechanism for enhancing graphics processing by automatically determining and grouping graphical operations with similar state attributes relating to one or more units of the graphics pipeline. As such, pipeline adjustments for reducing execution time of one graphical operation may benefit other graphical operations with similar state attributes, thereby reducing the number of pipeline adjustments and allowing more careful selection of graphical operations to increase performance and reduce image degradation. Also, the display of the grouped graphical operations also provides information for determining the troublesome operations. In one embodiment, the groups are ranked by their respective execution time. Additionally, other forms of performance data may be displayed for graphical operations with similar state attributes, thereby providing additional information to guide enhancement operations.
[0008]In one embodiment, a computer-implemented method for organizing a plurality of graphical operations includes accepting a first user input selecting a programmable state associated with a graphics pipeline unit, wherein the programmable state is assignable to a plurality of state attributes. The programmable state may comprise at least one of a pixel shader program, a vertex shader program, a blending setting, a render target characteristic and a pixel shader constant. The plurality of graphical operations are accessed, wherein each graphical operation of the plurality of graphical operations comprises at least one of the plurality of state attributes. The plurality of graphical operations are automatically grouped into a plurality of state groupings, wherein each of the plurality of state groupings comprises graphical operations with at least one common state attribute of the programmable state. As such, automatically grouping graphical operations into state groupings enables the targeting of larger numbers of detrimental graphical operations which may benefit from fewer graphics pipeline adjustments (e.g., given the common state attributes shared by the state grouping), thereby enhancing graphical application performance while maintaining or improving image quality.

Problems solved by technology

However, optimizing GPU performance is a daunting task given the limited number of performance tools available, and the limited number of features that the conventional tools offer.
Although this approach seems logical, developers generally find it time-consuming, tedious, without appreciable performance increases, and problematic.
For example, conventional performance tools using this methodology require a developer to spend inordinate amounts of time locating troublesome operations and then optimizing the GPU pipeline for each troublesome graphical operation.
Additionally, many tweaks are often required, which increases the probability that bottlenecks and / or underutilization of pipeline units may occur.
And even if performance increases are realized, compromises made to increase performance at the cost of the rendered image quality may leave the graphical application in an unacceptable state.

Method used


Image

  • Method and user interface for enhanced graphical operation organization
  • Method and user interface for enhanced graphical operation organization
  • Method and user interface for enhanced graphical operation organization

Examples


Embodiment Construction

[0030]Reference will now be made in detail to embodiments of the present invention, examples of which are illustrated in the accompanying drawings. While the present invention will be discussed in conjunction with the following embodiments, it will be understood that they are not intended to limit the present invention to these embodiments alone. On the contrary, the present invention is intended to cover alternatives, modifications, and equivalents which may be included with the spirit and scope of the present invention as defined by the appended claims. Furthermore, in the following detailed description of the present invention, numerous specific details are set forth in order to provide a thorough understanding of the present invention. However, embodiments of the present invention may be practiced without these specific details. In other instances, well-known methods, procedures, components, and circuits have not been described in detail so as not to unnecessarily obscure aspect...


PUM


Abstract

A computer-implemented method and user interface for organizing graphical operations and displaying performance data of a graphics processing pipeline. More specifically, embodiments provide a convenient and effective mechanism for enhancing graphics processing by automatically determining and grouping graphical operations with similar state attributes relating to one or more units of the graphics pipeline. As such, pipeline adjustments for reducing execution time of one graphical operation may benefit other graphical operations with similar state attributes, thereby reducing the number of pipeline adjustments and allowing more careful selection of graphical operations to increase performance and reduce image degradation. Also, the display of the grouped graphical operations also provides information for determining the troublesome operations. In one embodiment, the groups are ranked by their respective execution time. Additionally, other forms of performance data may be displayed for graphical operations with similar state attributes, thereby providing additional information to guide enhancement operations.

Description

RELATED APPLICATIONS[0001]The present application is related to U.S. patent application Ser. No. ______, filed ______, entitled “USER INTERFACE AND METHOD FOR GRAPHICAL PROCESSING ANALYSIS,” naming Raul Aguaviva, Jeffrey Kiel, Sebastien Domine and Will Ramey as inventors, assigned to the assignee of the present invention, and having attorney docket number NVID-P002602. That application is incorporated herein by reference in its entirety and for all purposes.[0002]The present application is related to U.S. patent application Ser. No. ______, filed ______, entitled “A METHOD AND SYSTEM FOR CALCULATING PERFORMANCE PARAMETERS FOR A PROCESSOR,” naming Raul Aguaviva, Jeffrey Kiel and Sebastien Domine as inventors, assigned to the assignee of the present invention, and having attorney docket number NVID-P002603. That application is incorporated herein by reference in its entirety and for all purposes.BACKGROUND OF THE INVENTION[0003]The need to improve the efficiency of graphics processing...

Claims


Application Information

Patent Timeline
IPC IPC(8): G06T1/20
CPCG06F11/3664
Inventor AGUAVIVA, RAULKIEL, JEFFREY T.DOMINE, SEBASTIEN JULIENRAMEY, WILLIAM ORVILLE
Owner NVIDIA CORP
Learn More