System and method for displaying a graphical representation of a network to identify nodes and node segments on the network that are not operating normally

Active Publication Date: 2008-02-28
EMBARQ HLDG
View PDF137 Cites 59 Cited by
  • Summary
  • Abstract
  • Description
  • Claims
  • Application Information

AI Technical Summary

Benefits of technology

[0033]A communications carrier may manage a packet network by monitoring operating performance of the packet network using a graphical user interface (GUI) that displays a graphical representation of network elements, including network nodes and segments. The GUI may display graphical representations of the network elements in different modes depending on the operating performance of respective network elements.
[0034]One embodiment of a graphical user interface (GUI) for displaying operating performance of a packet network may include first graphical representations illustrative of network communications devices operating on a packet network, where the first graphical representations may be displayed in a first mode if respective network communications devices are operating normally to communicate data packets including real-time content and non-real-time content and in a second mode in respective network communications devices are not operating normally to communicate data packets including real-time content in non-real-time content. The GUI may further display second graphical representations illustrative of node segments connecting respective network communications devices, where the second graphical representations may be displayed in a third mode if respective node segments are operating normally to communicate data packets including real-time content and non-real-time content and in a fourth mode if respective node segments are not operating normally to communicate data packets including real-time content and non-real-time content.
[0035]Another embodiment may include a system for displaying operating performance of a packet network. The system may include a database configured to store network performance information collected from a packet network, where the network performance information may distinguish network performance information associated with communications of data packets including real-time content and data packets including non-real-time content. A processing unit may be in communication with the database and configured to access the stored network performance information. The processing unit may further be configured t

Problems solved by technology

Ethernet poses special problems for use in communications systems given it lacks dedicated bandwidth and time slots.
The shared nature of an Ethernet network creates additional complexities in that the amount of available bandwidth can vary when used with wireless technologies.
This lack of connection path state awareness with the communications protocols, such as Ethernet and Internet protocol (IP) technologies, result in “gaps” in terms of being able to react to decaying transmission path quality and be sensitive to shared use of bandwidth.
IP and Ethernet protocols lack the in-band path signaling, quality and use metrics to allow for this scale, or the ability to perform enhanced call handling with paths outside the governance of the packet network.
Because packet communications are asynchronous, there is no common clock, and, thus, there is no way to know how many packets were transmitted, which, in turn, removes the ability to characterize transmission quality of the entire path, the amount of bandwidth available, or the amount in use.
These operational assumptions are problematic as Ethernet, IP, and other data networks become oversubscribed and cause the packet network to become congested and prevent throughput.
In cases where an end-point, such as a WiFi telephone, is mobile and bandwidth changes with signal strength (e.g., a WiFi telephone losing bandwidth as an individual walks away from a connection point antenna), the connection operation assumptions also fail to provide graceful call handling.
While CAC functionality exists, the use of such CAC functionality is almost never applied because of the amount of time needed by the CAC procedure during call set up.
Utilization of the real-time QoS statistics, however, is limited to the specific session associated with the RTCP stream.
However, the configuration falls short of providing the amount of real-time bandwidth in use or the total bandwidth in use.
Service providers often have trouble isolating and diagnosing network problems.
This probe, however, is typically an external device from the network communications devices and operates to run a trace over an instant of time to determine network performance information, such as packet loss, jitter, and delay.
These results are not accessible to the network communications devices and cannot be accessed by network communications devices to alter network communications.
Because of packet network content communications variables, calls may encounter congestion and loss of voice quality based on latency, jitter, and packet loss.
Other end units may attempt calls, computers may send/receive data without talking to the CCM, and other devices may require bandwidth while the original call is progressing, thus causing voice quality problems for the participants.
In addition to these basic gaps, many physical layer 1 systems that are poor in regulating bandwidth, are being used for transmission facilities.
Conventional soft-switching has not been designed to provide relief for callers when congestion, jitter or delay problems, such as those described above, are encountered.
Since conventional CCMs can only determine call success based on connectivity to and from the calling parties, voice quality between two parties is not taken into considera

Method used


Image

  • System and method for displaying a graphical representation of a network to identify nodes and node segments on the network that are not operating normally
  • System and method for displaying a graphical representation of a network to identify nodes and node segments on the network that are not operating normally
  • System and method for displaying a graphical representation of a network to identify nodes and node segments on the network that are not operating normally

Examples


Example

DETAILED DESCRIPTION OF THE DRAWINGS

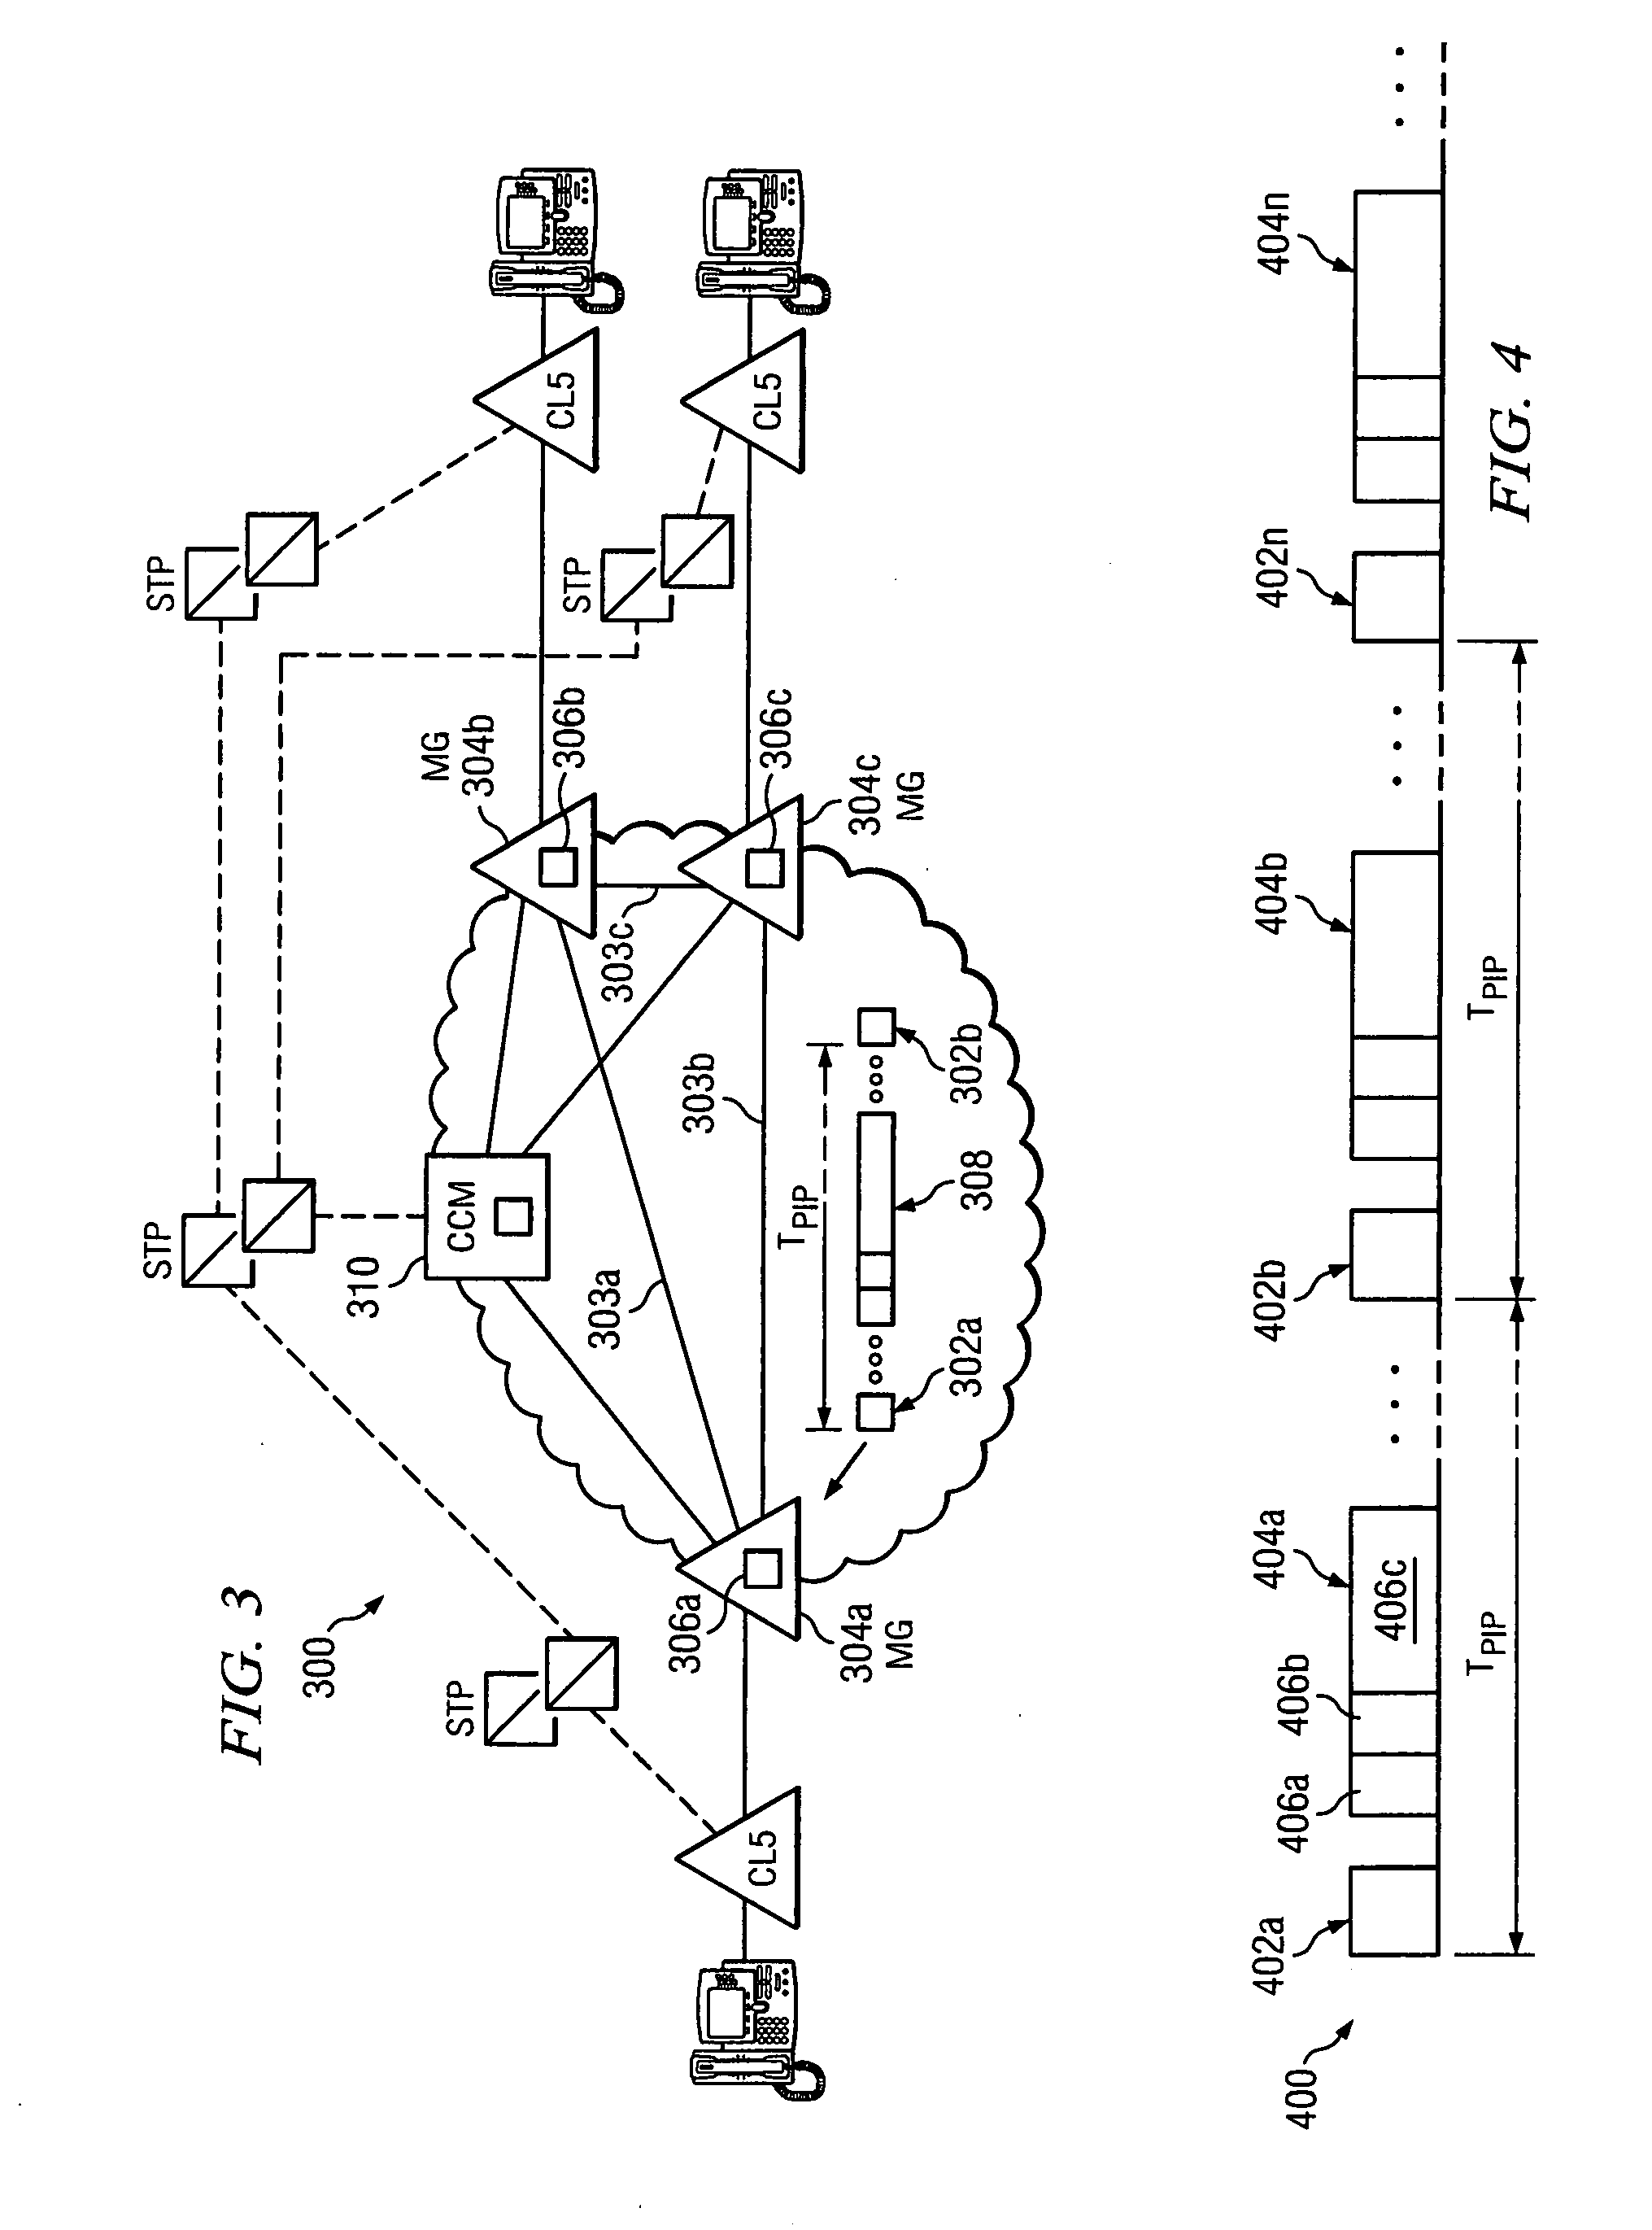
[0104]FIG. 3 is an illustration of an exemplary packet network 300 that utilizes performance information packets 302a, 302b (collectively 302) communicated in-band, and along virtual packet paths between represented as node links 303a, 303b, and 303c (collectively 303) between network nodes 304a, 304b, and 304c (collectively 304). For purposes of this application, a performance information packet (a “PIP packet” or “PIP data packet”) shall mean a packet communicated over data paths of a data packet network that is used by the data packet network to obtain performance information associated with path transmission states of the data packet network. In one embodiment, such PIP packets are communicated in-band along the data or bearer path of a packet network. However, such PIP packet information may also be communicated out-of-band between network elements of the packet network to provide utilization performance measures to other switching and contro...


PUM


Abstract

A GUI, system, and method for displaying operating performance of a packet network may include displaying first graphical representations illustrative of network communications devices operating on a packet network, where the first graphical representations may be displayed in a first mode if respective network communications devices are operating normally to communicate data packets including real-time content and non-real-time content and in a second mode if respective network communications devices are not operating normally to communicate data packets including real-time content and non-real-time content. Second graphical representations illustrative of node segments connecting respective network communications devices may be displayed, where the second graphical representations may be displayed in a third mode if respective node segments are operating normally to communicate data packets including real-time content and non-real-time content and a fourth mode if respective node segments are not operating normally to communicate data packets including real-time content and non-real-time content.

Description

CROSS REFERENCE TO RELATED APPLICATIONS[0001]This application claims priority from the following co-pending U.S. Provisional Patent Application 60 / 839,333 filed on Aug. 22, 2006, 60 / 897,543 filed Jan. 26, 2007, 60 / 905,624 filed Mar. 7, 2007, and Ser. No. 60 / 922,246 filed Apr. 5, 2007; the entire teachings of which are incorporated herein by reference.BACKGROUND OF THE INVENTION[0002]Telephony has advanced dramatically with the advancement of technology. Telephone communication was once limited to an analog public switched telephone network (PSTN), where the PSTN has been traditionally formed of two types of telephone carriers, local and long distance. The local carriers established local networks for subscribers to communicate within local regions, and the long distance carriers created networks between the local networks to enable subscribers of different local carriers to communicate with one another.[0003]Over time, mobile telephone networks were developed to enable subscribers t...

Claims


Application Information

Patent Timeline
IPC IPC(8): G06F15/177
CPCH04L41/0896H04L41/22H04L41/5051H04L41/5009H04L41/5003
Inventor BUGENHAGEN, MICHAEL K.MORRILL, ROBERT J.EDWARDS, STEPHEN K.
Owner EMBARQ HLDG
Why Eureka
Try Eureka