
Process data presentation based on process regions

a technology of process region and process data, applied in the field of process related data presentation, can solve the problems of affecting and unable to timely identify such problems, so as to reduce the viewing size of the computer display, increase the information in the viewing area, and reduce the usability of process representation

Active Publication Date: 2008-03-20
IBM CORP
View PDF9 Cites 2 Cited by
  • Summary
  • Abstract
  • Description
  • Claims
  • Application Information

AI Technical Summary

Benefits of technology

[0010]More particularly, where a “zoom” capability is used to minimize in the computer display the viewing size of the process artifacts so as to increase the information in the viewing area of the computer display, such scaling efforts greatly reduce the usability of the process representation since the objects become too small to be read within the computer display. One approach that has been used is to permit

Problems solved by technology

Failure to timely identify such problems can have a catastrophic effect, and appropriate data presentation methodologies are therefore important.
For example, the layout of the facility might create an unexpected bottleneck.
Without such simulation, the real manufacturing facility might be constructed before the problems are identified, at which point modification of the facility to address these problems is likely to be extremely costly.
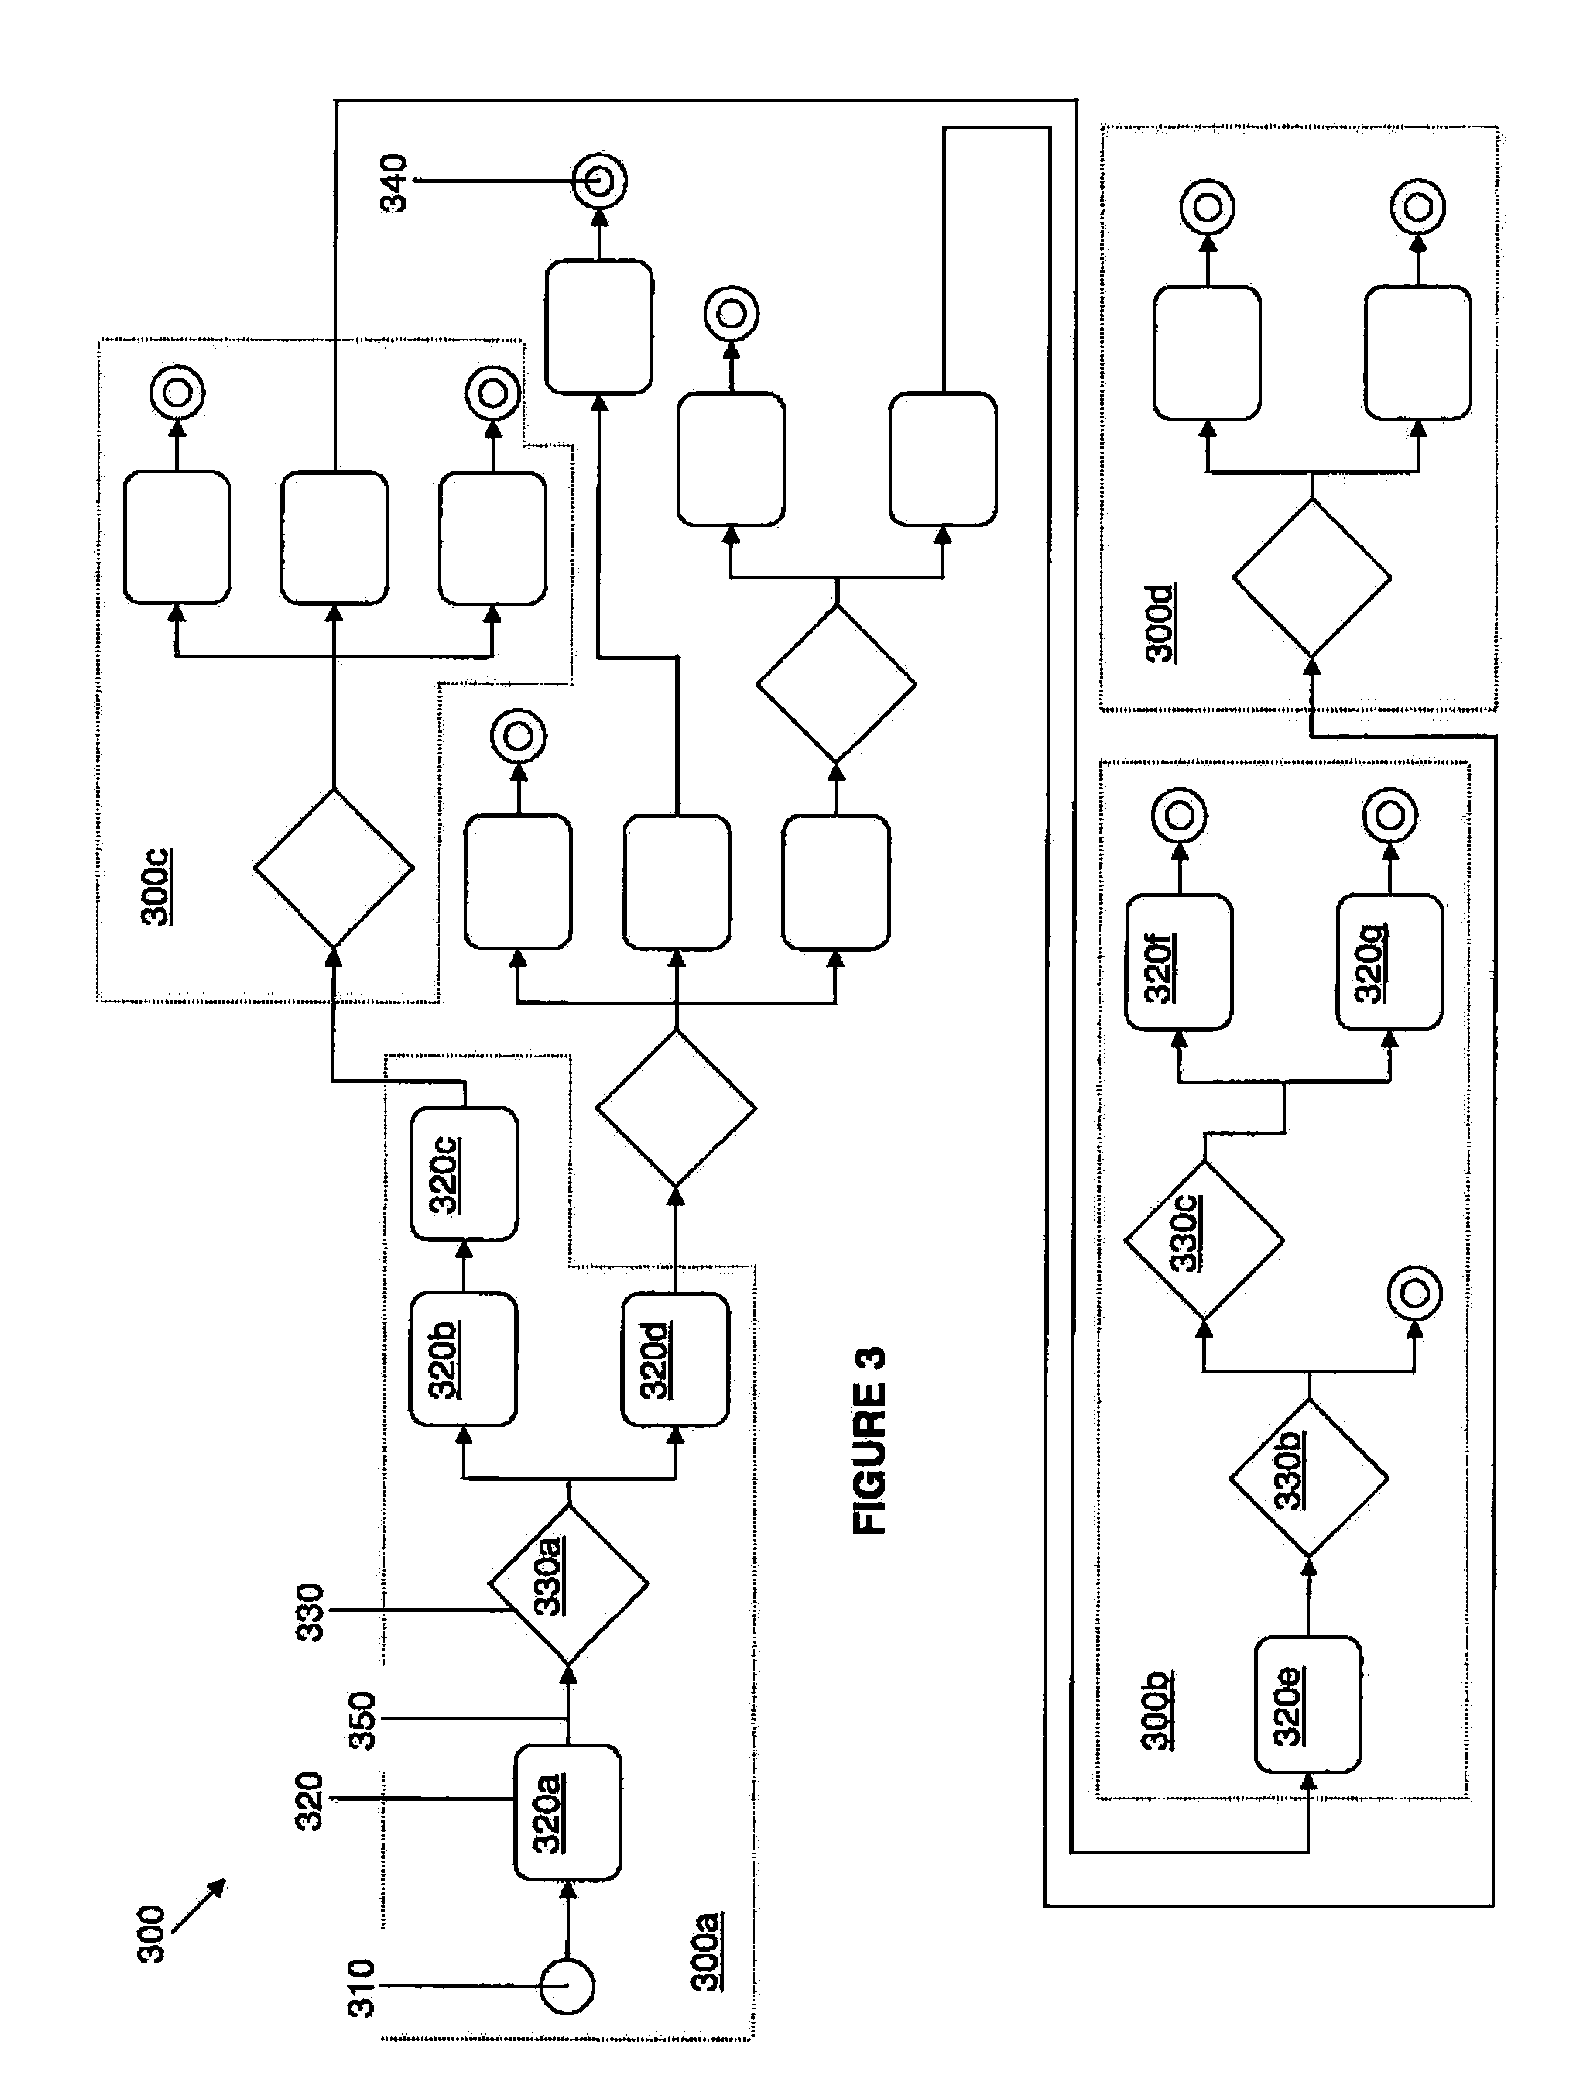
As described above, both process modeling and real-world processes that require real-time data presentation are becoming more and more complex, and in many instances consist of hundreds or thousands of sub-steps / nodes.
The representation of a large process in a computer display can be problematic.
In particular, it can be difficult for users to effectively observe and follow the representation of a large process in a computer display for areas of high interest.
More particularly, where a “zoom” capability is used to minimize in the computer display the viewing size of the process artifacts so as to increase the information in the viewing area of the computer display, such scaling efforts greatly reduce the usability of the process representation since the objects become too small to be read within the computer display.
This approach is often cumbersome and inefficient, and creates the risk that a user may fail to observe important data in a portion of the process representation that is not within the current viewing window.

Method used


Image

  • Process data presentation based on process regions
  • Process data presentation based on process regions
  • Process data presentation based on process regions

Examples


Embodiment Construction

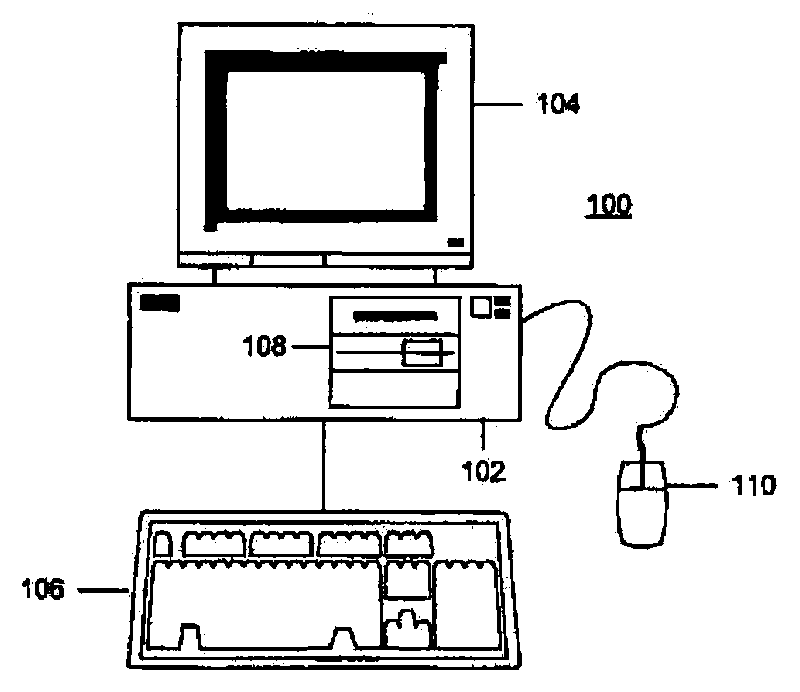
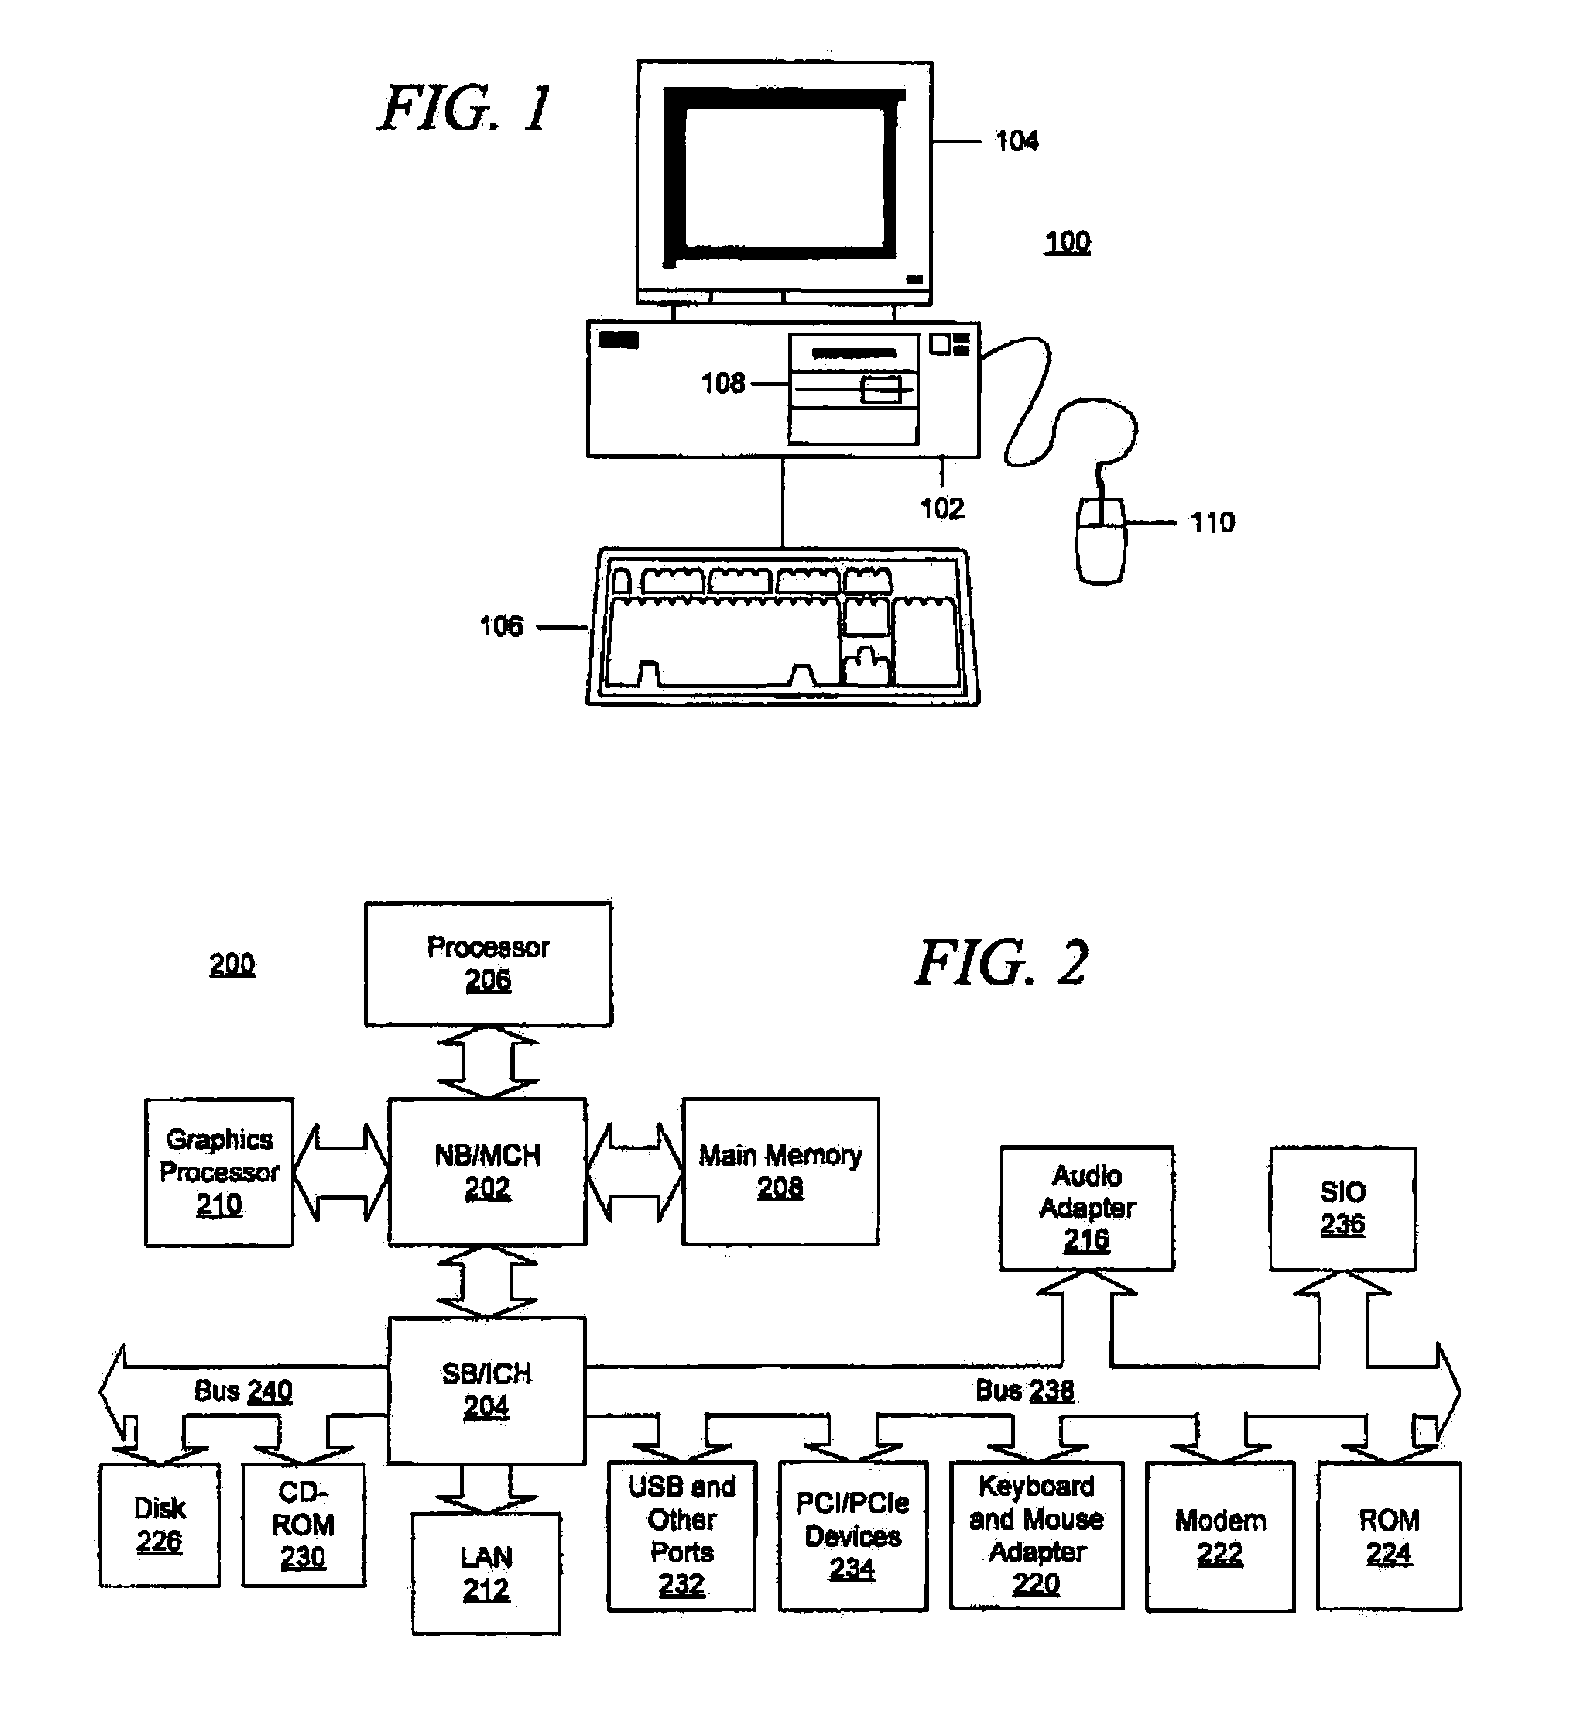
[0034]FIG. 1 is a pictorial representation of a data processing system in which aspects of the present invention may be implemented. A computer 100 is depicted which includes system unit 102, video display terminal 104, keyboard 106, storage devices 108, which may include floppy drives and other types of permanent and removable storage media, and mouse 110. Additional input devices may be included with personal computer 100, such as, for example, a joystick, touchpad, touch screen, trackball, microphone, and the like.

[0035]Computer 100 may be implemented using any suitable computer, such as an IBM® eServer™ computer or IntelliStation® computer, which are products of International Business Machines Corporation, located in Armonk, N.Y. Although the depicted representation shows a personal computer, exemplary aspects of the present invention may be implemented in other types of data processing systems, such as laptop computers, palmtop computers, handheld computers, network computers, ...


PUM


Abstract

Computer-implemented methods, computer program products and data processing systems for presenting dynamic data pertaining to a process. In one aspect, region information identifying a plurality of user-selected regions of the process, switching information identifying criteria for switching among the user-selected regions, and dynamic data pertaining to the process, are used to generate a dynamic visual representation of the process which emphasizes, at any given time, only one of the user-selected regions. The user-selected region emphasized at any given time is automatically determined according to the criteria for switching. In another aspect, region information identifying at least one user-selected region of the process and dynamic data pertaining to the process are used to generate a dynamic visual representation of at least a portion of the process containing the at least one user-selected region. The visual representation emphasizes each user-selected region within the context of the portion of the process.

Description

FIELD OF THE INVENTION[0001]The present invention relates to the presentation of process-related data, and more particularly to systems, methods and computer program products for presenting process-related data to facilitate user comprehension and analysis of such data.BACKGROUND OF THE INVENTION[0002]There are many different types of processes for which it is advantageous to present data pertaining to the process and to the subprocesses that make up that process.[0003]For example, in process control applications, such as power generation facilities, information about the current state of the various subprocesses is critical to enabling facility operators to identify and correct potential problems. Failure to timely identify such problems can have a catastrophic effect, and appropriate data presentation methodologies are therefore important.[0004]Another example of a type of process for which data pertaining to the process should be presented is a business process. As used herein, t...

Claims


Application Information

Patent Timeline
IPC IPC(8): G06T11/20G06F17/00
CPCG06T11/206G06Q10/06G06F3/04842G06F3/04817
Inventor BENAYON, JAY W.LAU, KUI YANNG, BERNATHROSS, ALEXANDER S.
Owner IBM CORP
Learn More