Adaptive read and write systems and methods for memory cells
Active Publication Date: 2008-05-08
MARVELL ASIA PTE LTD
16 Cites 19 Cited by
AI-Extracted Technical Summary
Problems solved by technology
In practice, it is often difficult to precisely program a multi-level memory cell with a desired amount of charges.
Unfortunately, memory cel...
Method used
[0046] In contrast to the computed optimal or near optimal detection threshold values, the computed optimal or near optimal mean values may be used during a write operation to program a memory cell. That is, although optimal or near optimal mean values may be calculated (along with the near optimal detection threshold values) for a multi-level memory cell during or after a read operation of the multi-level memory cell, the optimal or near optimal mean values may not be used until a subsequent write (i.e., programming) operation of the memory cell. The computed optimal or near optimal mean values may be used to more reliably program multi-level memory cells during a write operation, particularly for example, those multi-level memory cells that have been repeatedly cycled.
[0048] In order to calculate optimal or near optimal mean and detection threshold values of multi-level memory cells, it is recognized that many parameters associated with multi-level memory cells including, for example, the mea...
Benefits of technology
[0012] According to various embodiments of the present invention, adaptive memory read and write systems and methods are provided that may adjust to level distributions changes of memory cells. For the embodiments, the systems may include at least multi-level memory cells, which may be multi-level flash memory cells, and a computation block operatively coupled to the multi-level memory cells. The computation block may be con...
Abstract
Adaptive memory read and write systems and methods are described herein that adapts to changes to threshold voltage distributions of memory cells as of result of, for example, the detrimental affects of repeated cycling operations of the memory cells. The novel systems may include at least multi-level memory cells, which may be multi-level flash memory cells, and a computation block operatively coupled to the multi-level memory cells. The computation block may be configured to compute optimal or near optimal mean and detection threshold values based, at least in part, on estimated mean and standard deviation values of level distributions of the multi-level memory cells. The optimal or near optimal mean and detection threshold values computed by the computation block may be subsequently used to facilitate writing and reading, respectively, of data to and from the multi-level memory cells.
Application Domain
Read-only memoriesDigital storage +1
Technology Topic
Self adaptiveThreshold voltage +5
Image
Examples
- Experimental program(1)
Example
[0029] In the following detailed description, reference is made to the accompanying drawings which form a part hereof wherein like numerals designate like parts throughout, and in which is shown by way of illustration embodiments in which the invention may be practiced. It is to be understood that other embodiments may be utilized and structural or logical changes may be made without departing from the scope of the present invention. Therefore, the following detailed description is not to be taken in a limiting sense, and the scope of embodiments in accordance with the present invention is defined by the appended claims and their equivalents.
[0030] Various operations may be described as multiple discrete operations in turn, in a manner that may be helpful in understanding embodiments of the present invention; however, the order of description should not be construed to imply that these operations are order dependent.
[0031] For the purposes of the instant description, the phrase “A/B” means A or B. For the purposes of the instant description, the phrase “A and/or B” means “(A), (B), or (A and B).” For the purposes of the instant description, the phrase “at least one of A, B and C” means “(A), (B), (C), (A and B), (A and C), (B and C) or (A, B and C).” For the purposes of the instant description, the phrase “(A)B” means “(B) or (AB),” that is, A is an optional element.
[0032] The description may use the phrases “in various embodiments,” or “in some embodiments,” which may each refer to one or more of the same or different embodiments. Furthermore, the terms “comprising,”“including,”“having,” and the like, as used with respect to embodiments of the present invention, are synonymous.
[0033] According to various embodiments of the present invention, adaptive read and write memory systems and methods are provided that may adapt to changes to level distributions of multi-level memory cells. In particular, the novel systems may be configured to compute new mean values of level distributions and/or new detection threshold values of multi-level memory cells (herein “memory cells”) after the memory cells have degraded as a result of, for example, repeated cycling. For purposes of the following description, the computed new mean and detection threshold values will be referred to as “optimal or near optimal” values. That is, the phrase “optimal or near optimal” as used herein are in reference to the mew mean and detection threshold values that may be computed using either an optimal solution, which may be a more complex solution requiring more computational power, or a simpler near optimal (approximate) solution. As will be described herein, these values may be calculated whenever a read operation is performed on multi-level memory cells.
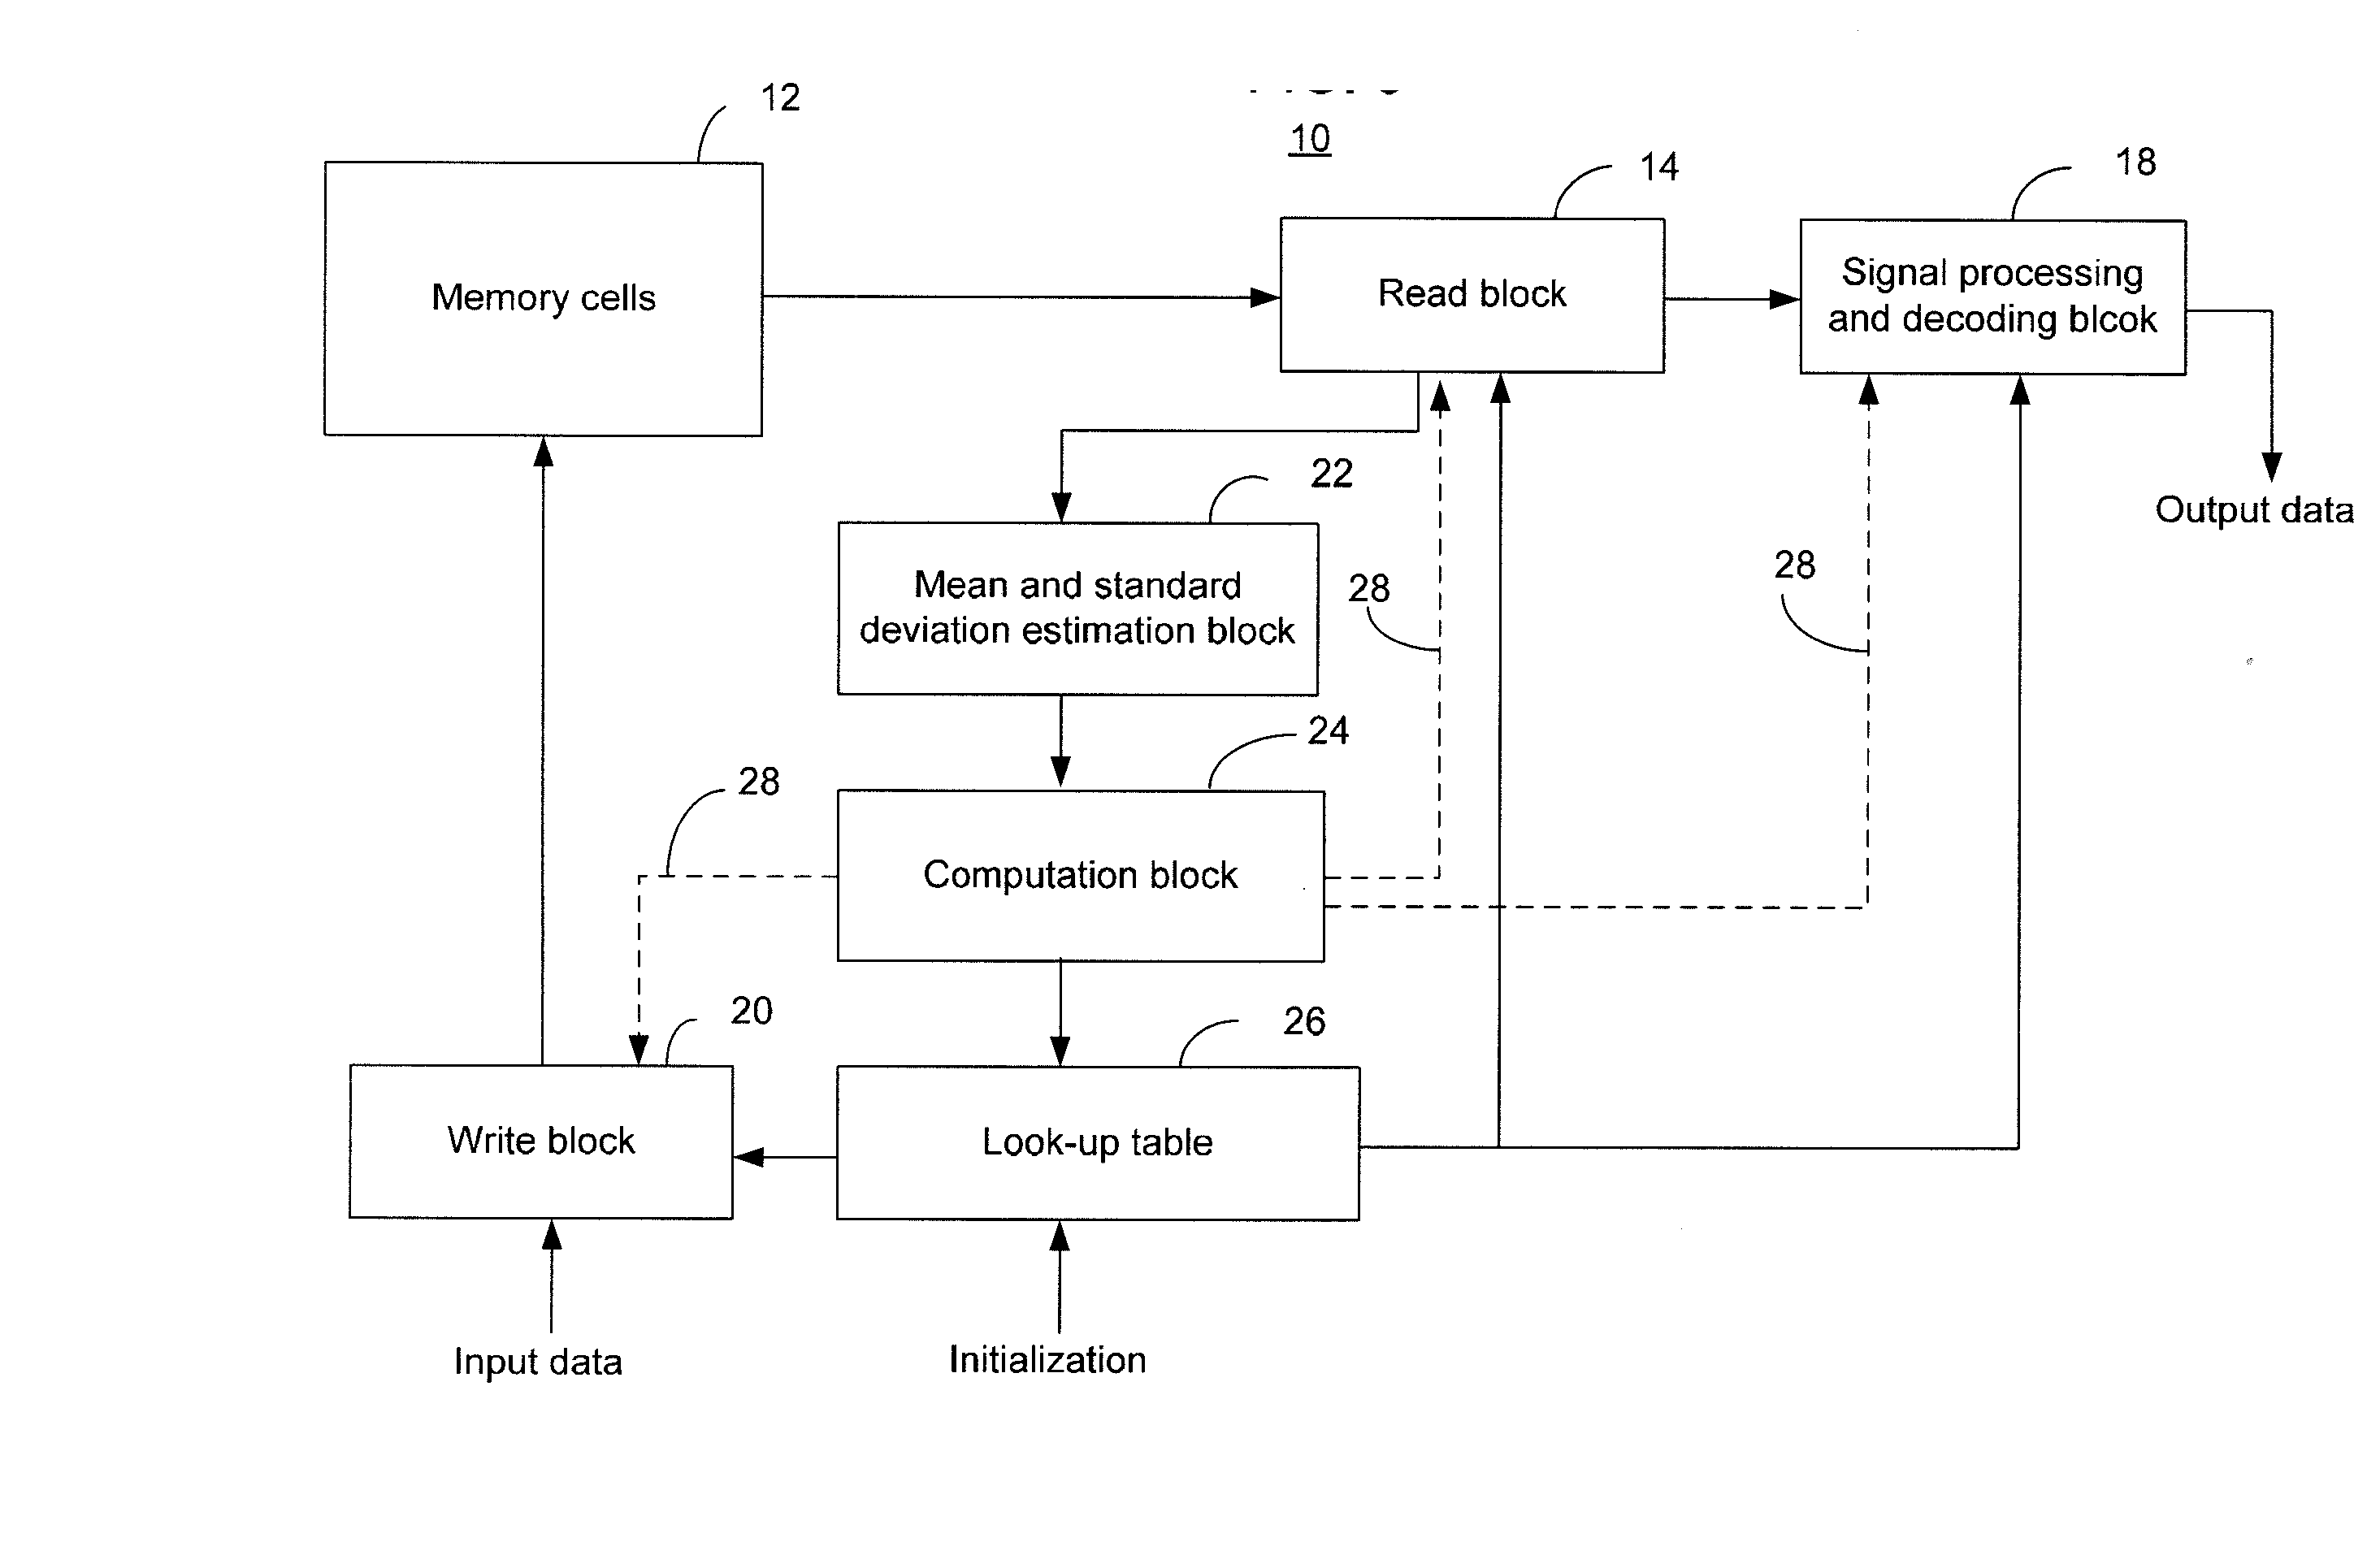
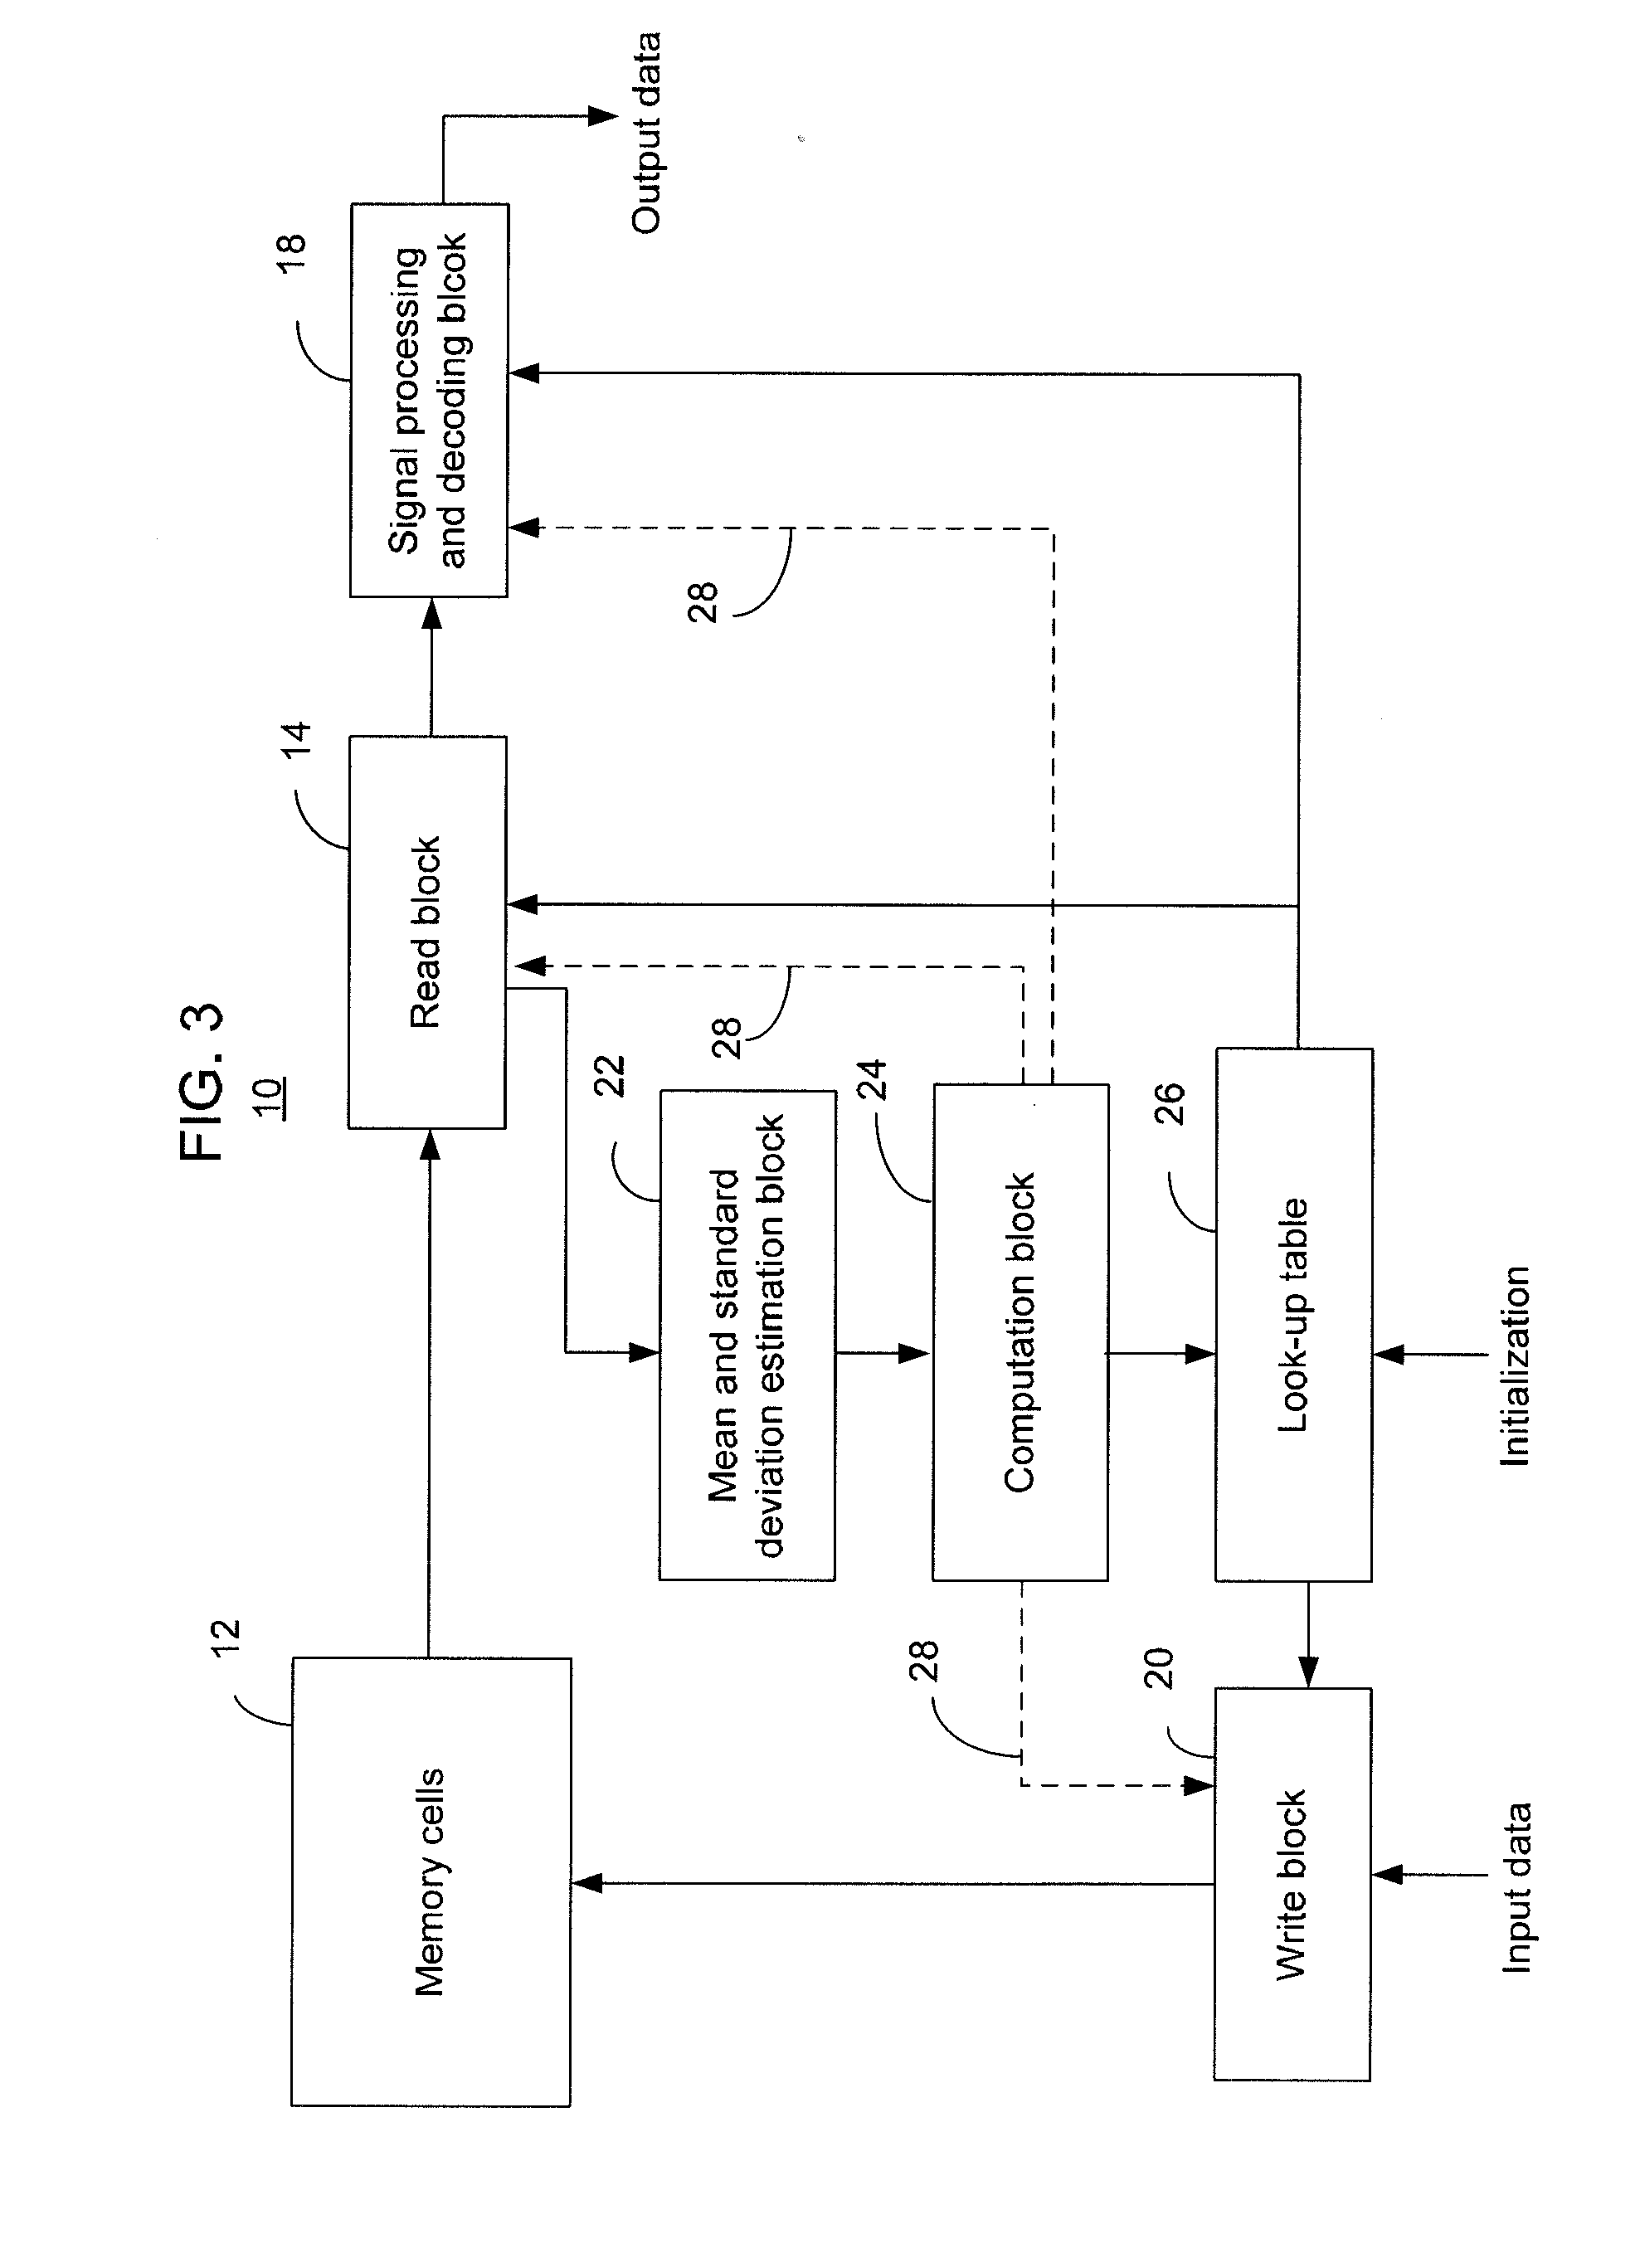
[0034]FIG. 3 depicts an adaptive read/write memory system in accordance with various embodiments of the present invention. The read/write memory system (herein “system”) 10, as in conventional read/write memory systems, may include memory cells 12, which may be multi-level flash memory cells, a read block 14, a signal processing and decoding block 18, and write block 20. However, unlike conventional systems, the system 10 may further include a mean and standard deviation estimation block 22, a computation block 24, and a look-up table 26, operationally coupled together. One or more of the components depicted, such as the mean and standard deviation estimation block 22 and the computation block 24, may be implemented using hardware components, such as, for example, application specific integrated circuit (ASIC), and/or software.
[0035] In brief, and as will be described in greater detail herein, the mean and standard deviation estimation block (herein “estimation block”) 22 may be configured to calculate estimated mean and standard deviation values of level distributions of the memory cells 12 during, for example, a read operation of the memory cells 12. The computation block 24 may be configured to compute optimal or near optimal mean and detection threshold values based on the estimated mean and standard deviation values provided by the estimation block 22. As will be described herein, the optimal or near optimal mean values computed may be used in order to adaptively write data into the memory cells 12 while the detection threshold values computed may be used in order to adaptively read data stored in the memory cells 12.
[0036] The optimal or near optimal mean and detection threshold values computed by the computation block 24 and the estimated mean and standard deviation values calculated by the estimation block 22, in various embodiments of the present invention, may be stored in the look-up table26. The read block 14, the signal processing and decoding block 18, and the write block 20 may use selected values stored in and provided by the look-up table 26 to perform various operations. Alternatively, such values may be directly provided by the estimation block 22 and the computation block 24 as indicated by reference 28.
[0037] As briefly described above, the estimation block 22 may calculate estimated mean and standard deviation values of level distributions of the memory cells 12 during a read operation. The estimated mean and standard deviation values may be calculated as intermediate steps in order for the computation block 24 to eventually compute the optimal or near optimal mean and detection threshold values based, at least in part, on the estimated mean and standard deviation values. Estimated mean and standard deviation values may be calculated for each level distribution of a memory cell. In various embodiments and as will be described herein, the estimation of the mean and standard deviation values may be achieved via training or online adaptation.
[0038] For example, the estimated mean and standard deviation values may be calculated by using pilot memory cells having known or predetermined data. That is, certain memory cells 12 may be designated as pilot memory cells, where the data stored in these memory cells are predefined and known. The read block 14 may then exploit these pilot cells for estimating the mean and standard deviations as described in, for example, co-pending U.S. patent application Ser. No. 11/738,263, filed Apr. 20, 2007, entitled “Channel Estimation for Multi-Level Flash Memories Using Pilot Signals,” which is hereby incorporated by reference in its entirety for all purposes. Such a method for estimating the mean and standard deviations (i.e., variances) of level distributions of a memory cell is referred to herein as a “training” technique. Alternatively, online adaptation techniques may be employed for estimating the mean and standard deviations. For instance, the LMS (least-mean-squares) algorithm may be used to estimate the mean and standard deviations based on the data recovered from the memory cells.
[0039] Based on the estimated mean and standard deviation values calculated by the estimation block 22, the computation block 24 may compute optimal or near optimal mean and detection threshold values for a memory cell or a group of memory cells. Specifics on how the optimal or near optimal mean and detection threshold values may be computed will be described in detail herein. The calculated optimal or near optimal mean and detection threshold values may then be stored in look-up table 26. An example of look-up table 26 is depicted in FIG. 4. In particular, FIG. 4 depicts an exemplary table structure 40 of look-up table 26 of FIG. 3, in accordance with various embodiments of the present invention.
[0040] In table structure 40, the “block index” column 41 on the far left is in reference to a block of memory cells. The second and third columns 42 and 43 from the left are for estimated mean and standard deviation values calculated by the estimation block 22. The two columns 44 and 45 on the right are for the optimal or near optimal mean and detection threshold values as computed by the computation block 24. Thus, in this example, a block or a group of memory cells may be associated with common estimated mean and standard deviation values, as well as common optimal or near optimal mean and detection threshold values.
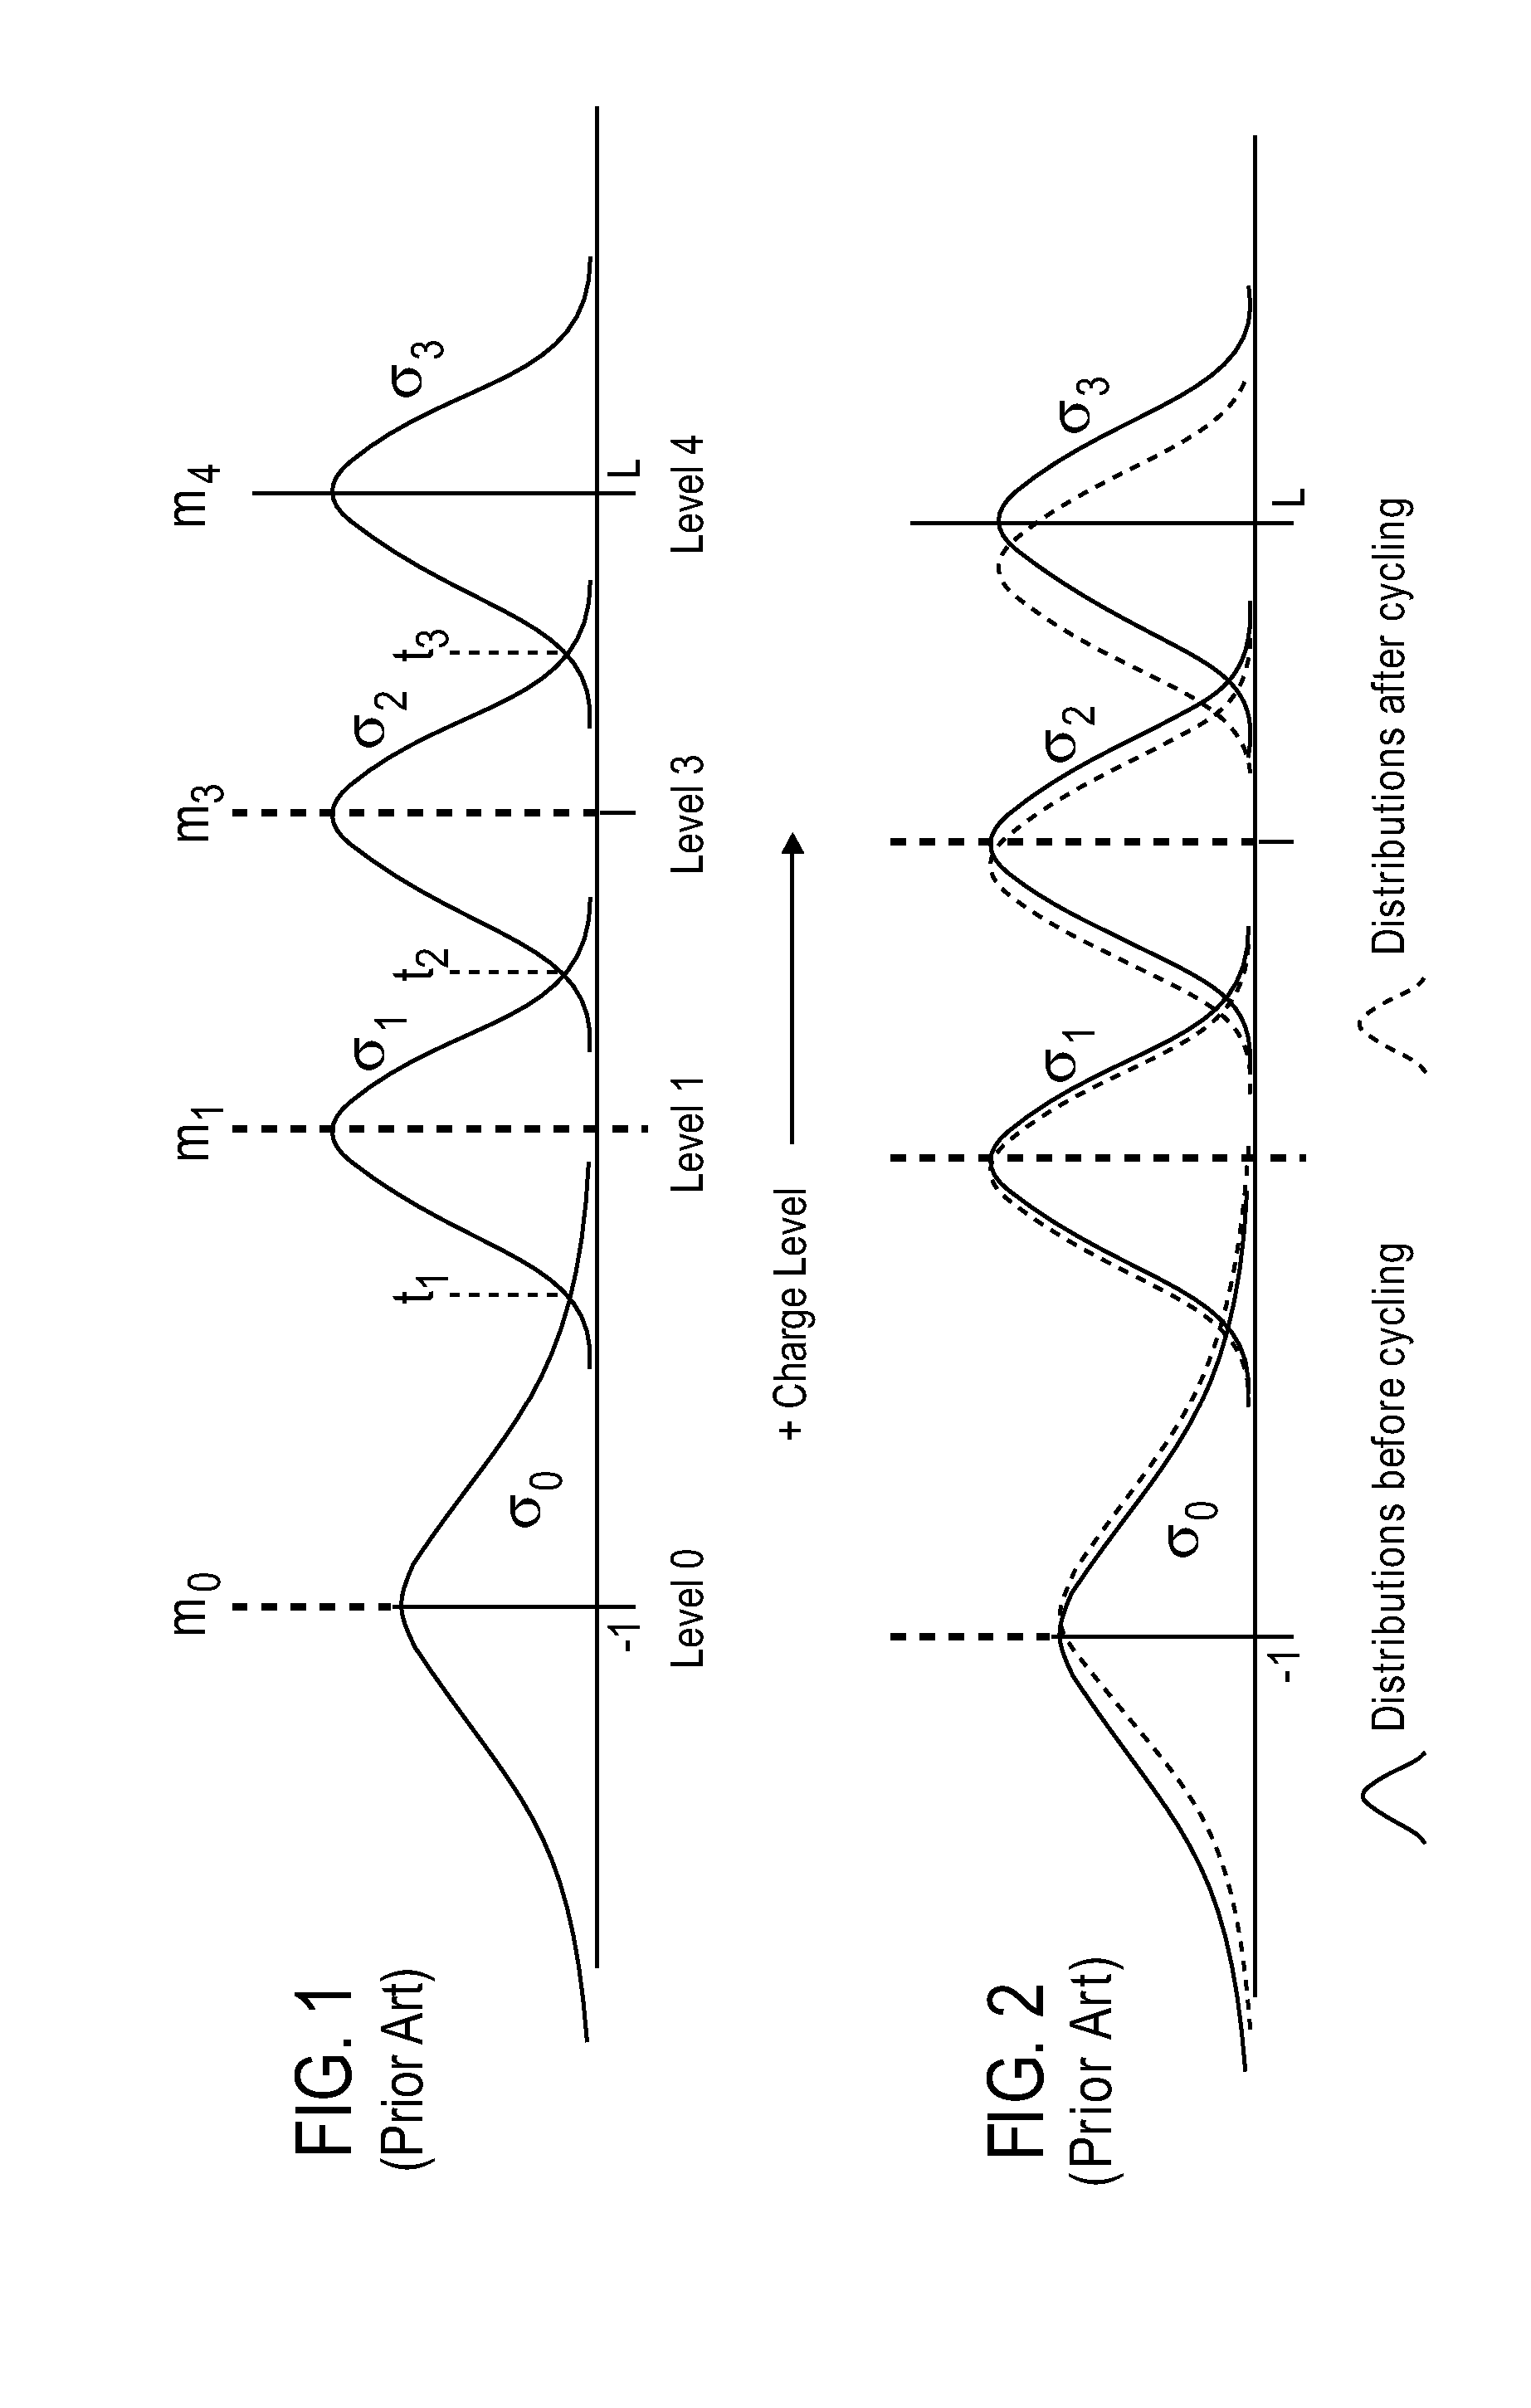
[0041] Since a multi-level memory cell may have multiple level distributions, multiple estimated mean and standard deviation values, as well as multiple optimal or near optimal mean and detection threshold values may be calculated and stored in the table structure 40 for a memory cell (in this example, for each group of memory cells). Thus, for the second and third columns, the “estimated mean values” column and the “estimated standard deviations” column, there are multiple mean (m0, m1, . . . ) and standard deviation (σ0, σ1, . . . ) values for each of the multiple levels of a multi-level cell (see FIG. 1). Similarly, there may be multiple values included in the fourth and fifth columns 44 and 45 for the “near optimal mean values” and the “near optimal detection thresholds.”
[0042] Although the computation block 24, in some embodiments of the present invention, may compute the optimal or near optimal mean and detection threshold values as soon as the estimated mean and standard deviations are calculated by the estimation block 22, as appears to be case in the above described embodiment, in some alternative embodiments, the optimal or near optimal mean and detection threshold values may be computed at some later time after the estimated mean values and estimated standard deviation values have already been stored in the table 26.
[0043] As described previously, the optimal or near optimal detection threshold values computed may be used during a read operation of one or more multi-level memory cells. In using the optimal or near optimal detection threshold values, error resulting from reading a degraded memory cell as a result of repeated cycling may be minimized.
[0044] Referring now to FIG. 5, an adaptive signal detection flow process for reading multi-level memory cells based, at least in part, on computed optimal or near optimal detection threshold values in accordance with various embodiments of the present invention is illustrated. The process 50 may begin when the latest estimated mean values and standard deviation values for level distributions of the multi-level memory cells are calculated at 52. The latest estimated mean values and standard deviation values may be calculated based on, for example, readback signals of pilot memory cells or online adaptation techniques as described previously.
[0045] Based at least on the estimated mean values and standard deviation values, optimal or near optimal detection threshold values may be computed at 54. The optimal or near optimal detection threshold values may be computed using a linear solution, which may be an approximate or near optimal solution, or Newton's method, which may be an optimal solution), both of which will be described in greater detail herein. Signal detection (i.e., reading) of the readback signal may then be performed using the estimated mean values and standard deviation values, and the computed near optimal detection threshold values at 56.
[0046] In contrast to the computed optimal or near optimal detection threshold values, the computed optimal or near optimal mean values may be used during a write operation to program a memory cell. That is, although optimal or near optimal mean values may be calculated (along with the near optimal detection threshold values) for a multi-level memory cell during or after a read operation of the multi-level memory cell, the optimal or near optimal mean values may not be used until a subsequent write (i.e., programming) operation of the memory cell. The computed optimal or near optimal mean values may be used to more reliably program multi-level memory cells during a write operation, particularly for example, those multi-level memory cells that have been repeatedly cycled.
[0047]FIG. 6 illustrates an adaptive flow process for a write operation of multi-level memory cells, according to various embodiments of the present invention. The process 60 may begin when a determination is made as to whether new optimal or near optimal mean values for the memory cells are available at 62. In some instances, new optimal or near optimal mean values for the memory cells may have already been calculated and stored, such as those that may be stored in look-up table 26. If so, the memory cells may be programmed (i.e., written) in accordance with the new optimal or near optimal mean values at 68. If not, then the most recent estimates of mean and standard deviation values for the level distributions of the memory cells are obtained either from the look-up table 26, or are calculated at 64. Based on the estimated mean and standard deviation values, new optimal or near optimal mean values are computed at 66 using a linear solution (i.e., near optimal solution) or Newton's method (i.e., optimal solution). After computing the optimal or near optimal mean values, the memory cells may be programmed (i.e., written) according to the optimal or near optimal mean values at 68.
[0048] In order to calculate optimal or near optimal mean and detection threshold values of multi-level memory cells, it is recognized that many parameters associated with multi-level memory cells including, for example, the means and standard deviations of the lowest and highest level distributions (e.g., the level distributions of level 0 and level 4 of FIG. 1) are functions of the memory cells and are not easily controllable. Given these values, however, it may be possible to optimize a read/write memory system by adjusting the means of level distributions (except for the means associated with the lowest and highest level distributions) during programming of the memory cells. In addition, for hard decision detection in a read operation, the detection threshold values may be optimized according to the current or most recent level distributions for minimum probability of error. In other words, optimal or near optimal mean and detection threshold values may be determined for write and read operations of multi-level memory cells in order to reduce error if certain parameters such as the means and standard deviations of the lowest and highest level distributions are assumed to be determined by the device characteristics.
[0049] In order to obtain an optimal solution for computing optimal mean and detection threshold values, reference is now made to FIG. 7, which depicts an exemplary 3-level threshold voltage distribution (“3-level distribution”). For this example, the respective standard deviations for the 3 level distributions are σ0, σ1, and σ2. For purposes of illustration, assume that the level distribution means fall in the range between 0 and L, where L is the distance or range between the mean of the lowest level distribution (i.e., the left-most level distribution in FIG. 7) and the mean of the highest level distribution (i.e., the right-most level distribution in FIG. 7). Then the mean of the middle level distribution may be denoted by d. Once d is given, the crossing points of the probability density functions (pdf's) may also be determined. In this example the distances of the crossing points from d are denoted by x0(d) and x1(d), respectively.
[0050] From signal detection theory, it is known that the optimal detection thresholds for multi-level memory cells are the crossing points of the pdf's. In the following, the pdf's are first shown to maintain the same value at the crossing points (i.e., detection thresholds) when minimum probability of error is achieved. The shaded areas in FIG. 7 correspond to the error regions. It is not difficult to see that the probability of making an error in detection is given by P e = ∫ d - x 0 ( d ) σ 0 ∞ N ( 0 , 1 ) + ∫ x 0 ( d ) σ 1 ∞ N ( 0 , 1 ) + ∫ x 1 ( d ) σ 1 ∞ N ( 0 , 1 ) + ∫ L - d - x 1 ( d ) σ 2 ∞ N ( 0 , 1 )
[0051] where N(0, 1) denotes the standard Gaussian distribution function with zero mean and variance 1. Taking the derivative of Pe with respect to d, it follows that ∂ P e ∂ d = 0 = g ( d - x 0 ( d ) σ 0 ) · 1 σ 0 · ∂ ( d - x 0 ( d ) ) ∂ d + g ( x 0 ( d ) σ 1 ) · 1 σ 1 · ∂ ( x 0 ( d ) ) ∂ d + g ( x 1 ( d ) σ 1 ) · 1 σ 1 · ∂ ( x 1 ( d ) ) ∂ d + g ( L - d - x 1 ( d ) σ 2 ) · 1 σ 2 · ∂ ( L - d - x 1 ( d ) ) ∂ d Eq . ( 1 )
where g ( x ) = 1 2 π ⅇ - x 2 / 2 .
Noting that g ( d - x 0 ( d ) σ 0 ) · 1 σ 0 = g ( x 0 ( d ) σ 1 ) · 1 σ 1 and g ( x 1 ( d ) σ 1 ) · 1 σ 1 = g ( L - d - x 1 ( d ) σ 2 ) · 1 σ 2
to obtain g ( d - x 0 ( d ) σ 0 ) · 1 σ 0 = g ( L - d - x 1 ( d ) σ 2 ) · 1 σ 2
[0052] The above equation is the result after canceling out the equal terms in Eq. (1). This completes the proof. Extensions to more than 3 levels are similar. For ease of reference, the above property will be referred to, herein, as “Equal Value Property.”
[0053] As an example, the “Equal Value Property” may be used to solve the optimization problem for a 4-level distribution, which is depicted in FIG. 8. For the 4-level distribution example depicted in FIG. 8, the mean range is between 0 and L, the means of the level distributions are denoted as m0, m1, m2, and m3, the detection thresholds for the level distributions are denoted as t1, t2, and t3, and the respective standard deviations of the level distributions are denoted as σ0, σ1, σ2, and σ3. The distances between the means and the detection thresholds, as depicted, are x, y, z, and w. In order to determine the optimal solutions for x, y, z, and w, the following set of equations may be used: { 1 σ 0 ⅇ - x 2 2 σ 0 2 = 1 σ 1 ⅇ - y 2 2 σ 1 2 = 1 σ 2 ⅇ - z 2 2 σ 2 2 = 1 σ 3 ⅇ - w 2 2 σ 3 2 x + 2 y + 2 z + w = L .
[0054] Numerical approaches may be used to solve the above equations. For example, the constraint in Eq. (2) may be integrated into Eq. (3) by defining a constant C viz: { 1 σ 0 ⅇ - x 2 2 σ 0 2 = 1 σ 1 ⅇ - y 2 2 σ 1 2 = 1 σ 2 ⅇ - z 2 2 σ 2 2 = 1 σ 3 ⅇ - w 2 2 σ 3 2 = C x + 2 y + 2 z + w = L Eq . ( 4 )
[0055] Now, C may be found by using Newton's method to solve f ( x ) = x + 2 y + 2 z + w - L = g ( σ 0 , C ) + 2 g ( σ 1 , C ) + 2 g ( σ 2 , C ) + g ( σ 3 , C ) - L . where g ( σ , C ) = σ - 2 ln ( σ C )
[0056] After taking the derivative of f(x) with respect to C, the following is obtained: ⅆ f ( x ) / ⅆ C = ⅆ ( x + 2 y + 2 z + w - L ) / ⅆ C = - σ 0 g ( σ 0 , C ) + - 2 σ 1 g ( σ 1 , C ) + - 2 σ 2 g ( σ 2 , C ) + - σ 3 g ( σ 3 , C ) .
[0057] Now, C can be found through the following iteration C n + 1 = C n - f ( C n ) f ′ ( C n ) .
[0058] The solution converges very fast for good initial values of C. Once C is solved, the x, y, z, and w values may easily follow. Thus, equation (2) and (3) may be used in order to obtain what has been referred to previously as, the optimal solution.
[0059] Although, the above solution may be very accurate, approximations may be used to simplify the computation and obtain a near optimal solution. For example, taking the logarithm of the first equation of Eq. (2), the following may be obtained: x 2 2 σ 0 2 = y 2 2 σ 1 2 + ln ( σ 1 σ 0 ) . Eq . ( 5 )
[0060] Note that for practical applications, the ratio between σ1 and σ0 is close to 1, which after taking the logarithm are negligible comparing to other terms in Eq. (5). Ignoring the term 1n ( σ 1 σ 0 ) ,
it follows that x σ 0 = y σ 1 .
[0061] Similar approximations also hold true for z and w. Thus, the near optimal solutions may be obtained as { x = σ 0 σ 0 + 2 σ 1 + 2 σ 2 + σ 3 L y = σ 1 σ 0 + 2 σ 1 + 2 σ 2 + σ 3 L z = σ 2 σ 0 + 2 σ 1 + 2 σ 2 + σ 3 L w = σ 3 σ 0 + 2 σ 1 + 2 σ 2 + σ 3 L .
[0062] These solutions may be referred to, for purposes of this description as linearized solutions and they are near optimal under practical operating conditions. That is, once x, y, z, and w are solved, approximate (i.e., near optimal) solutions may be determined for the mean and detection threshold values of 4-level memory cells. It should be noted, however, that the above formulation may be easily extended to any M number of levels for M≧2.
[0063] Based on the above near optimal solution, and once the estimated mean and standard deviations for all the distributions have been determined using, for example, pilot cells, it may be straightforward to find the near optimal detection threshold values. For example, if the estimated mean and standard deviation values of the level distributions for a 4-level (2 bit/cell) flash memory device are found to be {mi, i=0, 1, 2, 3} and {σi, i=0, 1, 2, 3}, respectively. Utilizing the linearized solution (i.e., near optimal solution), one may obtain: { t 1 = m 1 σ 0 + m 0 σ 1 σ 0 + σ 1 t 2 = m 2 σ 1 + m 1 σ 2 σ 1 + σ 2 t 3 = m 3 σ 2 + m 2 σ 3 σ 2 + σ 3
[0064] where t1, t2 and t3 are the near optimal signal detection thresholds. Thus, the near optimal detection thresholds, t1, t2 and t3, of a 4-level multi-level memory may be solved using the above equations. If more accuracy is desired, exact solutions may always be found by utilizing the Equal Value Property through the Newton's method illustrated previously.
[0065] The near optimal mean values for multi-level memory cells may be obtained as follows. For a M level memory cell, assume that the estimated voltage means are denoted as {mi,i=0, 1, . . . M−1} and the corresponding standard deviations as {σi, i=0, 1, . . . M−1}. Due to physical reasons and as previously alluded to, the mean values corresponding to the lowest (m0) and highest levels (mM-1) and the standard deviations are not easily controllable, thus such values are assumed to be predefined and set. However, the values of mi, i=1, 2, . . . , M−2 may be adjusted for optimal performance. By denoting L=mM-1−m0 and utilizing the linearized solutions, the near optimal mean value ({tilde over (m)}) for the i-th level is given by m ~ i = m 0 + σ 0 + 2 ∑ k = 1 i - 1 σ k + σ i σ 0 + 2 ∑ k = 1 M - 2 σ k + σ M - 1 L Eq . ( 6 )
[0066] Thus, the above equation may be used to solve for near optimal mean values of M-level distribution memory cells in accordance with various embodiments of the present invention. Alternatively, the Newton's method may be used for more accuracy.
[0067] Although specific embodiments have been illustrated and described herein, it will be appreciated by those of ordinary skill in the art and others, that a wide variety of alternate and/or equivalent implementations may be substituted for the specific embodiments illustrated and described without departing from the scope of the present invention. This application is intended to cover any adaptations or variations of the embodiments discussed herein. Therefore, it is manifested and intended that various embodiments of the invention be limited only by the claims and the equivalents thereof.
PUM


Description & Claims & Application Information
We can also present the details of the Description, Claims and Application information to help users get a comprehensive understanding of the technical details of the patent, such as background art, summary of invention, brief description of drawings, description of embodiments, and other original content. On the other hand, users can also determine the specific scope of protection of the technology through the list of claims; as well as understand the changes in the life cycle of the technology with the presentation of the patent timeline. Login to view more.