Expression quantification using mass spectrometry

Inactive Publication Date: 2008-08-28
DH TECH DEVMENT PTE
View PDF43 Cites 35 Cited by
  • Summary
  • Abstract
  • Description
  • Claims
  • Application Information

AI Technical Summary

Benefits of technology

[0032]In various embodiments the present teachings can elucidation of basic biology and cell signaling, for example, by facilitating the ability to quantitatively measure amount of a protein or proteins involved in a pathway; e.g., a labeled control standard being created from a “resting state” sample and being added into labeled perturbed state samples to facilitate quantitatively measuring changes in protein expression between resting and perturbed states.
[0033]In various embodiments the present teachings can facilitate drug discovery, for example, by facilitating the determination of the biological pathways effected by an agent. For examp

Problems solved by technology

However, protein expression is not reliably predictable.
First, protein expression is not predictable from mRNA expression maps because mRNA transcript levels are not always strongly correlated with protein levels.
Second, proteins are dynamically modified

Method used


Image

  • Expression quantification using mass spectrometry
  • Expression quantification using mass spectrometry
  • Expression quantification using mass spectrometry

Examples


Example

Example 1

P450 Isoforms

[0105]In this example, absolute quantitation of a set of sixteen P450 isoforms is shown. This example can provide, for example, an assay for multiple P450 isoforms conductible in a single experimental run. Peptides specific to individual P450 isoforms were synthesized, labeled with a stable isotope tag (light Cleavable ICAT Reagent) and purified by HPLC to provide labeled signature peptide standard samples. These standard peptide samples were used to create a concentration curve using quantitative Multiple Reaction Monitoring (MRM) scans. Mouse liver microsome samples, control (CT) and phenobarbital induced (IND) were then labeled with heavy cleavable ICAT reagents. Phenobarbital (PB) is often used as a representative chemical for industrial solvents, pesticides, etc and is known to induce several P450 genes in subfamilies 2a, 2b, 2c and 3a. Control and Induced samples were loaded separately on the chromatographic column. Prior to loading on the chromatographic...

Example

Example 2

P450 Isoforms

[0123]In this example, absolute quantitation of a set of sixteen P450 isoforms is shown where the control and induce samples were combined (without the addition of signature peptide internal standard samples) and loaded on to the chromatographic column. This example can also provide, for example, an assay for multiple P450 isoforms conductible in a single experimental run. This example used a portion of the same control and induced samples, before said samples were labeled, used in Example 1. The labeled signature peptide samples used in Example 2 were the same samples used in Example 1.

[0124]In Example 2, mouse liver microsome samples, control (CT) and phenobarbital induced (IND) were then labeled, respectively, with light cleavable and heavy cleavable ICAT reagents. Comparison of the chromatographic areas of the light and heavy peptide in a sample to the concentration curve provided quantitative information on the level of each P450 investigated in the contro...

Example

Example 3

Plasma Proteins

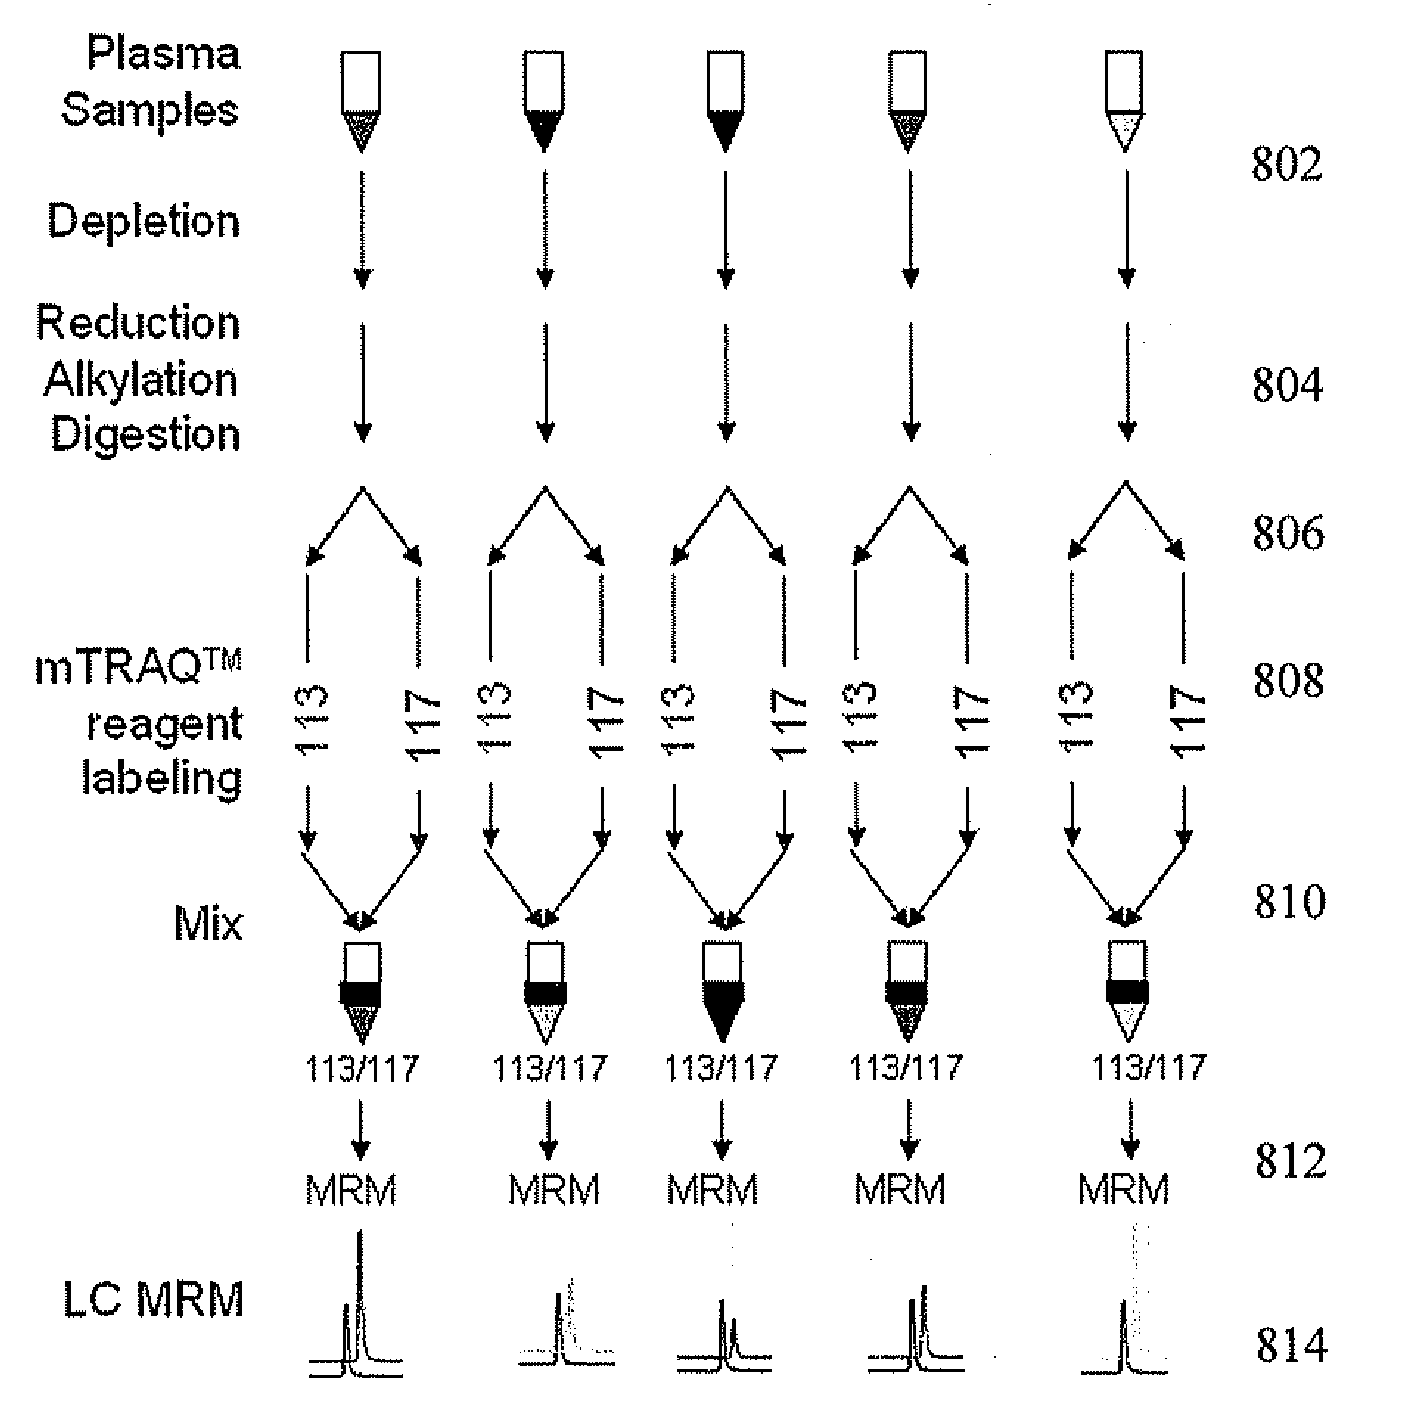
[0138]In this example, forty-one of about the most abundant proteins in blood plasma were studied according to various embodiments of the present teachings and signature peptides and MRM transitions determined for the relative and / or absolute quantification of these proteins.

[0139]Mass Analyzer System

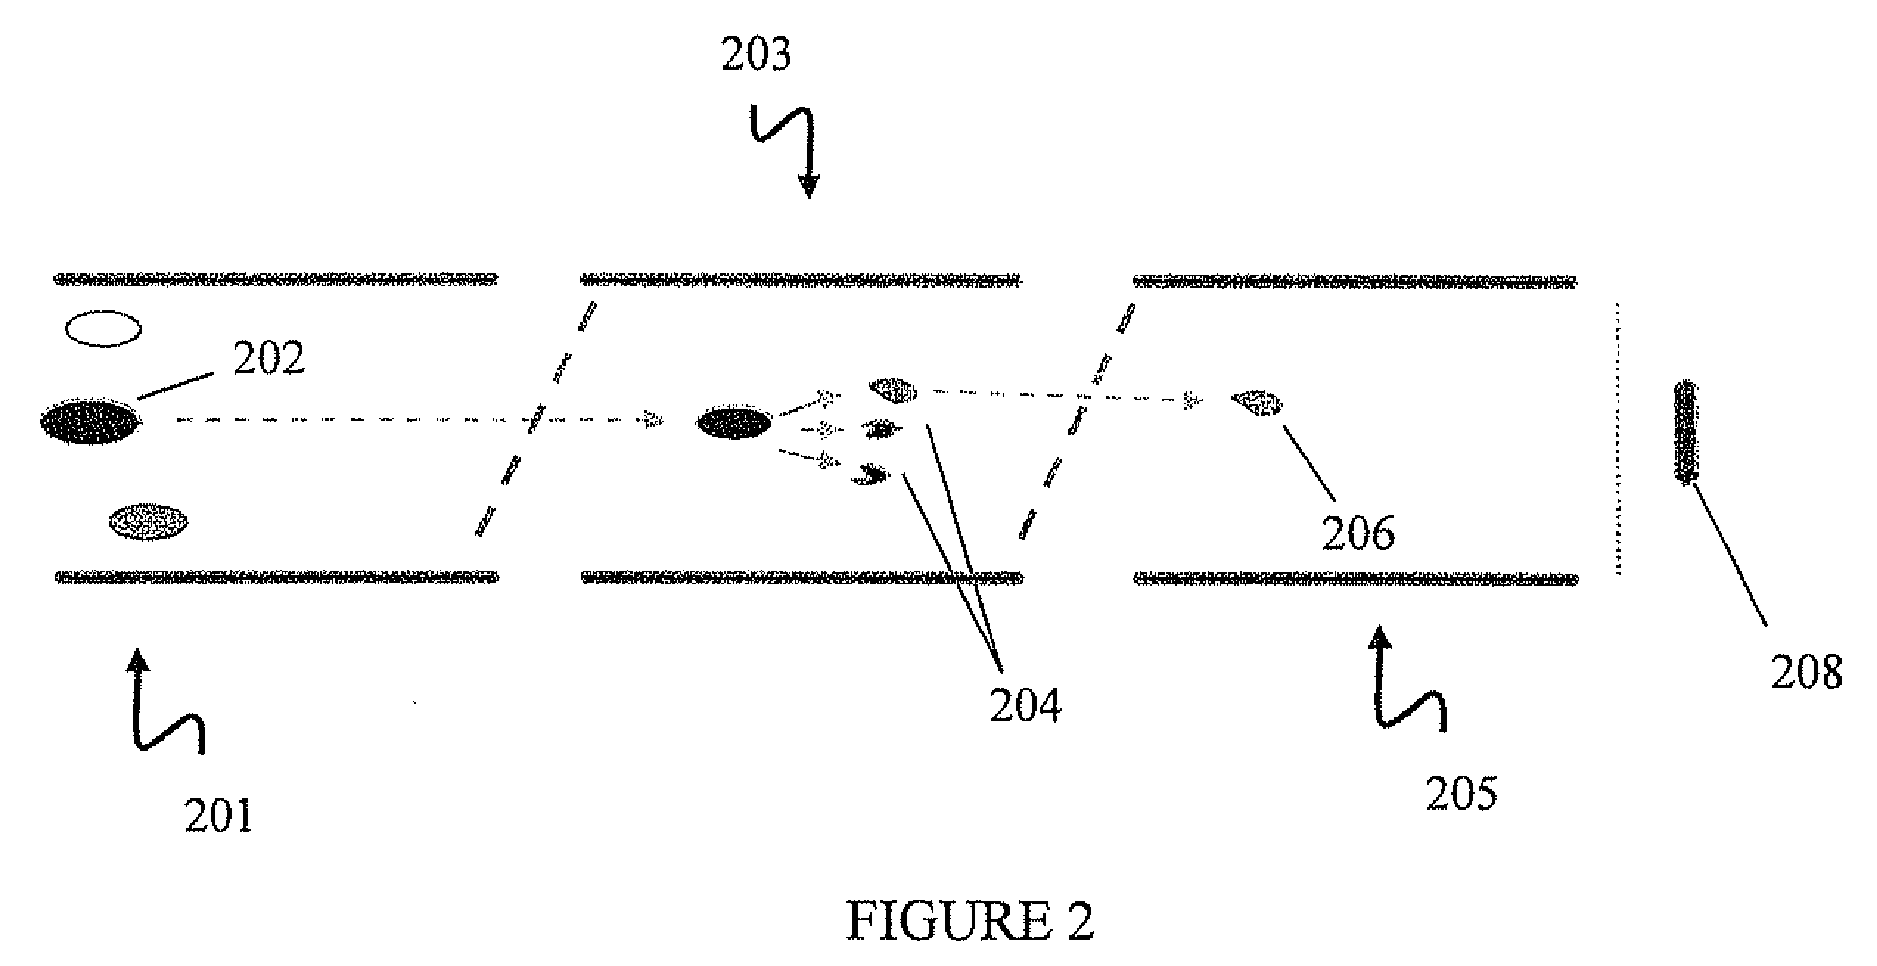
[0140]A liquid chromatography (LC) mass spectrometry (MS) system was used to analyze samples of this example. Samples were separated by reverse phase HPLC on a PepMap C18 column (75 μm×15 cm, LC Packings) using a 30 minute gradient (5-35% acetonitrile in 0.1% formic acid). MRM analysis was performed using a MS system with a NanoSpray™ source on a 4000 Q TRAP® system (Applied Biosystems, Inc., Foster City, Calif.) (Q1—0.5-0.7 m / z mass window, Q3—0.5-0.7 m / z mass window) and / or a QSTAR® system (Applied Biosystems, Inc., Foster City, Calif.) (Q1—0.5-0.7 Dalton (Da) mass window, Q3—0.5-0.7 Da mass window) as noted in this example. A simplified schematic diagram of th...


PUM


Abstract

In various aspects, the present teachings provide systems, methods, assays and kits for the absolute quantitation of protein expression. In various aspects, the present teachings provide methods of determining the concentration of about the top forty-one proteins present in human plasma. In various aspects, the present teachings provide methods of determining the absolute concentration of one or more proteins using standard samples of signature protein fragments and parent-daughter ion transition monitoring (PDITM). In various embodiments, the absolute concentration of multiple isoforms of a biomolecule in a sample, multiple proteins in a biological process, a combination of multiple samples, or combinations thereof, can be determined in a multiplex fashion using the present teachings. In various aspects, provided are methods of assessing the state of a biological system including, but not limited to, the disease state of an animal.

Description

CROSS-REFERENCE TO RELATED APPLICATIONS[0001]The present application is a continuation-in-part of and claims the benefit of and priority to copending U.S. application Ser. No. 11 / 441,457, entitled “Expression Quantification Using Mass Spectrometry”, filed May 25, 2006, and claims the benefit of and priority to U.S. application Ser. No. 11 / 134,850, entitled “Expression Quantification Using Mass Spectrometry”, filed May 19, 2005, which claims the benefit of and priority to U.S. Provisional Application No. 60 / 572,826, entitled “Expression Quantification Using Mass Spectrometry”, filed May 19, 2004, the entire disclosures of all of which are herein incorporated by reference.INTRODUCTION[0002]Understanding protein expression is important to understanding biological systems. Unlike mRNA, which only acts as a disposable messenger, proteins implement almost all controlled biological functions and, as a result, are integral to such functions as normal cell activity, disease processes, and dr...

Claims


Application Information

Patent Timeline
IPC IPC(8): G01N33/68C12Q1/00
CPCG01N33/68G01N2333/90209G01N33/6851G01N33/6848
Inventor HUNTER, CHRISTIE L.
Owner DH TECH DEVMENT PTE
Why Eureka
Try Eureka