Expression Quantification Using Mass Spectrometry
a mass spectrometry and quantification technology, applied in the field of expression quantification using mass spectrometry, can solve the problems of affecting the elucidation of basic biology, the inability to reliably predict protein expression from mrna expression, and the traditionally difficult implementation of the technique, so as to facilitate the discovery, verification and/or validation of biomarkers, and facilitate drug discovery.
- Summary
- Abstract
- Description
- Claims
- Application Information
AI Technical Summary
Benefits of technology
Problems solved by technology
Method used
Image
Examples
example 1
P450 Isoforms
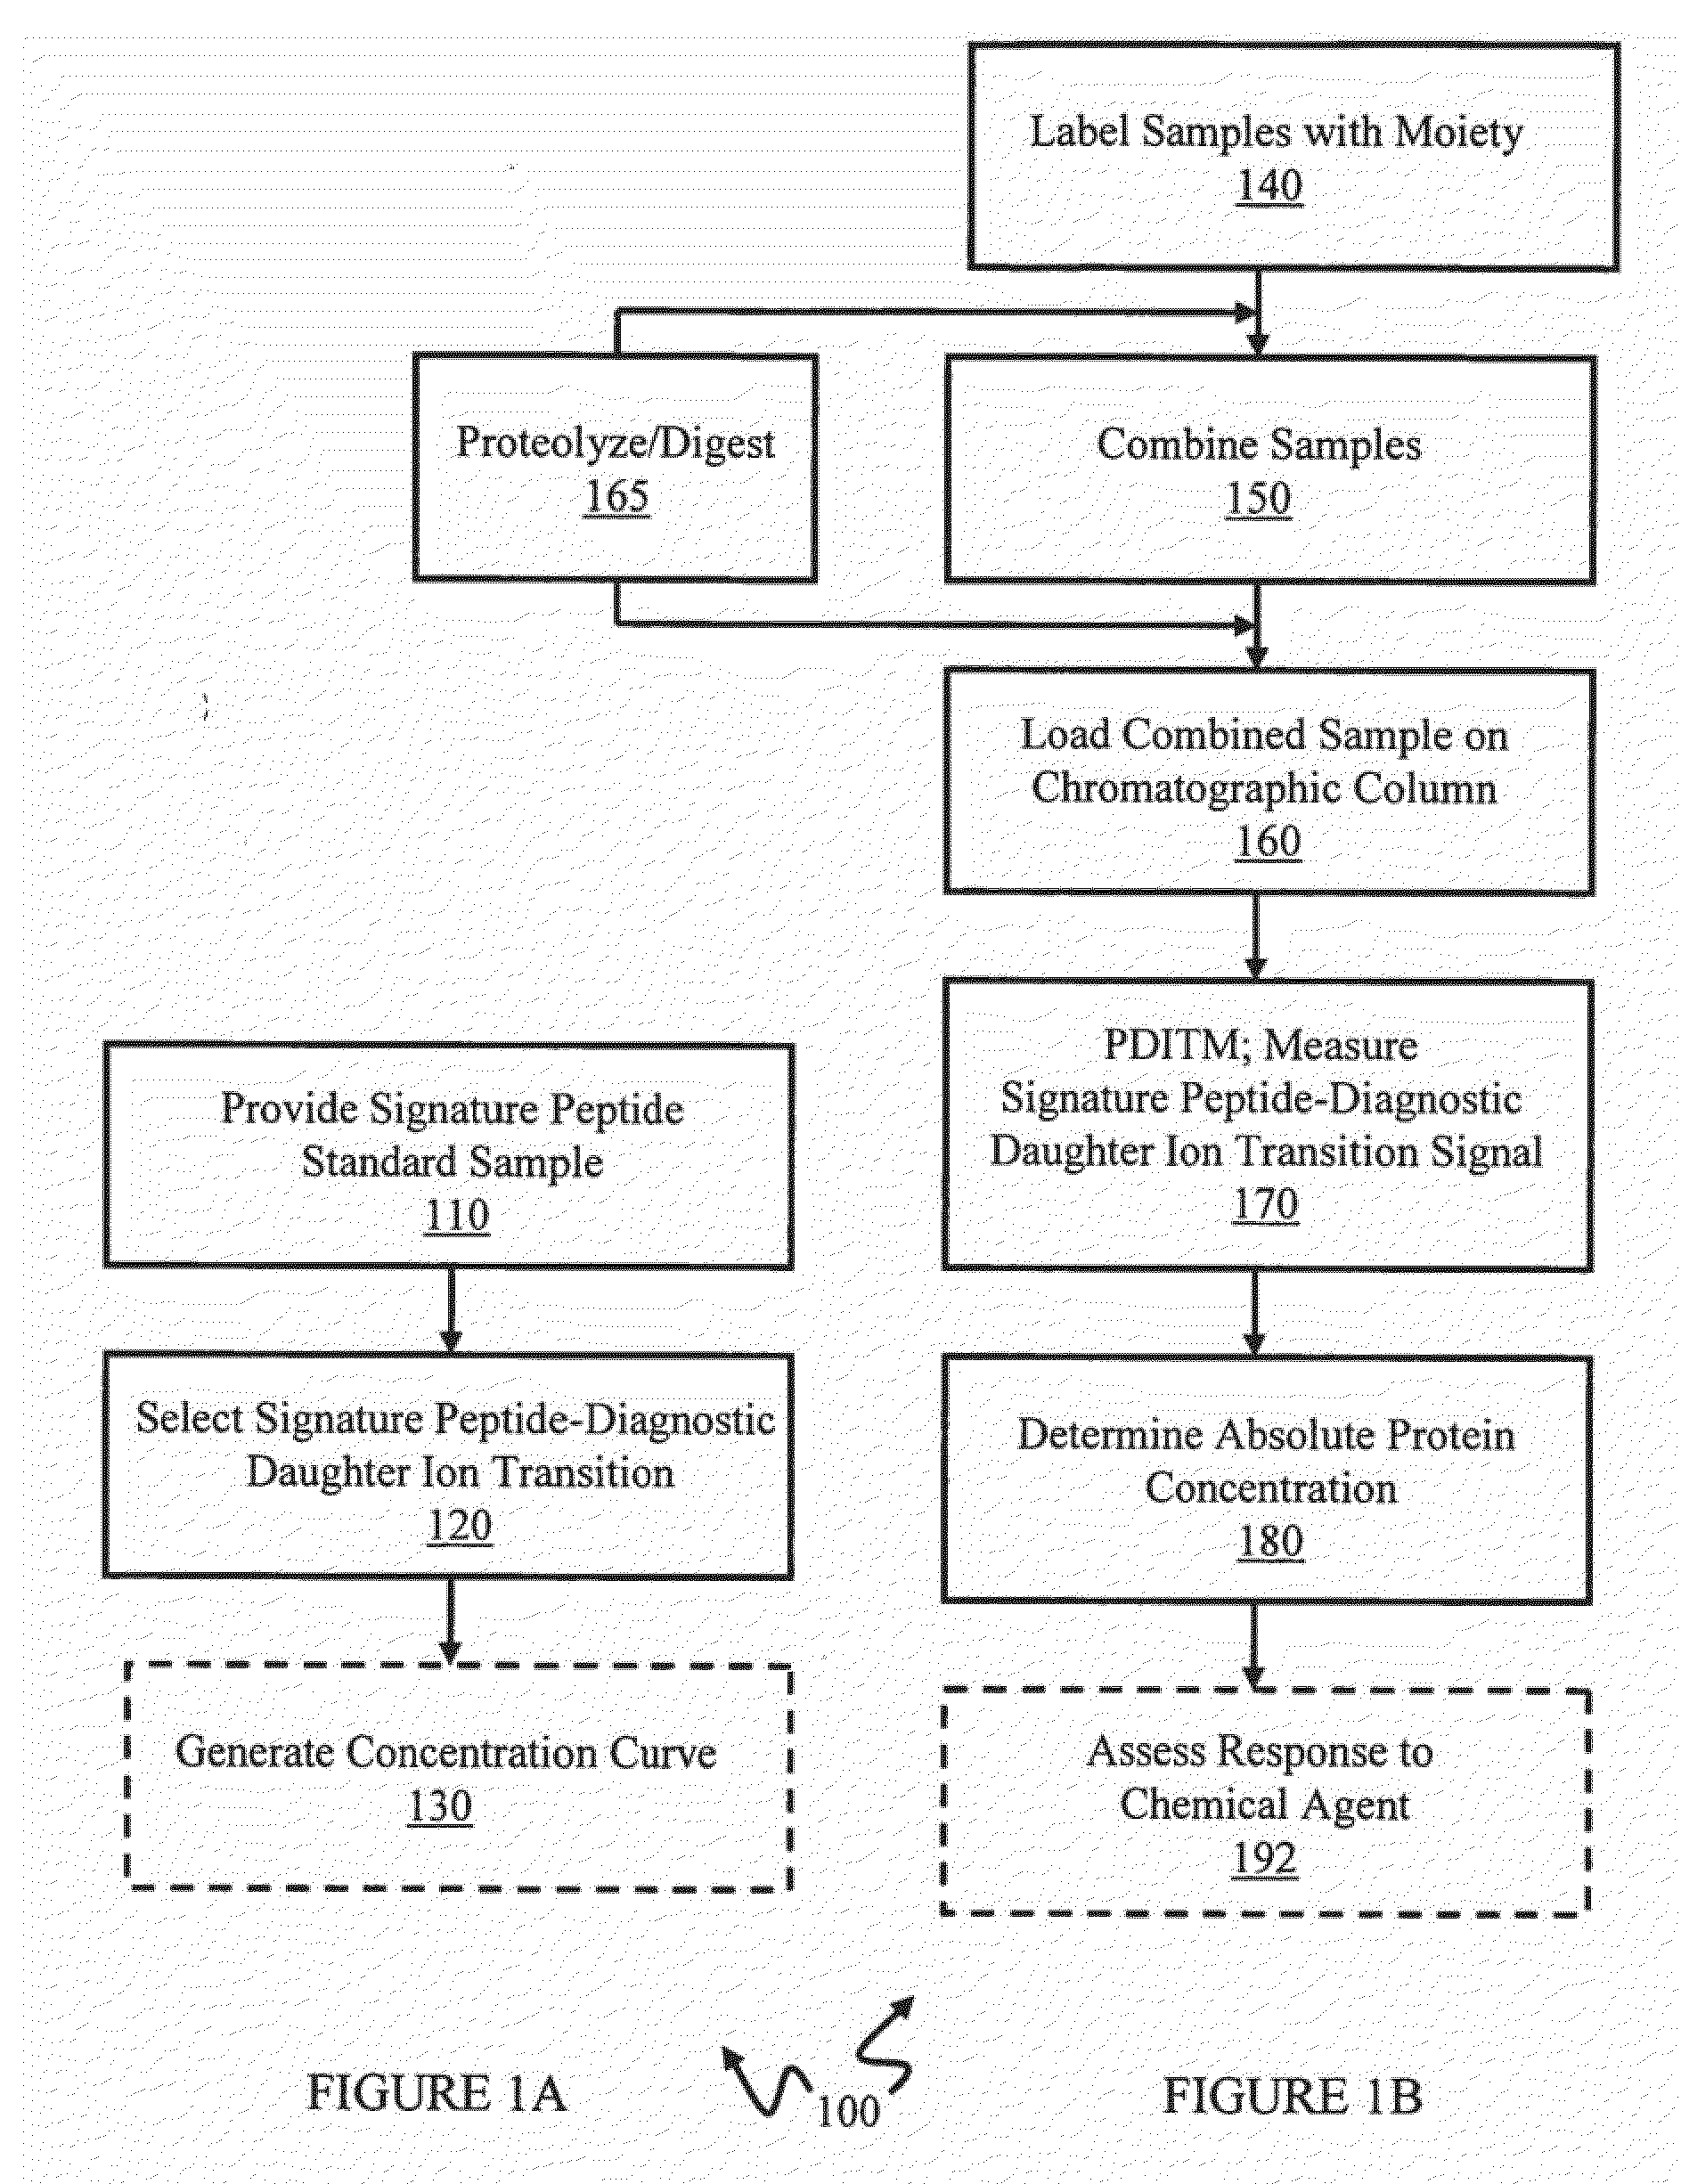
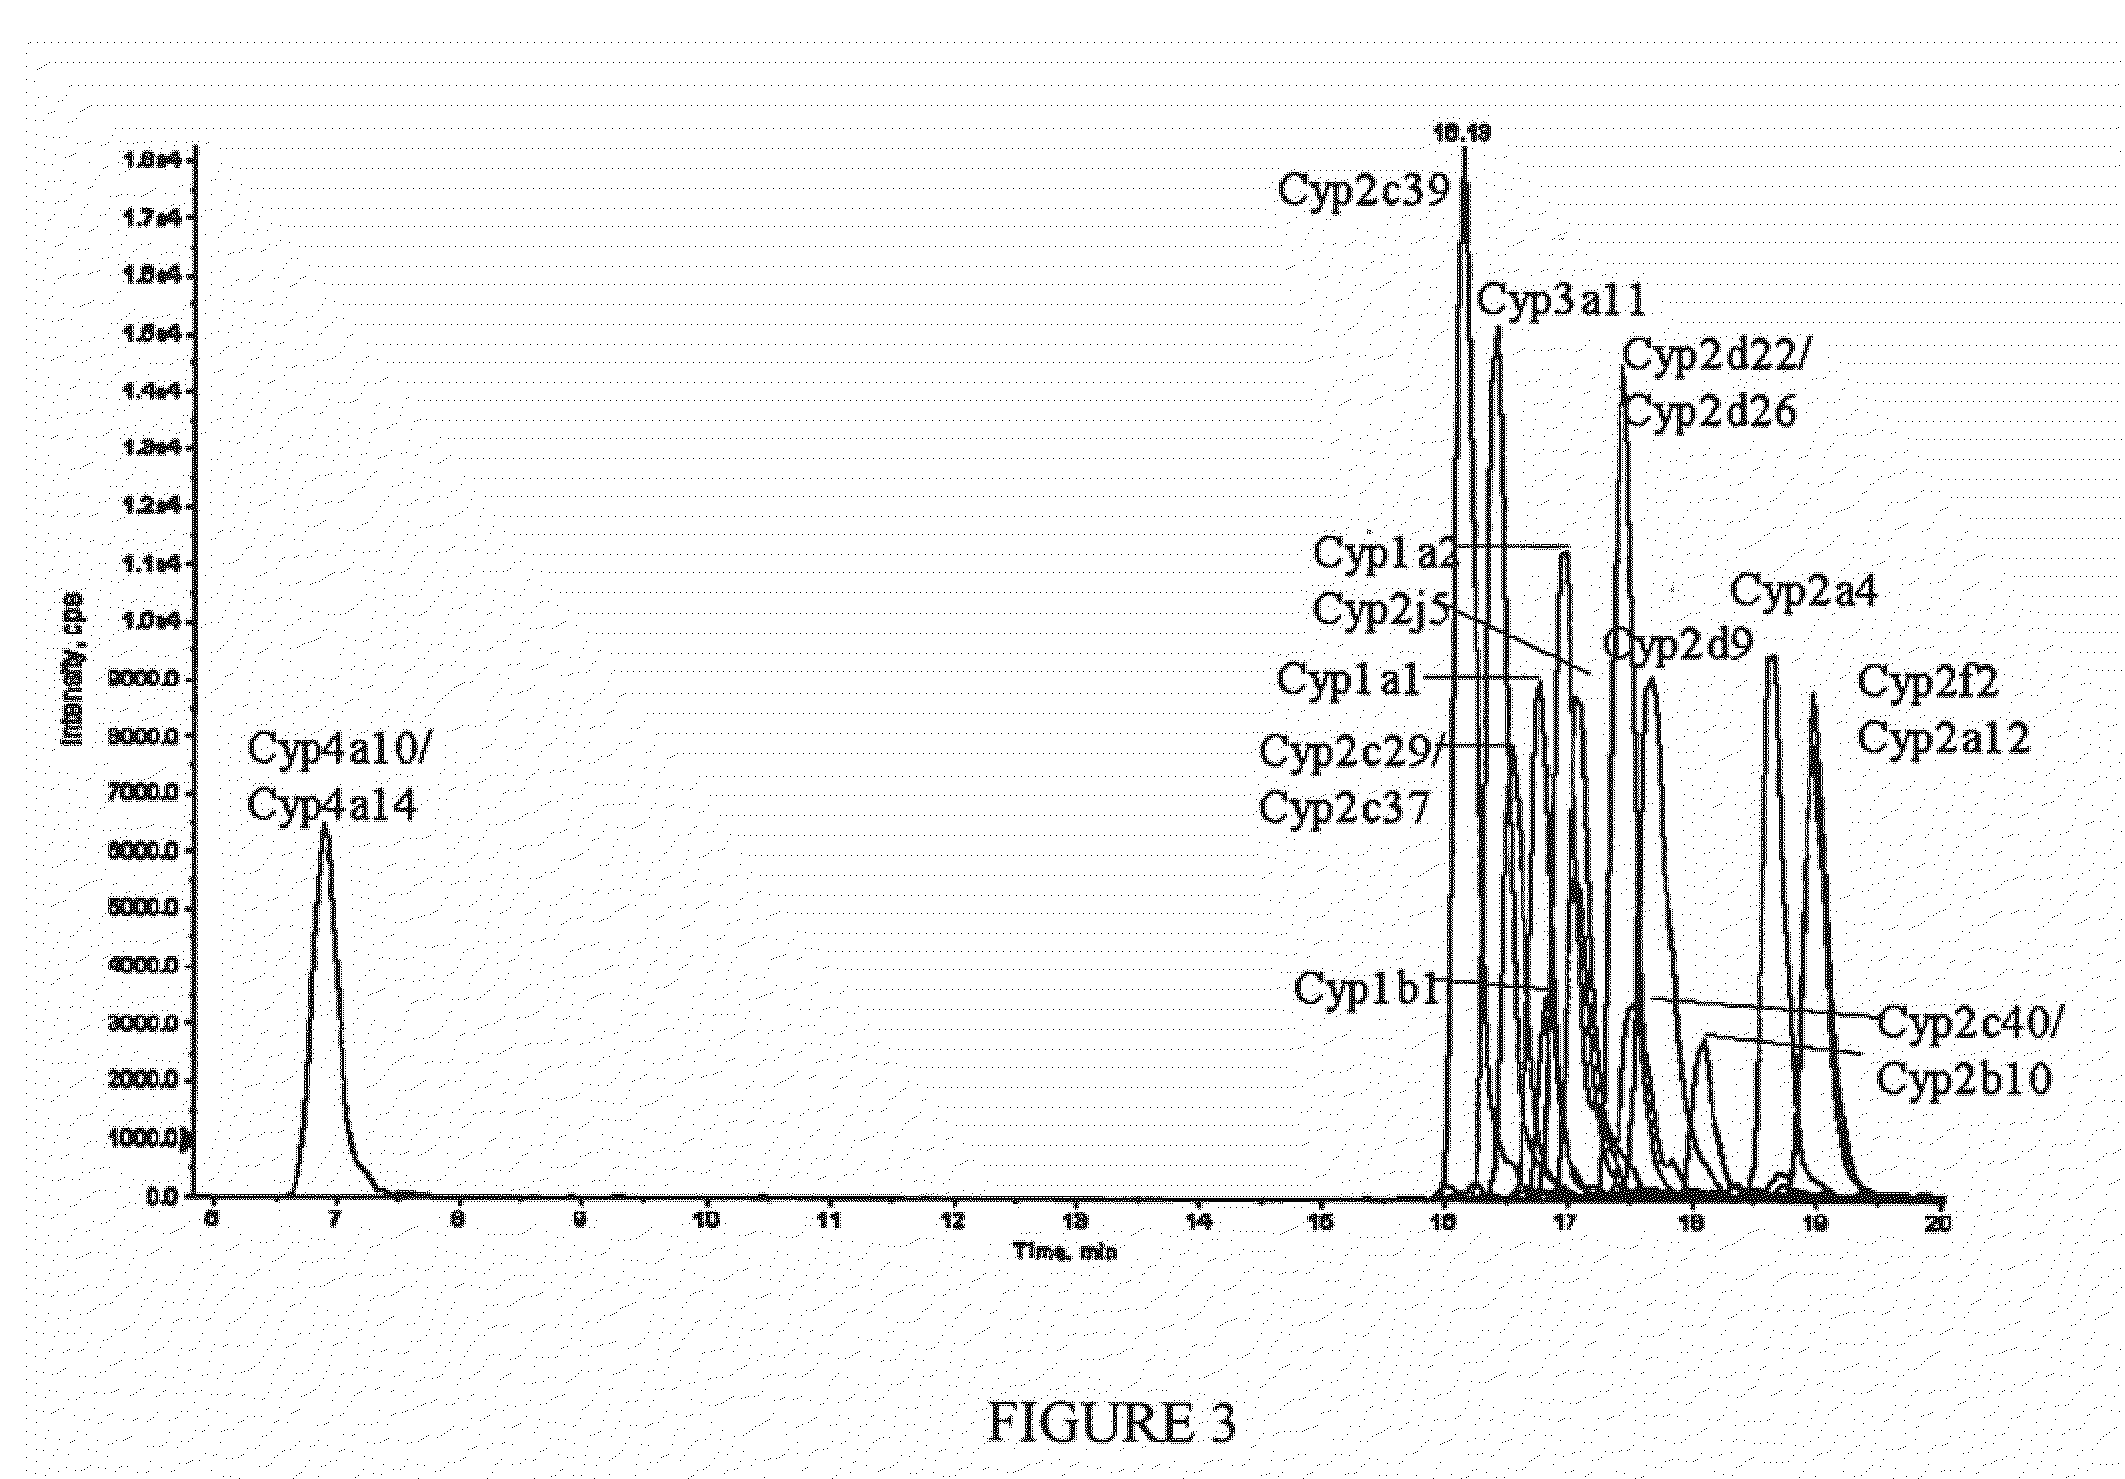
[0095]In this example, absolute quantitation of a set of sixteen P450 isoforms is shown. This example can provide, for example, an assay for multiple P450 isoforms conductible in a single experimental run. Peptides specific to individual P450 isoforms were synthesized, labeled with a stable isotope tag (light Cleavable ICAT Reagent) and purified by HPLC to provide labeled signature peptide standard samples. These standard peptide samples were used to create a concentration curve using quantitative Multiple Reaction Monitoring (MRM) scans. Mouse liver microsome samples, control (CT) and phenobarbital induced (IND) were then labeled with heavy cleavable ICAT reagents. Phenobarbital (PB) is often used as a representative chemical for industrial solvents, pesticides, etc and is known to induce several P450 genes in subfamilies 2a, 2b, 2c and 3a. Control and Induced samples were loaded separately on the chromatographic column. Prior to loading on the chromatographic column, ...
example 2
P450 Isoforms
[0113]In this example, absolute quantitation of a set of sixteen P450 isoforms is shown where the control and induce samples were combined (without the addition of signature peptide internal standard samples) and loaded on to the chromatographic column. This example can also provide, for example, an assay for multiple P450 isoforms conductible in a single experimental run. This example used a portion of the same control and induced samples, before said samples were labeled, used in Example 1. The labeled signature peptide samples used in Example 2 were the same samples used in Example 1.
[0114]In Example 2, mouse liver microsome samples, control (CT) and phenobarbital induced (IND) were then labeled, respectively, with light cleavable and heavy cleavable ICAT reagents. Comparison of the chromatographic areas of the light and heavy peptide in a sample to the concentration curve provided quantitative information on the level of each P450 investigated in the control sample ...
PUM
| Property | Measurement | Unit |
|---|---|---|
| concentration | aaaaa | aaaaa |
| concentrations | aaaaa | aaaaa |
| affinity | aaaaa | aaaaa |
Abstract
Description
Claims
Application Information
 - R&D
- Intellectual Property
- Life Sciences
- Materials
- Tech Scout
- Unparalleled Data Quality
- Higher Quality Content
- 60% Fewer Hallucinations
Browse by: Latest US Patents, China's latest patents, Technical Efficacy Thesaurus, Application Domain, Technology Topic, Popular Technical Reports.
© 2025 PatSnap. All rights reserved.Legal|Privacy policy|Modern Slavery Act Transparency Statement|Sitemap|About US| Contact US: help@patsnap.com


