
Method and apparatus for characterizing the key properties and analyzing the future performance of an investment portfolio

a portfolio and key property technology, applied in the field of key property characterization and investment portfolio future performance analysis, can solve the problems of not providing verifiable and accurate tools, many are not useful, and many are not, and achieve the effect of increasing the correlation, increasing and reducing the diversification of the portfolio

Inactive Publication Date: 2010-09-16
CONSIDINE GEOFF
View PDF3 Cites 41 Cited by
  • Summary
  • Abstract
  • Description
  • Claims
  • Application Information

AI Technical Summary

Benefits of technology

[0014]For example, one can identify the relative diversification of an investment portfolio by determining how correlated the investment portfolio is to other core asset classes or investment styles. For an investment portfolio that tracks the performance of one or more core asset classes or investment styles, adding more of these core asset classes or investment styles increases this correlation (or reduces the diversification in the portfolio). Alternatively, for an investment portfolio that has no relationship between the performance of one or more core asset classes or investment styles, adding more of these core asset classes or investment styles increases the diversification in the portfolio. By identifying these correlations, one can then take any desired action to modify one's portfolio to obtain the desired results, such as increasing the diversification of one's portfolio by adding more of the investments that indicate little correlation between the portfolio and these investments. Alternatively, one can add more of those investments that have a high correlation with the portfolio to increase the likelihood that one's portfolio will track certain investments.

Problems solved by technology

Some of these tools are useful, many are not.
While tools to predict the future performance of an investment exist, such as Fama-French factors, related fundamental factors, and momentum, none of these tools provide verifiable and accurate results.
Outside of the challenging problem of prediction, there are more mundane issues having to do with creating metrics that fully characterize a portfolio.
While the concept of portfolio diversification is well known, there is no standard metric for the degree of diversification in a portfolio.
Style analysis partly captures diversification benefits between portfolio components, but style analysis does not directly yield a measure of diversification.
Style Analysis provides a strategic asset allocation tool, but does not help in timing of an investment.
They do not provide useful information as to what occurs if a series of these individual investments are then combined into a portfolio, or when to modify that portfolio.
Finally, the traditional tools analyze specific types of investments—such as mutual funds, stocks or ETFs—as if they are different types from a portfolio perspective and they cannot be compared directly.
Consequently, an investor thinking of investing in a group of stocks has no way of comparing that investment to an investment in a mutual fund.

Method used


Image

  • Method and apparatus for characterizing the key properties and analyzing the future performance of an investment portfolio
  • Method and apparatus for characterizing the key properties and analyzing the future performance of an investment portfolio
  • Method and apparatus for characterizing the key properties and analyzing the future performance of an investment portfolio

Examples


case 1

[0188] Ford Dec. 31, 2007, 12 month prediction

[0189]In this example, we generated a twelve-month outlook for Ford Motor Company (F), with a twelve-month look-back period. We constrained the tool to use data available only up to and including Dec. 31, 2007. The input screen is shown in FIG. 12.

[0190]We have chosen to use six core asset classes 121, and the Database 122 used for the historical market data is called PR1, which is from where the historical stock data can be found). The ticker 123 for Ford is F. We used eleven years (132 months) of data 124, and this was chosen so that one could have ten years of test data (the first twelve months being used to generate parameters for the first forecast 125). More data is good as it provides more samples for the model. We used twelve years of data 126 in our validations. The model uses monthly data, so having the Last Date be Jan. 1, 2008 means that the model had Dec. 31, 2007 as its final data point 127. Button 128 can be used to select...

case 2

[0197] VFINX Dec. 31, 2007, 12 month prediction

[0198]VFINX is the Vanguard S&P 500 index fund. We performed an analysis showing what the tool would have shown as of Dec. 31, 2007, i.e., the outlook for 2008 (see FIG. 15). The current state for VFINX as of the end of 2007 was State Three 151 (see text at top of screen). In State Three, the S&P 500 has averaged 0.8% (less than 1% in return) 152 over the subsequent twelve months. The one-SD loss has been −14.98% 153. This means that investors who put their money into VFINX in this state have averaged less than 1% in return for the next year, and not infrequently lost 15%. The only worse state to buy VFINX is State Two 154.

[0199]When do you want to buy VFINX? States Zero and One are goods times to buy VFINX as they average substantial returns over the next twelve months (i.e., 21.8% and 11.9%). This is a momentum play. State Zero and State One mean that the S&P 500 has been doing very well relative to other asset classes for the last tw...

case 3

[0203] General Electric Dec. 31, 2007, Twelve Month Prediction

[0204]This is a similar case, but for General Electric (GE). We are looking at what the model would have shown us at the start of 2008. The current state at that time was State Four 161 as shown in FIG. 16.

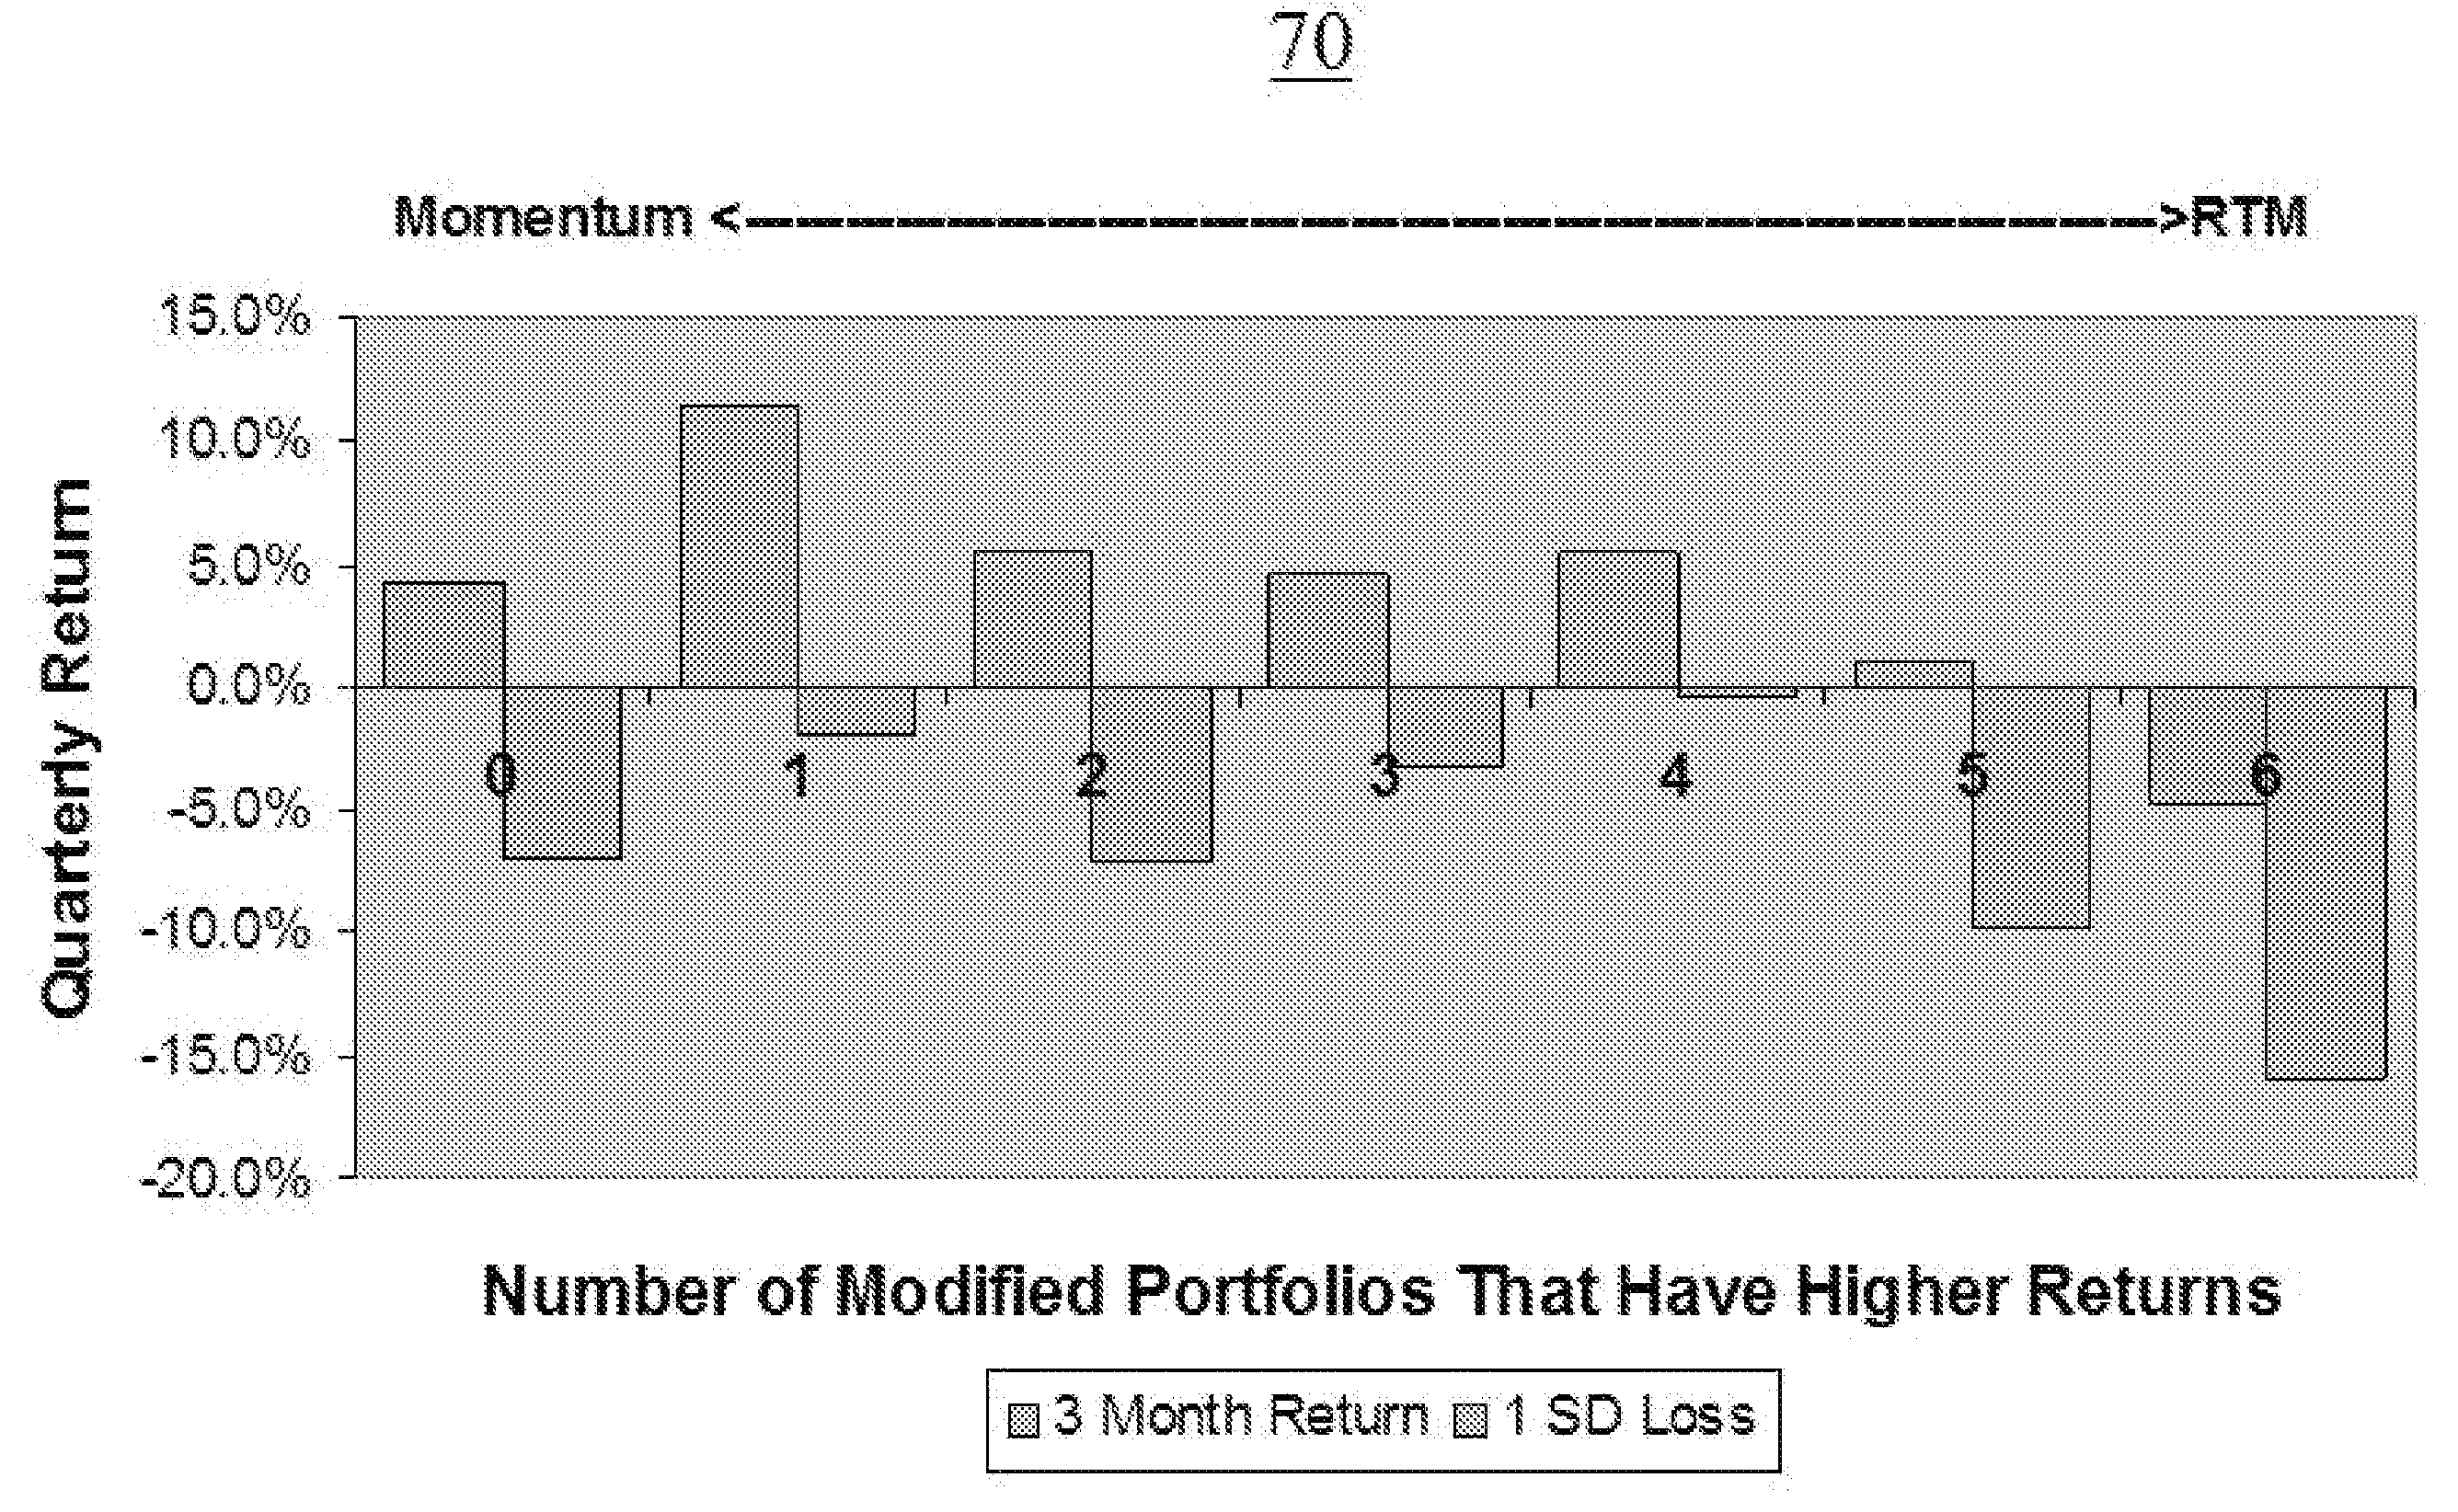
[0205]State Four has historically been the worst time to buy GE in terms of average return and risk (as measured by the one-SD downside). The best time to buy GE is when it is in State Zero—GE appears to be dominated by momentum effects. The second best state in which to buy GE, however, is State Six. State Six means that GE has substantially under-performed, i.e., GE has under-performed all of the core assets. Buying in State Six is a bet on reversion to the mean: history suggests that GE has generated moderately good returns following a year of substantial under-performance.

[0206]The lower right hand chart shows how many of our historical periods have been in each state. The signature is of a highly concentrated portf...


PUM


Abstract

Prognostic and diagnostic information is determined about an investment portfolio through perturbing the investment portfolio with allocations to other sectors and reviewing the performance of the perturbed investment portfolios using historical data, and combining that with other factors. Relationships between one's investment portfolio and other assets, rights or liabilities can be identified by creating several modified portfolios each of which comprise a mix of the original investment portfolio and one or more of the other assets, rights or liabilities. The performance of these modified portfolios, as compared to the original portfolio over a historical period, indicates the correlation (or lack thereof) between these other assets, rights or liabilities and one's investment portfolio. By identifying these correlations, one can then take any desired action to modify one's portfolio to obtain the desired results.

Description

RELATED APPLICATIONS[0001]This application claims the benefit of U.S. Provisional Patent Application No. 61 / 210,210 filed by the same inventor on Mar. 15, 2009 with the same title.FIELD OF THE INVENTION[0002]The present invention relates generally to methods and apparatuses for analyzing individual investments or investment portfolios and to a method and apparatus for analyzing an individual investment or an investment portfolio to predict possible future performance of these investments.BACKGROUND[0003]Since the dawn of investment time, investors have been looking for new ways to evaluate their portfolios. Investor's portfolios can now include individual stocks, mutual funds and Exchange Traded Funds (ETFs) among other investments. Many models have been proposed and many tools have been developed. Some of these tools are useful, many are not. While tools to predict the future performance of an investment exist, such as Fama-French factors, related fundamental factors, and momentum,...

Claims


Application Information

Patent Timeline
Patent Type & Authority Applications(United States)
IPC IPC(8): G06Q40/00
CPCG06Q40/06
Inventor CONSIDINE, GEOFF
Owner CONSIDINE GEOFF
Learn More