Eureka AIR delivers breakthrough ideas for toughest innovation challenges, trusted by R&D personnel around the world.

Methods for effective processing of time series

a time series and processing technology, applied in the field of effective processing of time series, can solve the problems of data evolution undoubtedly putting time at the focus of users' curiosity, serious damage to the end user, and challenges in the field of data processing

Active Publication Date: 2011-03-10
HYPERROLL ISRAEL
View PDF25 Cites 211 Cited by
  • Summary
  • Abstract
  • Description
  • Claims
  • Application Information

AI Technical Summary

Problems solved by technology

Secondly, data evolution undoubtedly puts time at the focus of the users' curiosity.
The uniqueness of the time domain has brought new opportunities and simultaneously created new challenges for the field of data processing.
The reason for these explicit efforts is that the inability to address time domain effectively may (and eventually will) result in serious damage for the end user.
This damage spans virtually all aspects of data processing including, for example, system performance, data representation, transparency of the process, robustness to bursty data.
Virtually all evolving processes can be presented as a time series; that property makes study of time series a fundamental problem.
It goes beyond enhancing existing solutions with more powerful software or hardware and almost inevitably implies involvement of expensive human resources.
In regard to this a well-known drawback of many database systems is the extensive additional investments that are required in maintenance personnel and solutions, where typically the associated expenses are higher then the initial cost.
Usually a long and costly process is required to understand the underlying dynamics of time series and propose an effective data representation.
Unfortunately, in many cases, data evolution diminishes the value of results obtained by this process after a relatively short period of time.
Most existing solutions are very complex.For any functionality, the level of its implementation can, in certain cases, be critical.
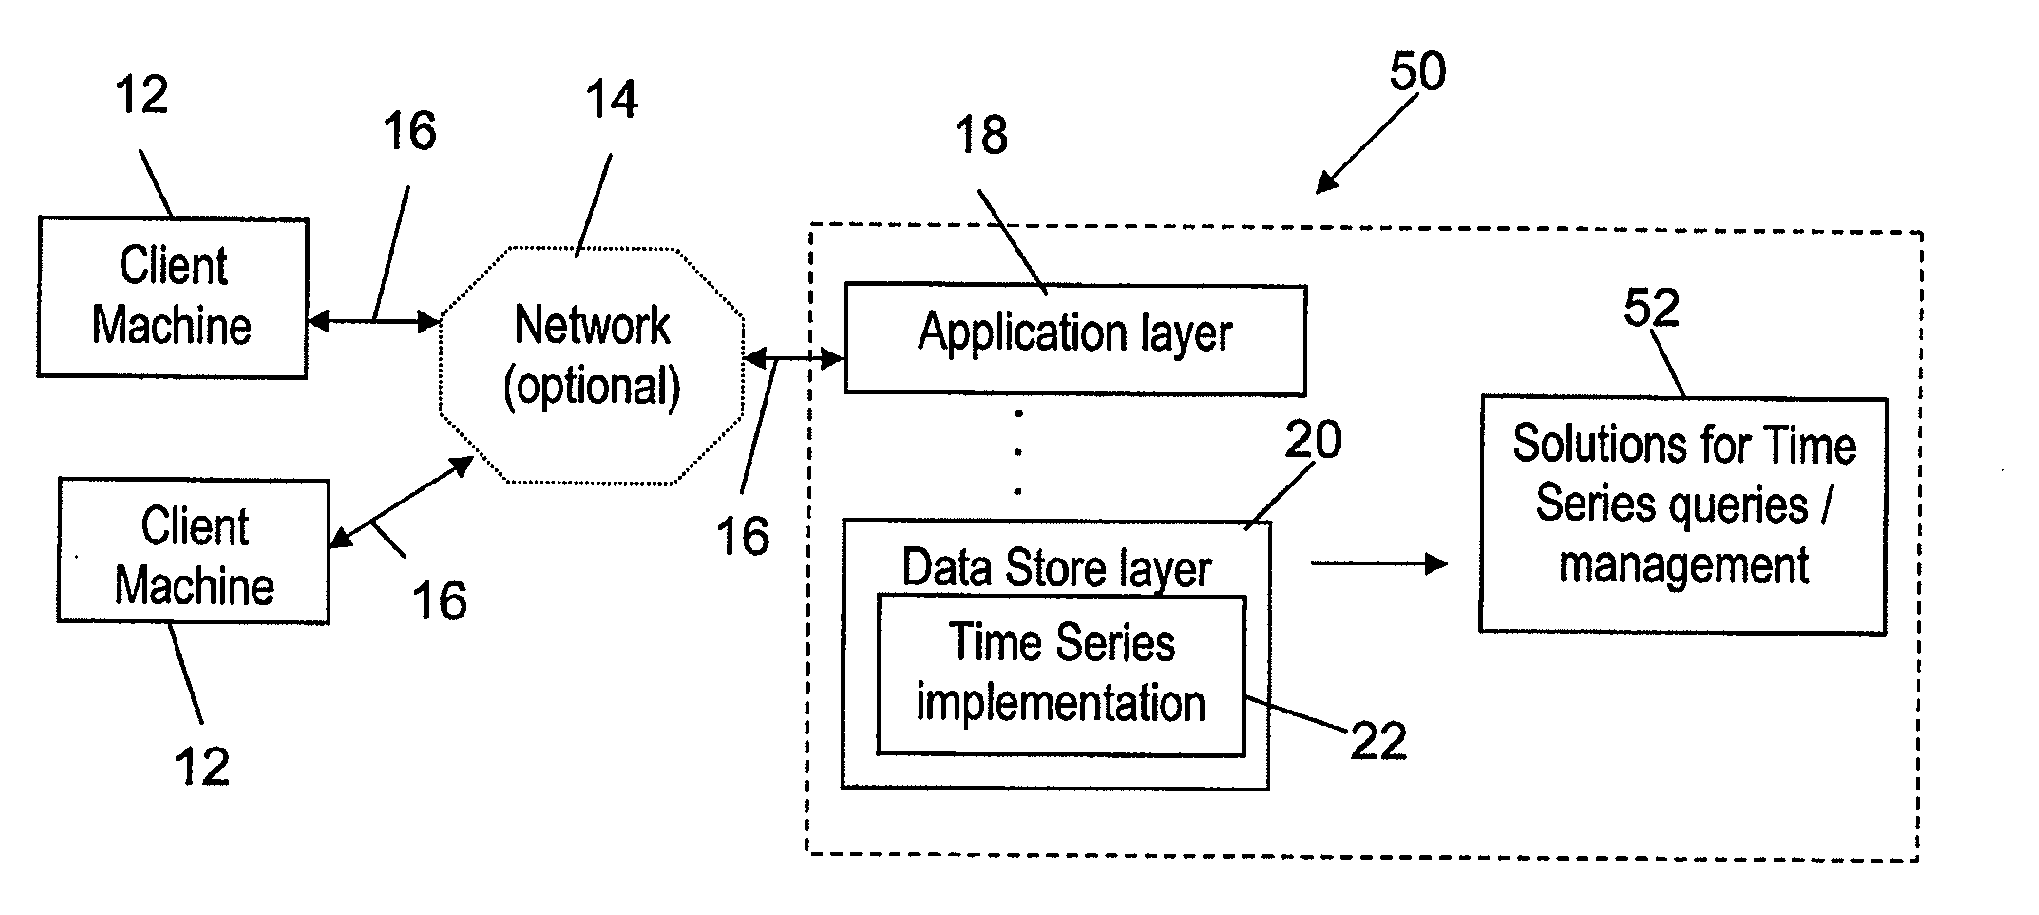
Since the application layer is at least one layer above the data store layer, this placement cripples the ability of user system to deliver good performance.
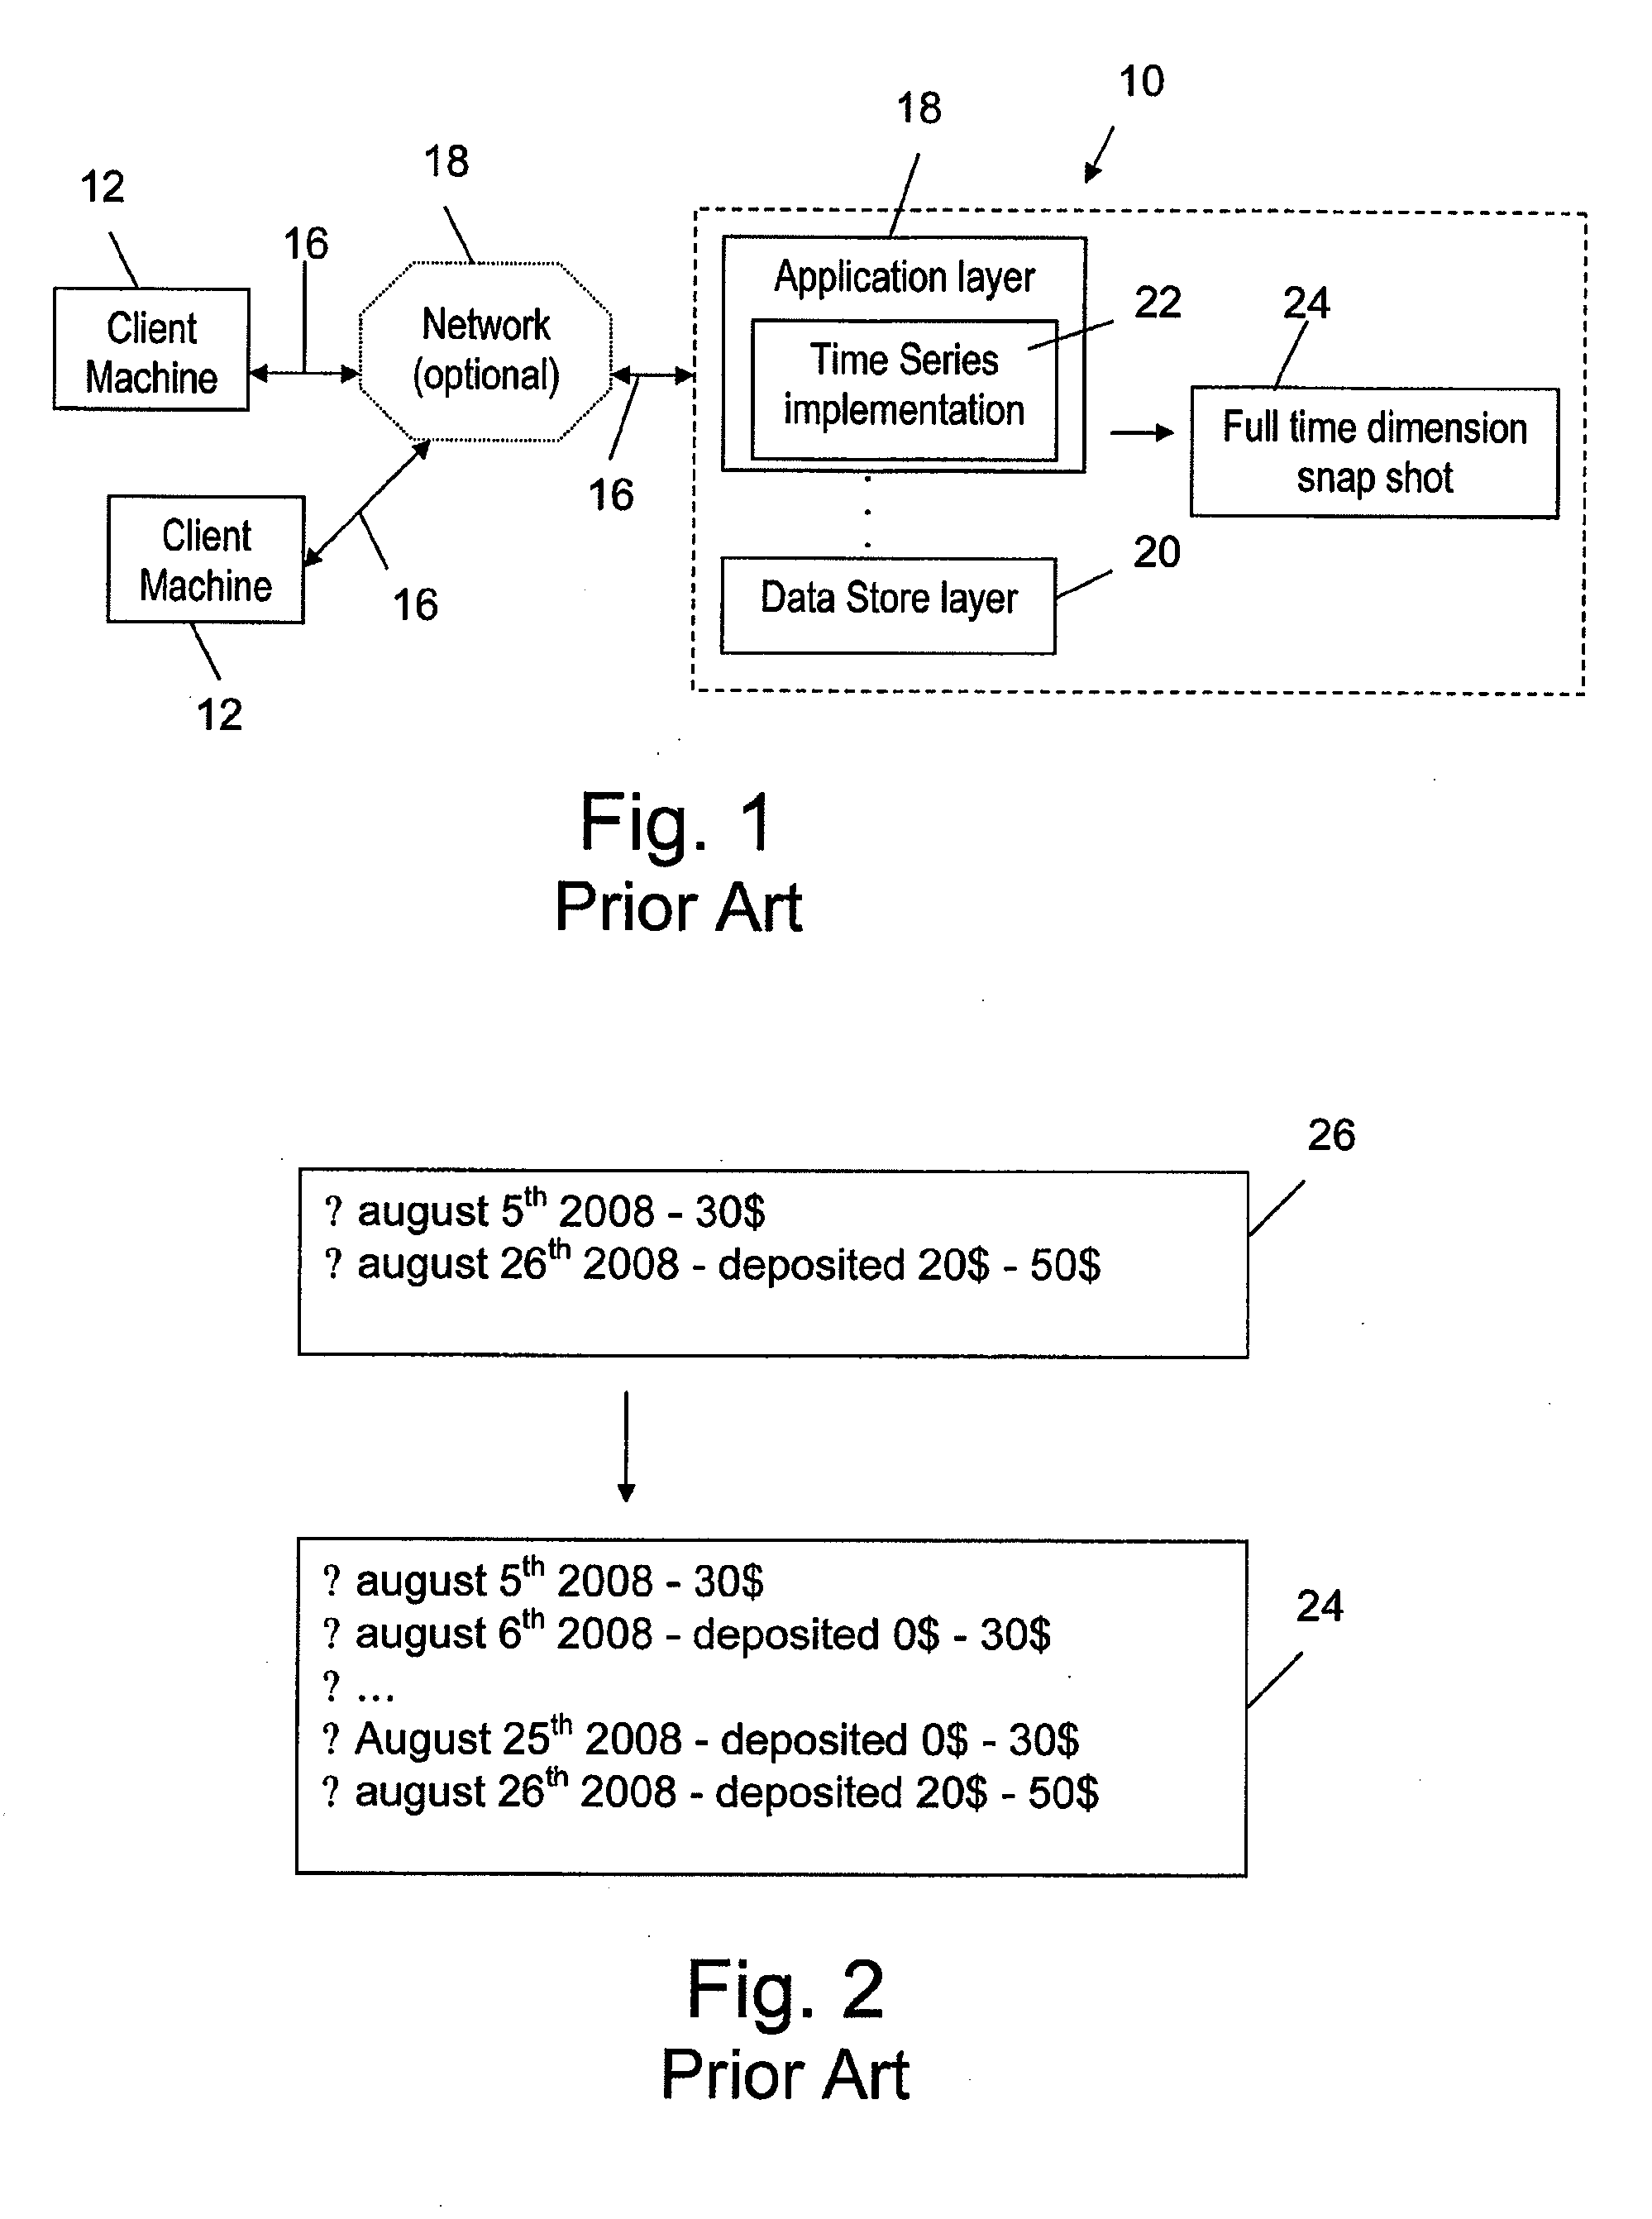
The draw back for this solution is that it can be expensive both in the time it takes to create the snapshots and the amount of storage it requires.
From this very simple example it is clear that the full time dimension snapshot approach to processing time series is expensive both in terms of the time it takes to create the snapshots and also in the amount of storage it requires.
Queries for historical data, replete with time ranges and roll ups and arbitrary time zone conversions are difficult in a data store.
Compositions of those rules are even more difficult.
This is a problem compounded by the free nature of applications themselves.

Method used


Image

  • Methods for effective processing of time series
  • Methods for effective processing of time series
  • Methods for effective processing of time series

Examples


example 1

[0048]Assume the following user query: ‘Show stock of Cola for each month of period starting from January 2008 and up to December 2008’.

[0049]Table 1 shows data entries in the data store layer and the user system uses YTD (Year To Date) time series.

TABLE 1ProductDateQuantitydimensiondimensionmeasureColaJanuary 200810ColaMarch 20085ColaApril 200816ColaNovember 20087

[0050]A possible scheme of query processing in a conventional user system may be as follows. For each requested date in a given query, the application layer of the user system would compose a separate query and send this query to the data store layer of user system. This query contains logic for YTD calculation according to a specific date hard coded in the query. Then the results of all the queries would be combined into a single query result and sent to the user.

[0051]The composed queries in SQL may be defined as follows:

Select product, ‘Jan2008’, measureFrom tableWhere product = ‘Cola’ and date in (‘Jan2008’);Select pro...

example 2

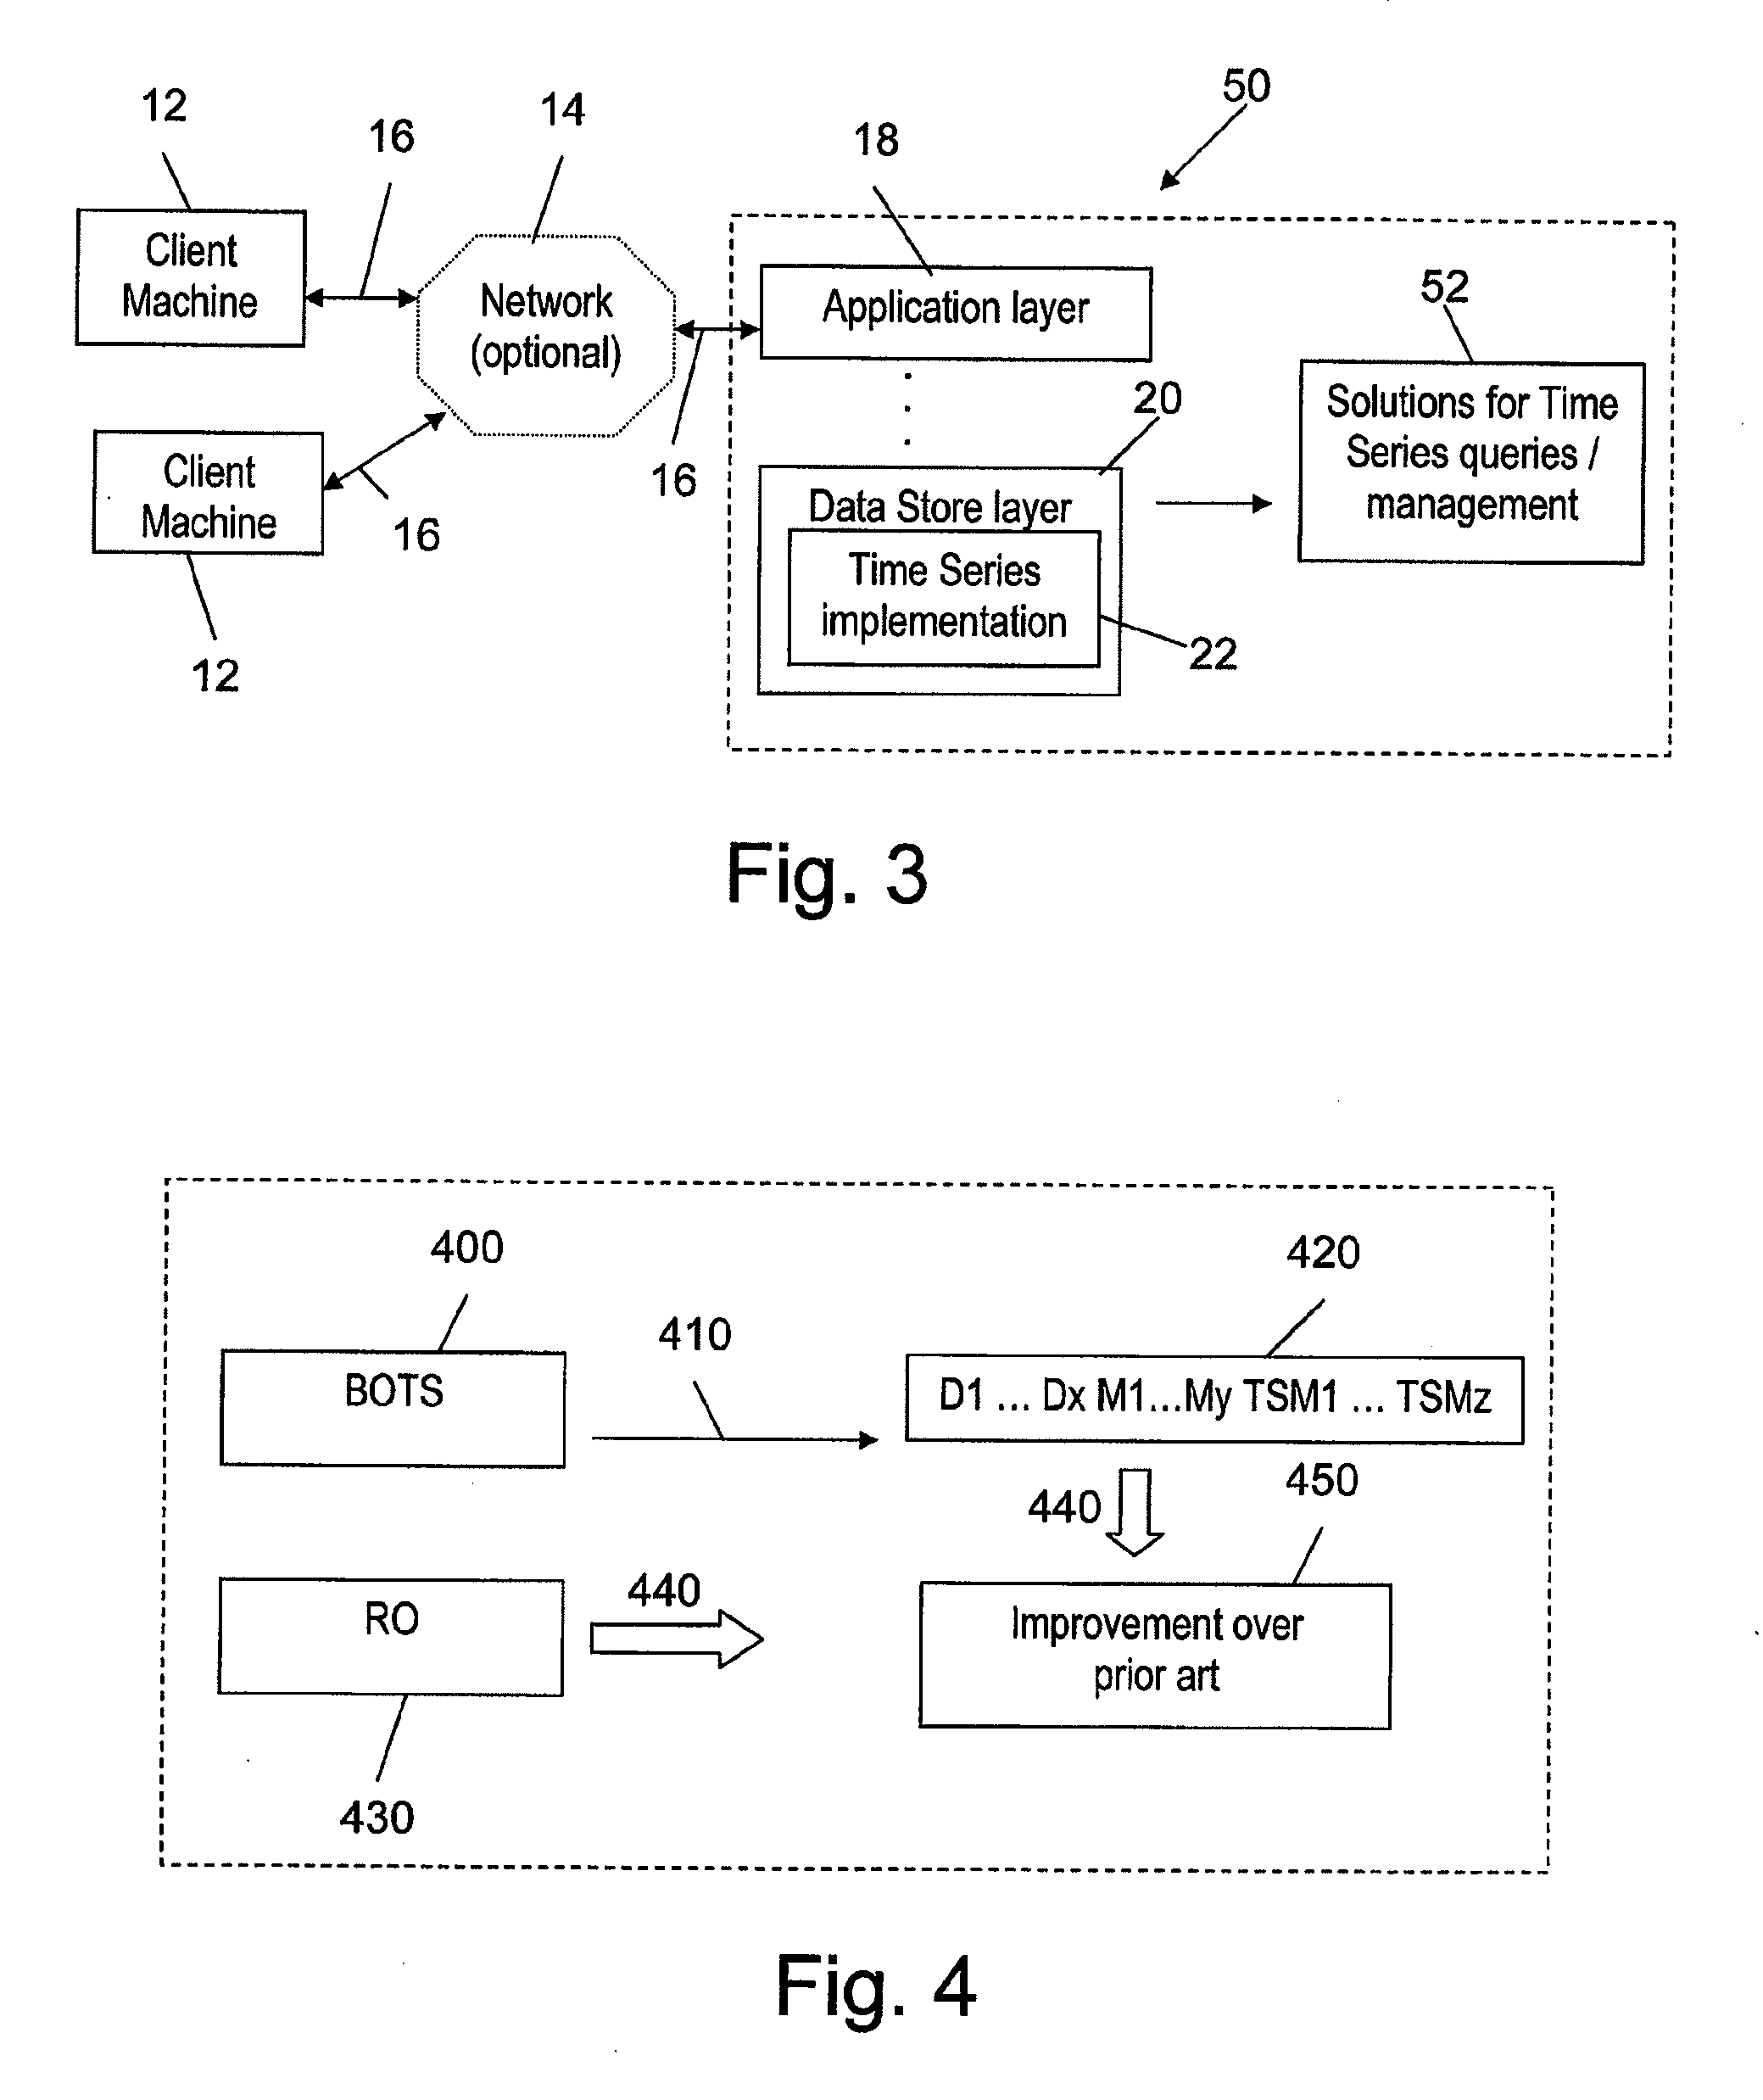
[0055]The user system uses YTD time series. BOTS for YTD time series measure may be defined in a data store layer as follows:

  :    starting from the year of a given date, and up to the given date>  

[0056]Since the data store layer ‘knows’ the meaning of YTD, there is no need to rewrite the original query in order to explain which data entries exactly should be taken for YTD measure calculation of each date. So in the case of a user system configured according to the invention the query in SQL may be defined as follows:

Select product, date, measure_YTDFrom tableWhere product = ‘Cola’ and date in (‘Jan2008’, ..., ‘Dec2008’);

[0057]Query Processor collects the following data entries from data store for this query:

‘ColaJan200810’‘ColaMar20085’‘ColaApr200816’‘ColaNov20087’

[0058]The calculation of measure_YTD would be executed with all the data entries above as an input. For each requested prefix ‘product date’ Query Processor combines all the data entries above into a single intermediate...

example 3

[0064]FIG. 7 schematically shows time series data entries of a stock market that trades two stocks A and B in both the conventional and RO. The input data stream consists of pairs (stock id, price) ordered by the time of their appearances. The time series data in the conventional art 700 is an interleaved arrangement of data for both stocks as follows:

(A, $5, 5.5 pm: January 2008), (B, $105, 5.5 pm: January 2008) (A, $2, 5.7 pm: January 2008), (B, $115, 5.7 pm: January 2008) . . . .

[0065]The same time series in the Reverse Order 710 will consist of distinct streams for each stock id, e.g. stream 720 for stock A and 730 for stock B. Thus, each stream will represent the history of a specific stock in time. In the RO 710 the original time series 700 is represented as follows:

(A, $5, 5.5 pm: January 2008), (A, $2, 5.7 pm: January 2008) . . .

[0066]and

(B, $105, 5.5 pm: January 2008), (B, $115, 5.7 pm: January 2008) . . . .


PUM


Abstract

A method of effectively representing and processing data sets with time series is disclosed. The method may comprise representing time series as a virtual part of data in a data store layer of a user system, thereby allowing processing of time-series related queries in said data store layer of said user system.

Description

BACKGROUND OF THE INVENTIONDescription of the Related Art[0001]Recently handling of massive quantities of continuously evolving data has become an inevitable necessity. The data evolution naturally results in a bold distinction between time and all other features of the data; this is mainly due to the following reasons: Firstly, from the data distribution perspective time possesses unique properties. These characteristics include the (natural) time-based order of new arrivals, timestamps that are changing rapidly and constantly, and well-defined spreading of data across the time domain. Secondly, data evolution undoubtedly puts time at the focus of the users' curiosity. For evolving processes, it is natural to study the characteristics that are closely related to the time domain and may entirely span it. To give just a few examples: a user may want to improve forecasting by mining historical data, gain precision by limiting analysis to recent portions of the data, track the shifts o...

Claims


Application Information

Patent Timeline
IPC IPC(8): G06F17/30
CPCG06F17/30551G06F16/2477G06F16/284G06F16/285G06F16/951
Inventor SHAKED, GUYBRAVERMAN, VLADIMIRBELAYAEV, VICTORRUBIN, GABBYSADETSKY, MARINE
Owner HYPERROLL ISRAEL
Why Eureka
Eureka Blog
Learn More