Method for improving visualization of infrared images
a technology of infrared images and visualization methods, applied in the field of original infrared image coding process, can solve the problems of stressing operators' eyes and brains, reducing the accuracy of infrared images, and tiring eyes of conventional methods, so as to reduce eye fatigue and improve the effect of technician perception and reducing the fatigue of eyes
- Summary
- Abstract
- Description
- Claims
- Application Information
AI Technical Summary
Benefits of technology
Problems solved by technology
Method used
Image
Examples
example 1
[0070]An infrared image of a kitchen oven was taken using a 320×240 pixel infrared sensor. The infrared image is shown in FIG. 13 without a temperature reference scale by its side. Every pixel of this image has a temperature value associated with it. Because of the large number of values obtained (320×240=76800), a partial listing is shown in Table 3. The complete listing is shown in Table 8, which is appended hereto on a compact disc. The file on the compact disc is labeled Table—8.txt. Although in this example, a 320×240 sensor size is used, this method is applicable for sensors of any sizes, bigger or smaller. In addition, although there are several parameters that can be adjusted to obtain the infrared image this image, such as optical focus, ambient temperature, optics temperature, target emissivity, wind speed (if any), reflected temperature and so on, this method is applicable to the final visual video output regardless whether such prior adjustments h...
example 2
Conventional False Color-Added Infrared Image (“Iron” and “Rainbow”)
(Related Art)
[0074]Adding false colors to the image obtained in Example 1 (FIG. 13) entails a change of the conversion color RGB table algorithm recorded at the thermal camera firmware, or in the thermal pos-processing software from white-grey-black tones, to color tones. On the exemplary oven to colors, keeping the same top and bottom limits, is shown in FIGS. 16a and 16b. Similar examples of other objects are shown in FIGS. 10 and 11. As can be easily seen, colors applied by conventional methods are tiring to the eye and usually give too much color information to be interpreted and understood. Too much color stresses the operators' eyes and brain causing him or her to commit more errors as the working day advances. Such errors are very expensive for the users of infrared imaging because the spots located are generally linked to severe damages on the equipments or industrial or power instalations inspected with thi...
example 3
Step-by-step Procedure for Converting a Thermal Image Using Inverted Black and White Plus Color Mixing Process on FIG. 17
[0075]The following steps and considerations are followed to convert a thermal image using an exemplary process according to this invention. :
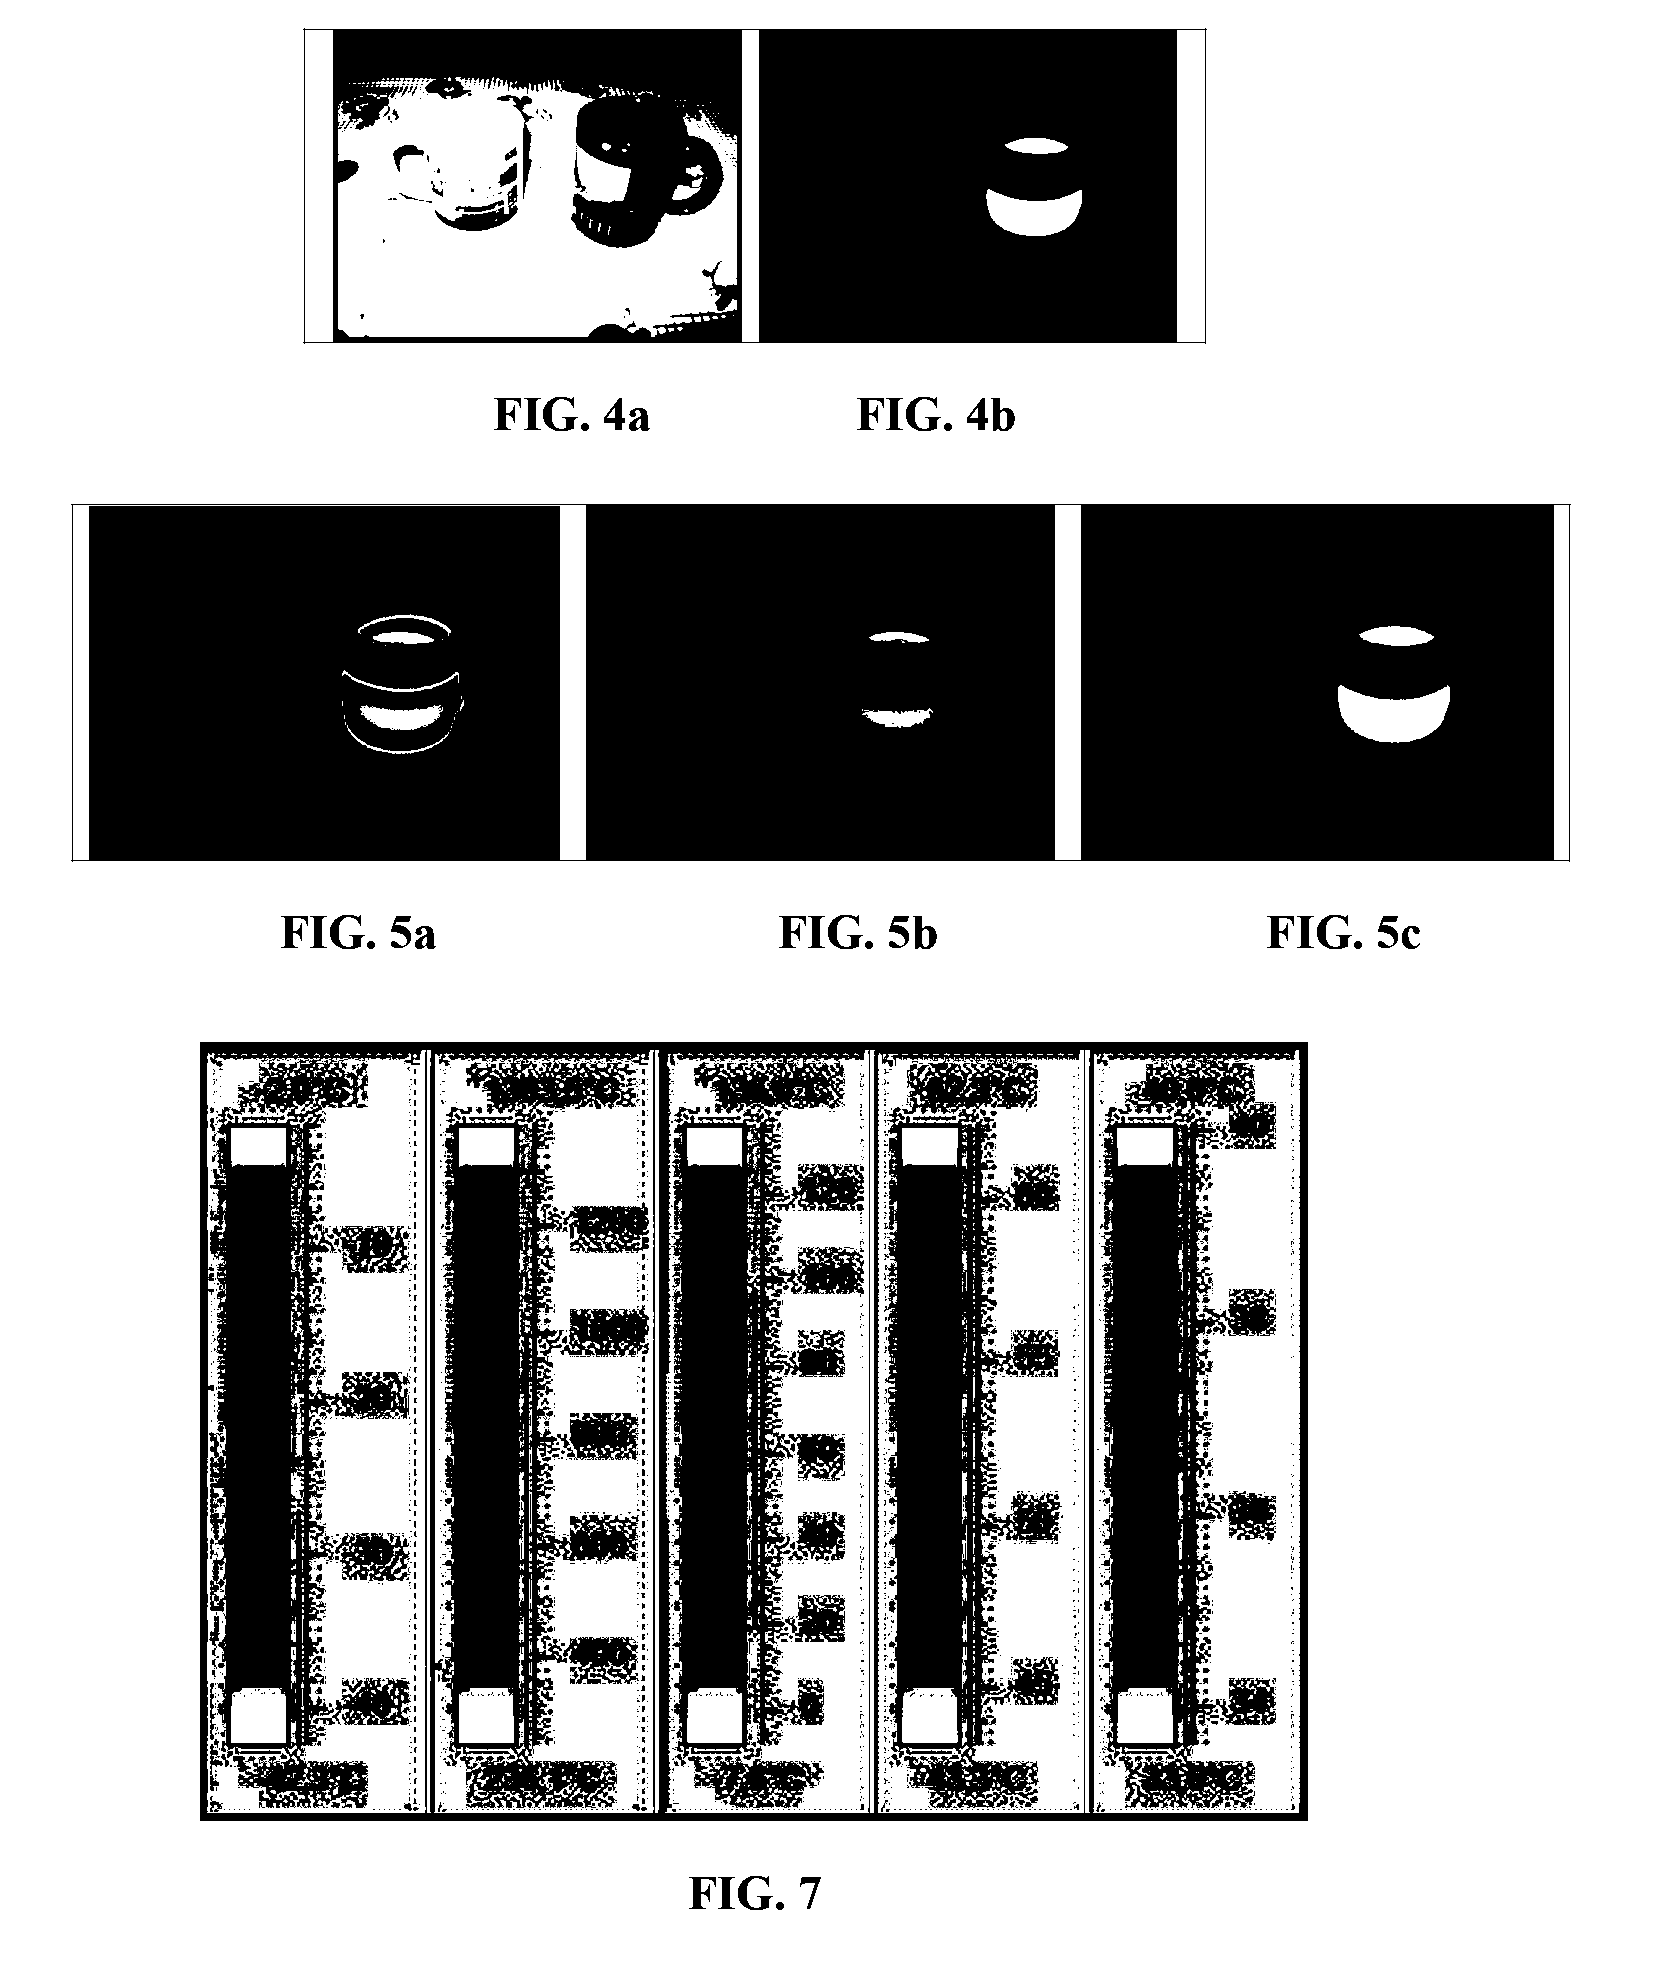
[0076]1. The color gradient that will be used in the color portion of the image must be chosen carefully. The color palette can be any of the millions of color arrangements the human eye can see but those palettes with too many colors will usually produce very confusing thermal images. In FIG. 6 there are several examples of color sequences that are added to inverted black and white tones. It shall be noted that more than 6 different colors plus black and white are usually tiring and confusing to the human eye. Nevertheless, the purpose of the invention is to split the thermal information contained in a thermal image into two parts; a first one related to the important temperatures that are represented in colors, and a secon...
PUM
 Abstract
Description
Claims
Application Information
 - R&D
- Intellectual Property
- Life Sciences
- Materials
- Tech Scout
- Unparalleled Data Quality
- Higher Quality Content
- 60% Fewer Hallucinations
Browse by: Latest US Patents, China's latest patents, Technical Efficacy Thesaurus, Application Domain, Technology Topic, Popular Technical Reports.
© 2025 PatSnap. All rights reserved.Legal|Privacy policy|Modern Slavery Act Transparency Statement|Sitemap|About US| Contact US: help@patsnap.com


