Biomarker for predicting therapeutic efficacy of allergen immunotherapy
- Summary
- Abstract
- Description
- Claims
- Application Information
AI Technical Summary
Benefits of technology
Problems solved by technology
Method used
Image
Examples
example 1
[0101]
[0102]1. Sorting Between Therapeutically Effective Group and Ineffective Group
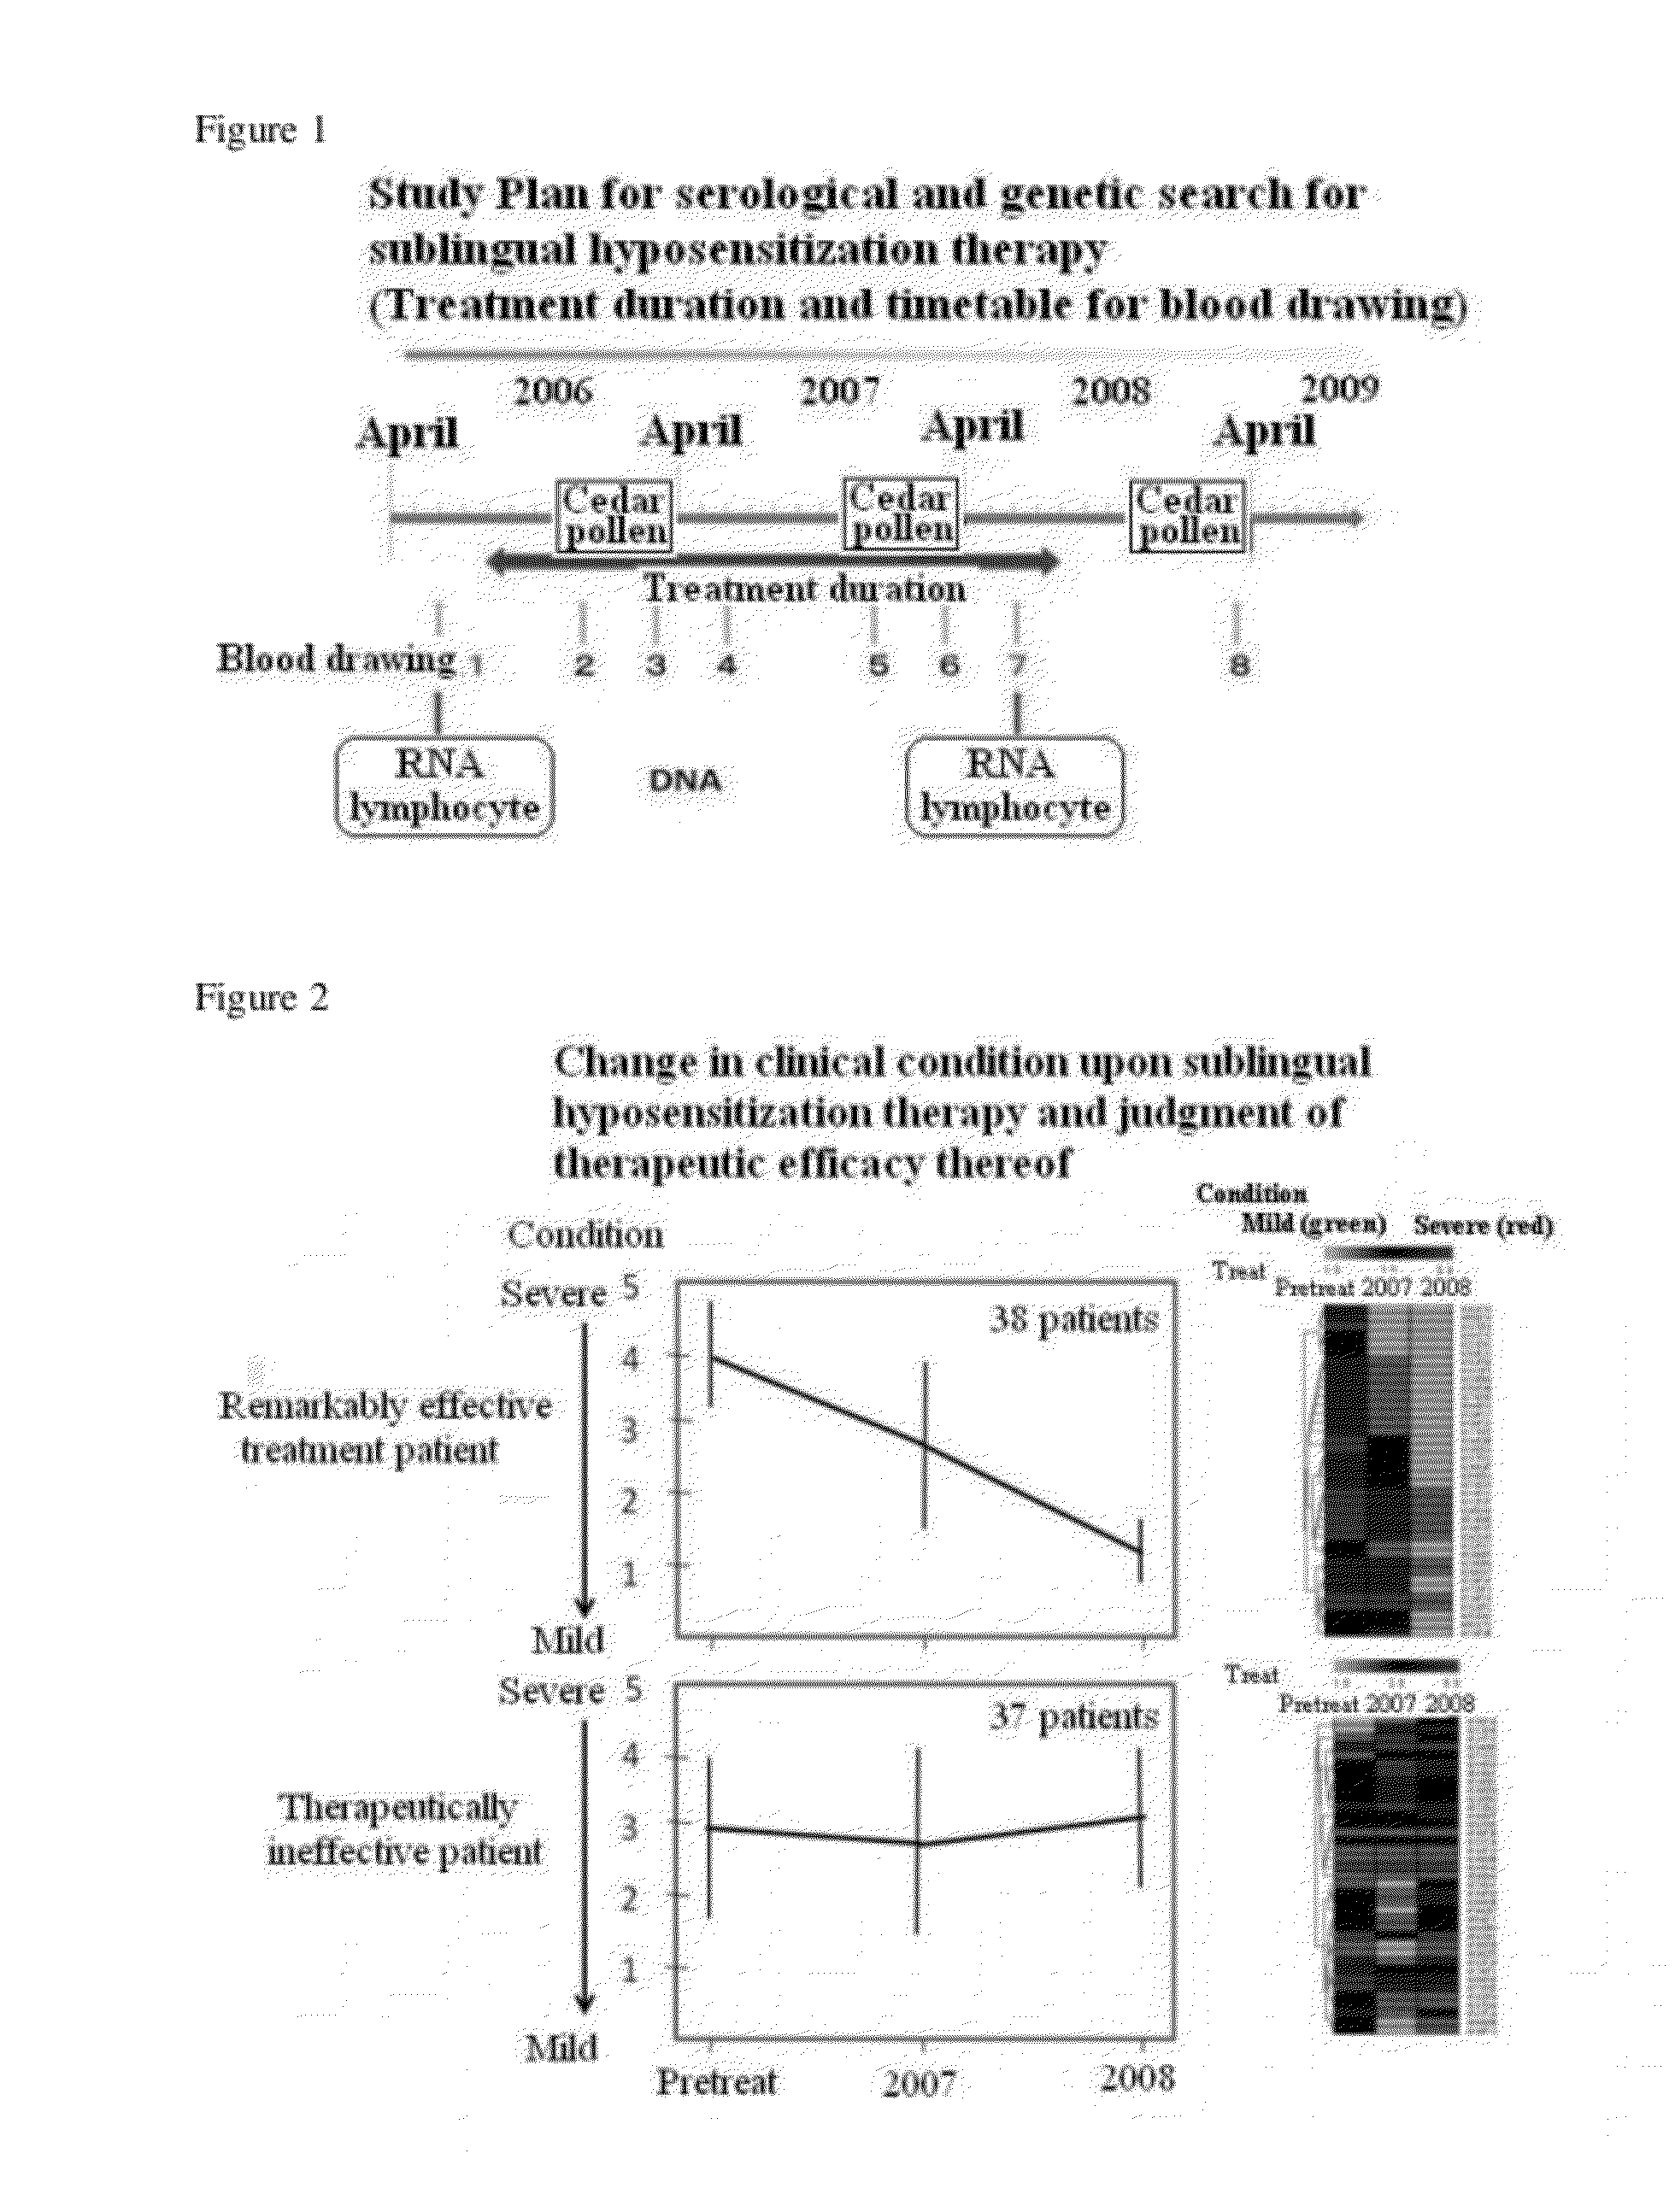
[0103]First, therapeutic efficacy of sublingual allergen immunotherapy for cedar pollen allergy was examined during two years of administration of a pollen allergy therapeutic drug (a allergen immunotherapy drug). The allergen immunotherapy drug (standardized cedar pollen extract (Torii Pharmaceutical Co., Ltd.)) was given under the administration schedule shown in Table 2.
TABLE 2Week 5Week 4and laterWeek 1Week 2Week 32000 JAU / 2000 JAU / 2 JAU / ml20 JAU / ml200 JAU / mlmlmlDay 1 1 drop 1 drop 1 drop 1 dropDay 2 2 drops 2 drops 2 drops 2 dropsDay 3 3 drops 3 drops 3 drops 4 drops20 dropsDay 4 4 drops 4 drops 4 drops 8 dropsDay 5 6 drops 6 drops 6 drops12 dropsDay 6 8 drops 8 drops 8 drops18 dropsDay 710 drops10 drops10 drops20 drops20 drops
[0104]Patients were classified into a group with remarkable therapeutic efficacy (therapeutically effective group) and a group with no therapeutic efficacy (group in which...
example 2
[0153]Search for Genes that Contribute to Assessment of Efficacy with Higher Probability
[0154]According to the present example, multiple regression analysis was performed for the purpose of searching for genes necessary for carrying out the judgment of the efficacy with higher probability.
[0155]A relational expression between a certain variable y (referred to as a criterion variable or a dependent variable) and variables x1, x2, . . . xp that are considered to influence variable y (referred to as explanatory variables or independent variables) was obtained, based on which y value can be predicted from values x1, x2, . . . xp or the contribution level of each x upon such prediction can be assessed. Such analysis is referred to as regression analysis. In particular, the analysis is called a multiple regression analysis when there are two or more explanatory variables.
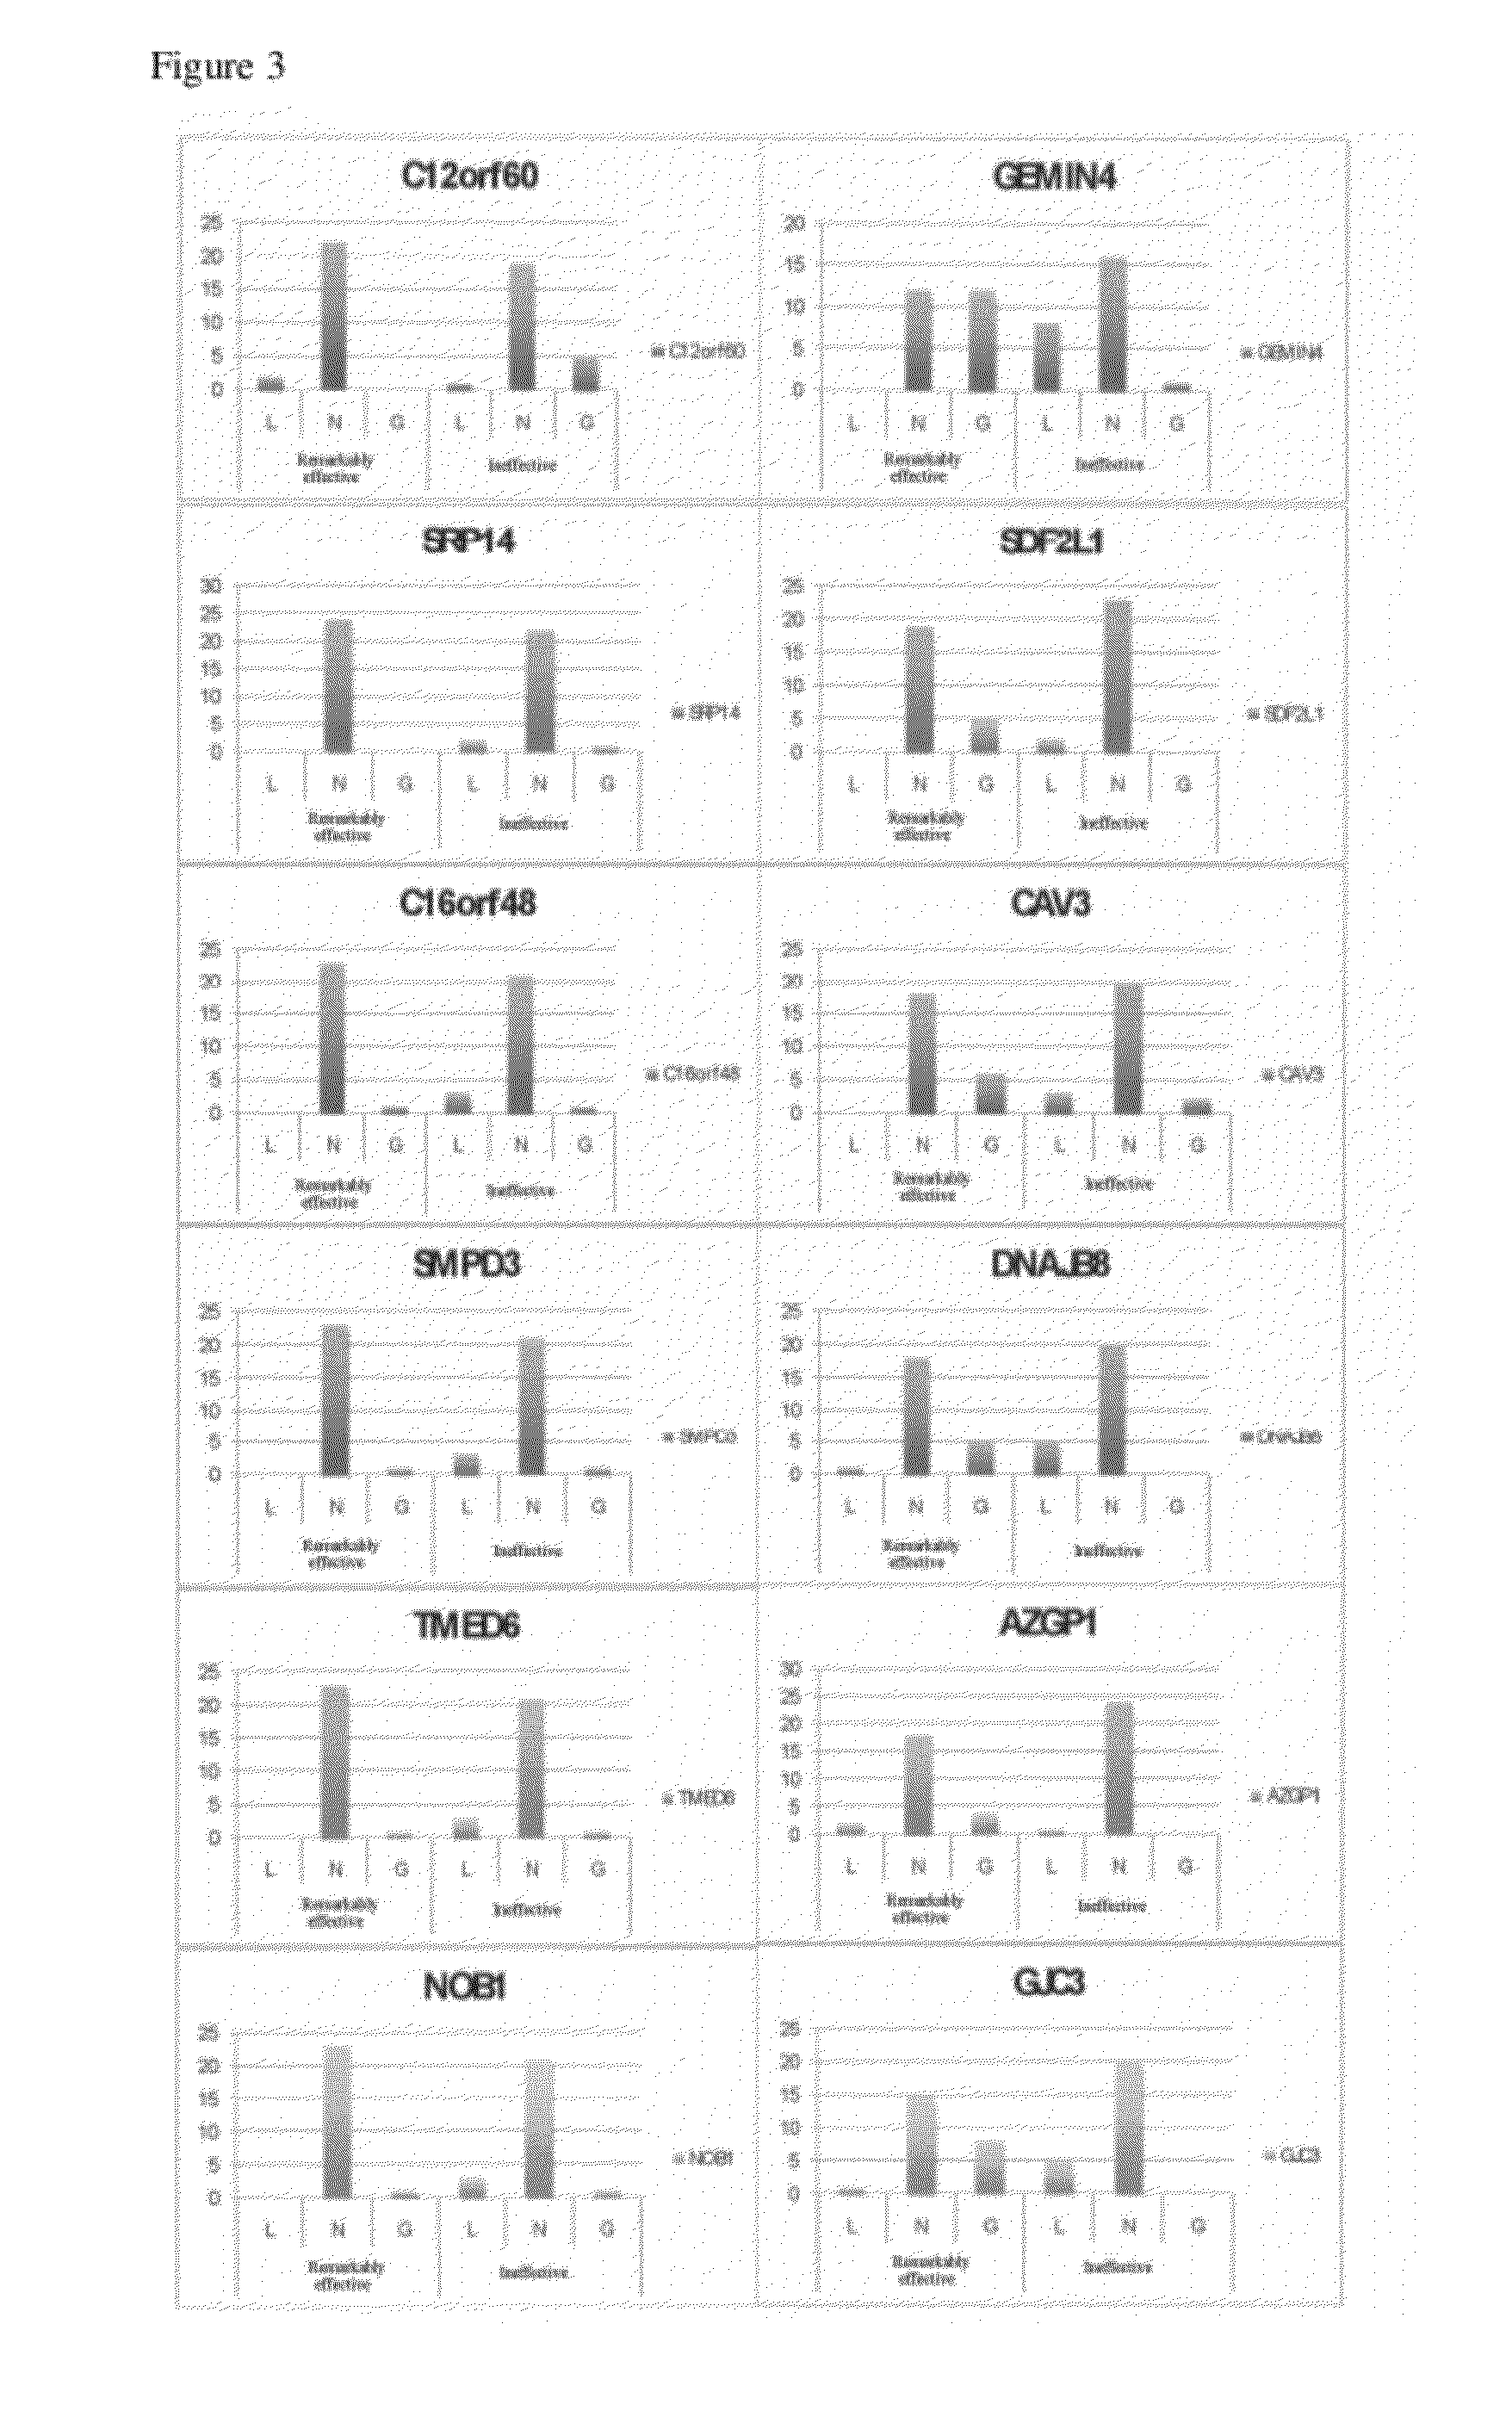
[0156]According to the present example, for the above-described 34 genes, a multiple regression analysis was conducted ...
example 3
[0160]mRNA analysis was performed using mRNA derived from the basophil fractionated from the blood sample drawn at blood drawing point 7 by FACS. In addition, CNV analysis was carried out for each patient group (22 patients from the remarkably effective treatment group and 22 patients from the therapeutically ineffective group (total of 44 patients)). The analysis model was “efficacy assessment (alleviation) in 2008, CNV: mRNA (blood drawing point 7 after the treatment)”. Other than the above-described points, the analysis was carried out in the same manner as Example 1.
[0161]Specifically, for 13,792 genes intertwined with gene symbols based on mRNA data and CNV data, a linear model regression analysis was conducted using three parameters, i.e., serological test term, mRNA value and CNV value of the above-mentioned analysis model as explanatory variables and the value of efficacy judgment of the cedar pollen extract trial in the spring of 2008 as dependent variables.
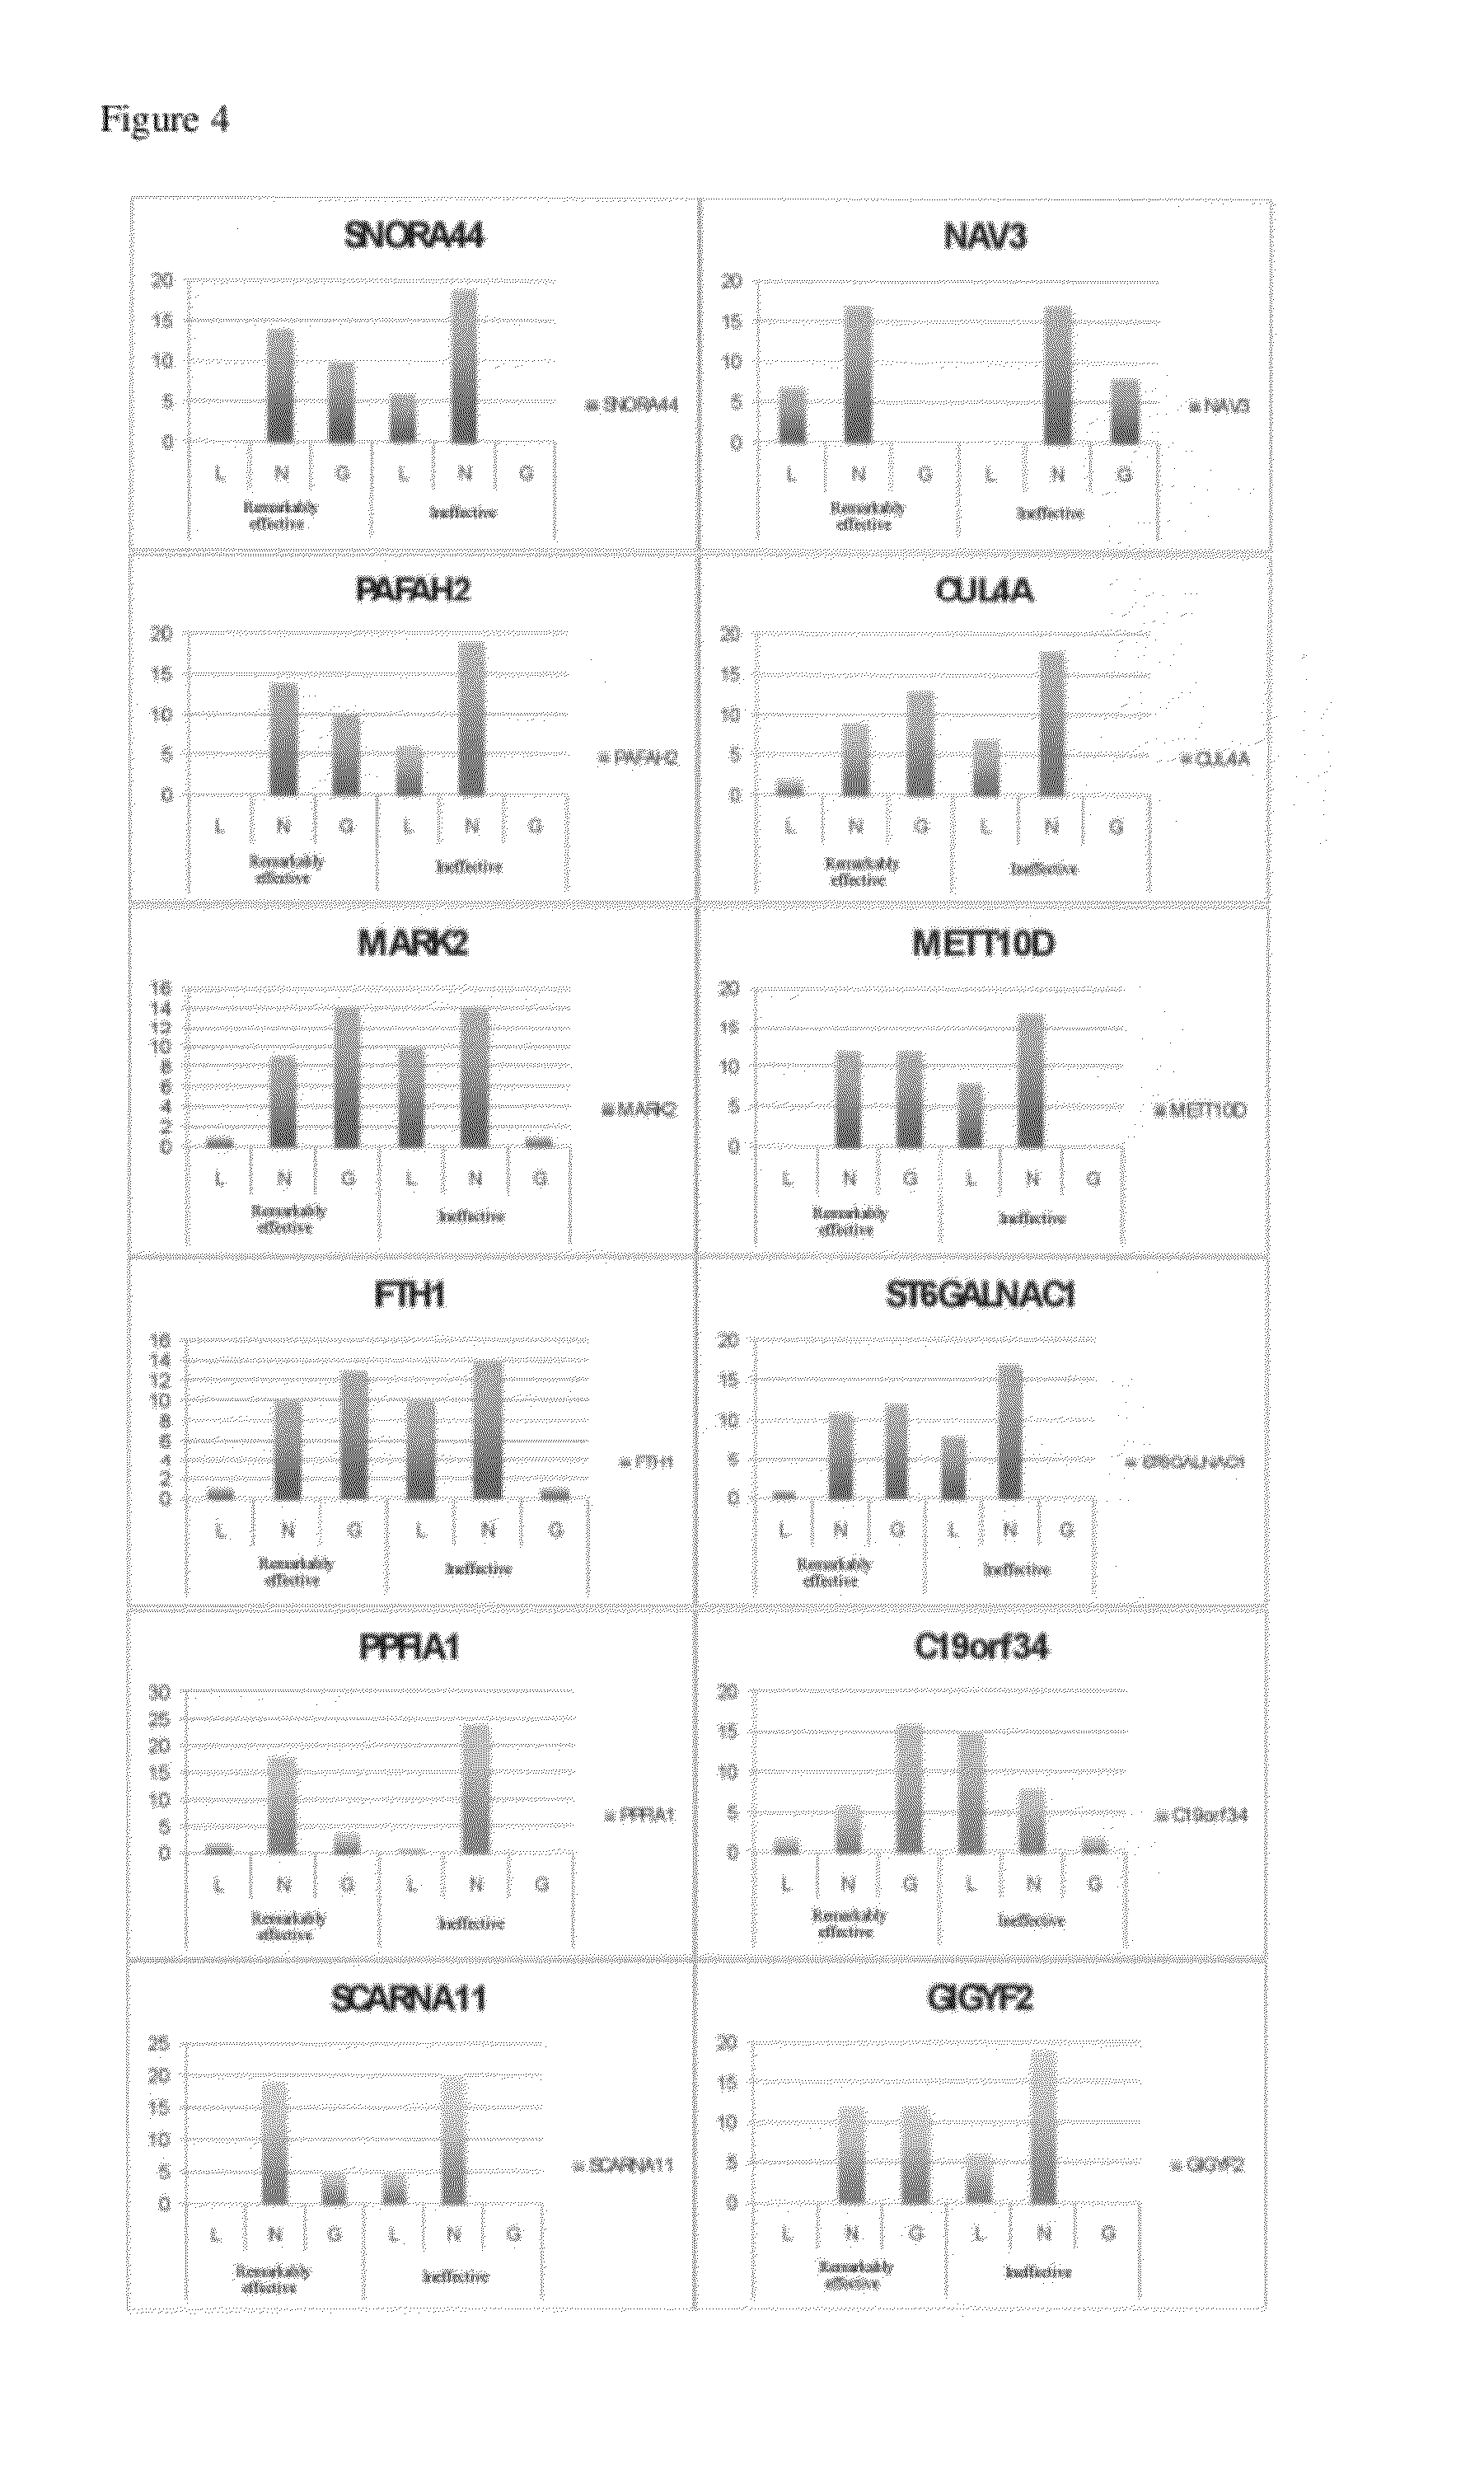
[0162]P values a...
PUM
| Property | Measurement | Unit |
|---|---|---|
| Volume | aaaaa | aaaaa |
| Length | aaaaa | aaaaa |
| Length | aaaaa | aaaaa |
Abstract
Description
Claims
Application Information
 - R&D
- Intellectual Property
- Life Sciences
- Materials
- Tech Scout
- Unparalleled Data Quality
- Higher Quality Content
- 60% Fewer Hallucinations
Browse by: Latest US Patents, China's latest patents, Technical Efficacy Thesaurus, Application Domain, Technology Topic, Popular Technical Reports.
© 2025 PatSnap. All rights reserved.Legal|Privacy policy|Modern Slavery Act Transparency Statement|Sitemap|About US| Contact US: help@patsnap.com


