Method for Detecting Anomalies in Multivariate Time Series Data

a multi-variate time series and anomaly detection technology, applied in the field of time series data processing, can solve the problems of not compute any feature vector, or representation of data, and imposes a fairly restrictive assumption

Active Publication Date: 2013-11-28
MITSUBISHI ELECTRIC RES LAB INC
View PDF2 Cites 35 Cited by
  • Summary
  • Abstract
  • Description
  • Claims
  • Application Information

AI Technical Summary

Problems solved by technology

Because that method does not analyze data in time windows, the method cannotdetect “collective anomalies,” which are anomalies in the dynamics of a var

Method used


Image

  • Method for Detecting Anomalies in Multivariate Time Series Data
  • Method for Detecting Anomalies in Multivariate Time Series Data
  • Method for Detecting Anomalies in Multivariate Time Series Data

Examples


Embodiment Construction

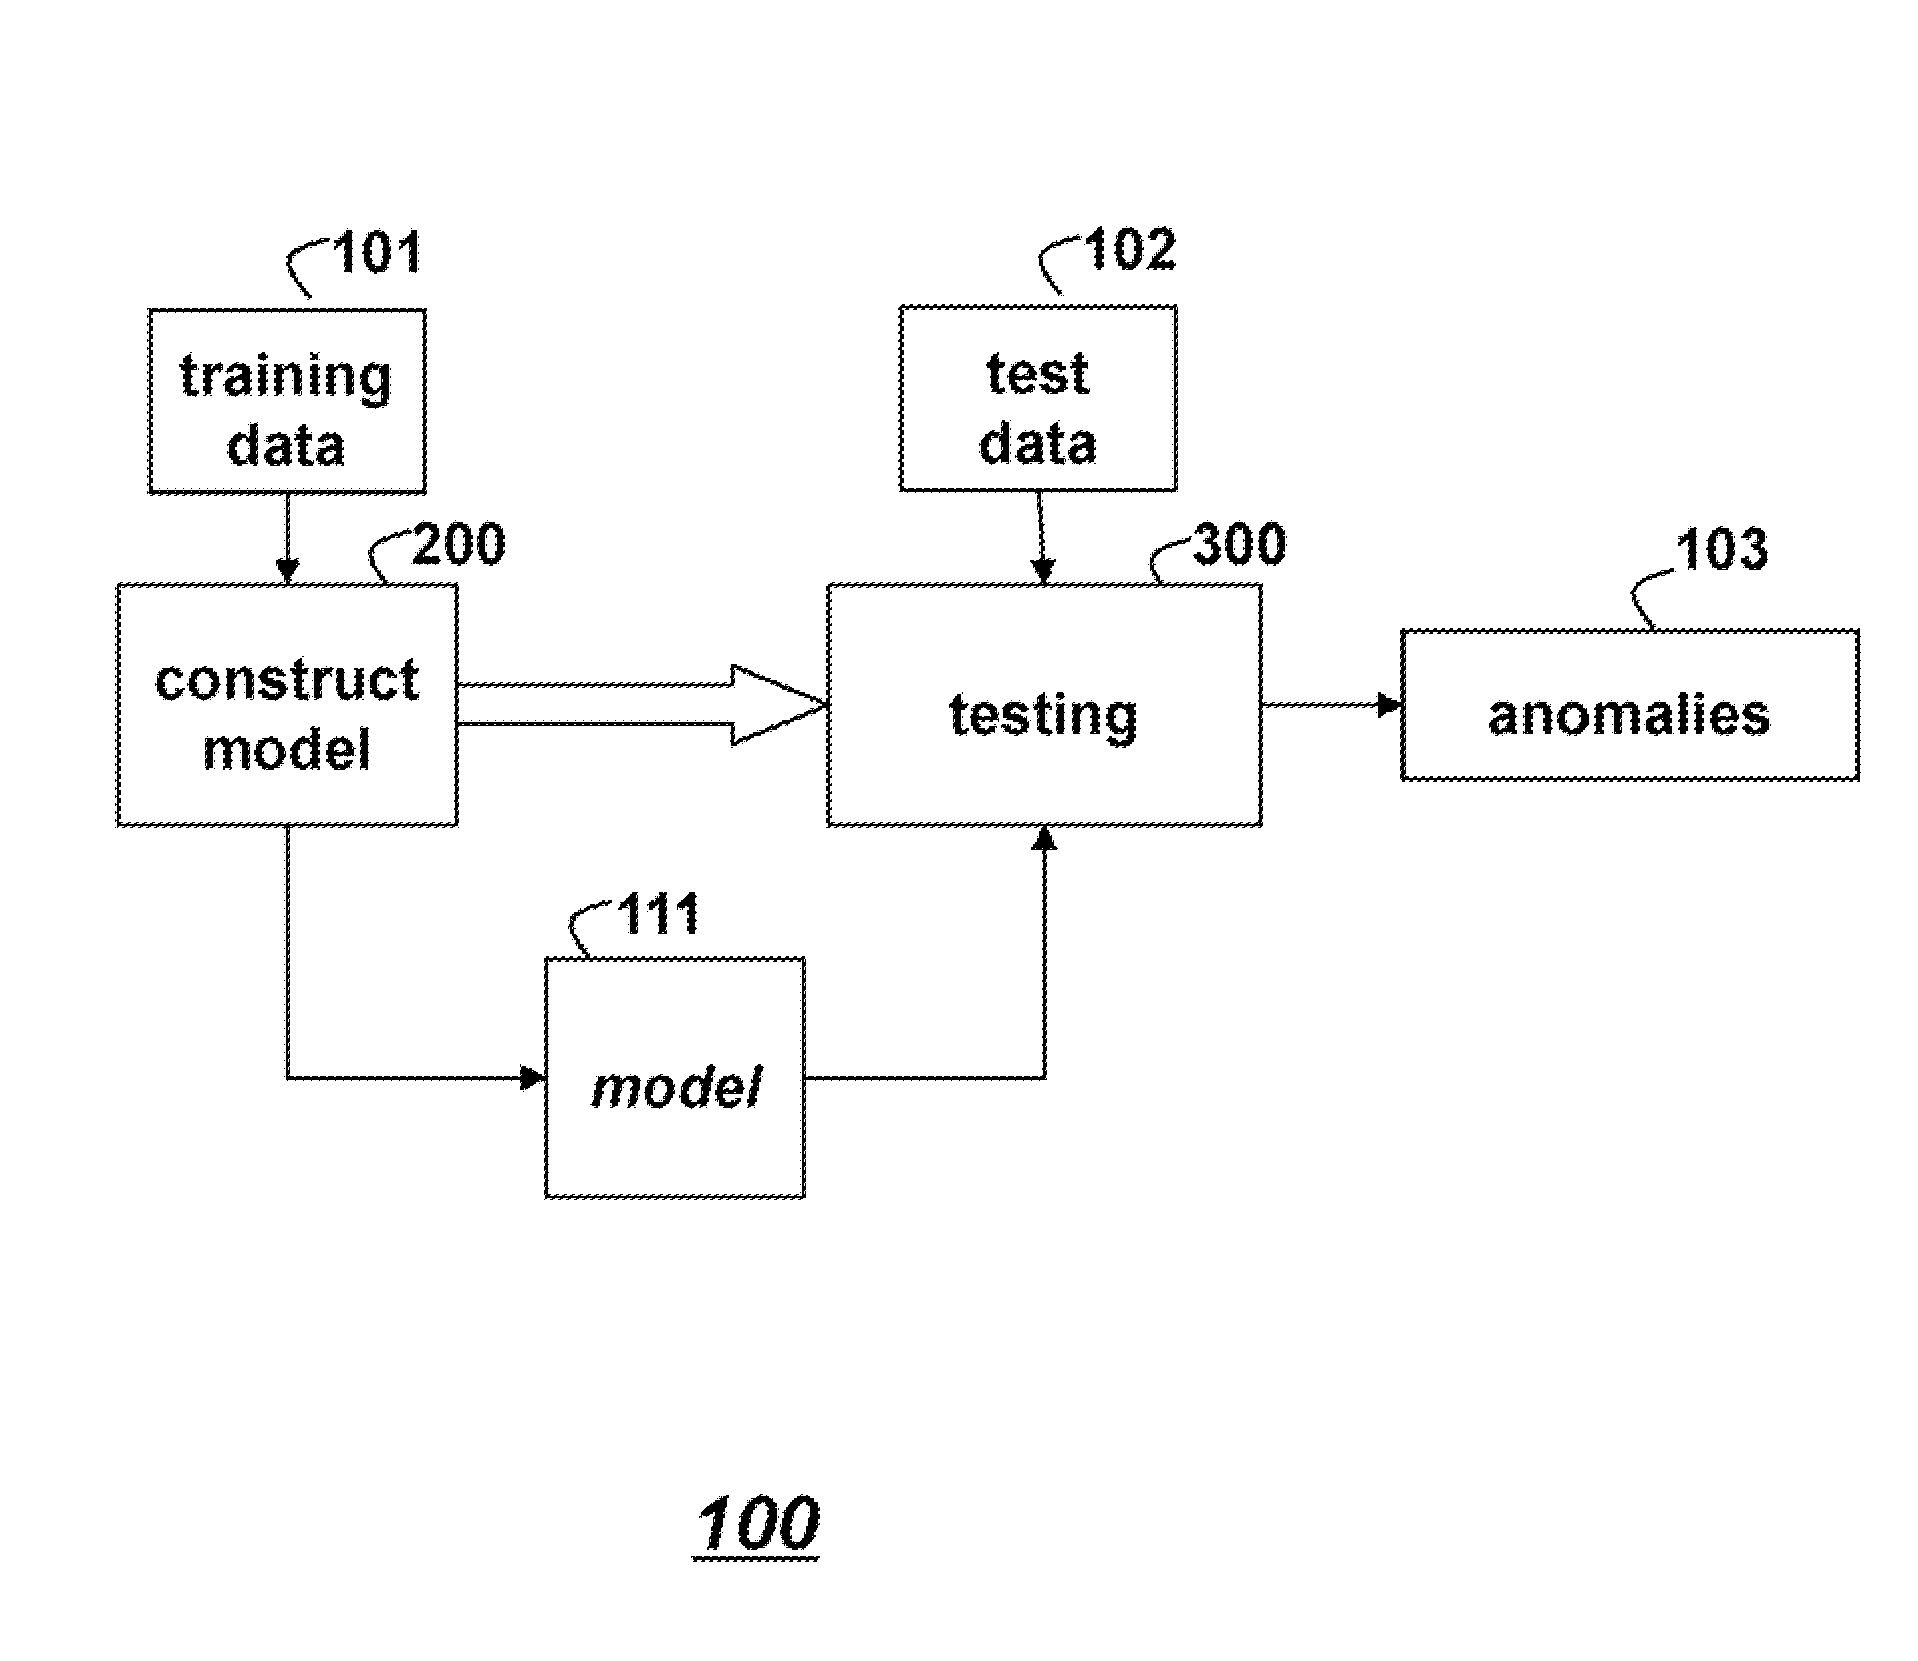
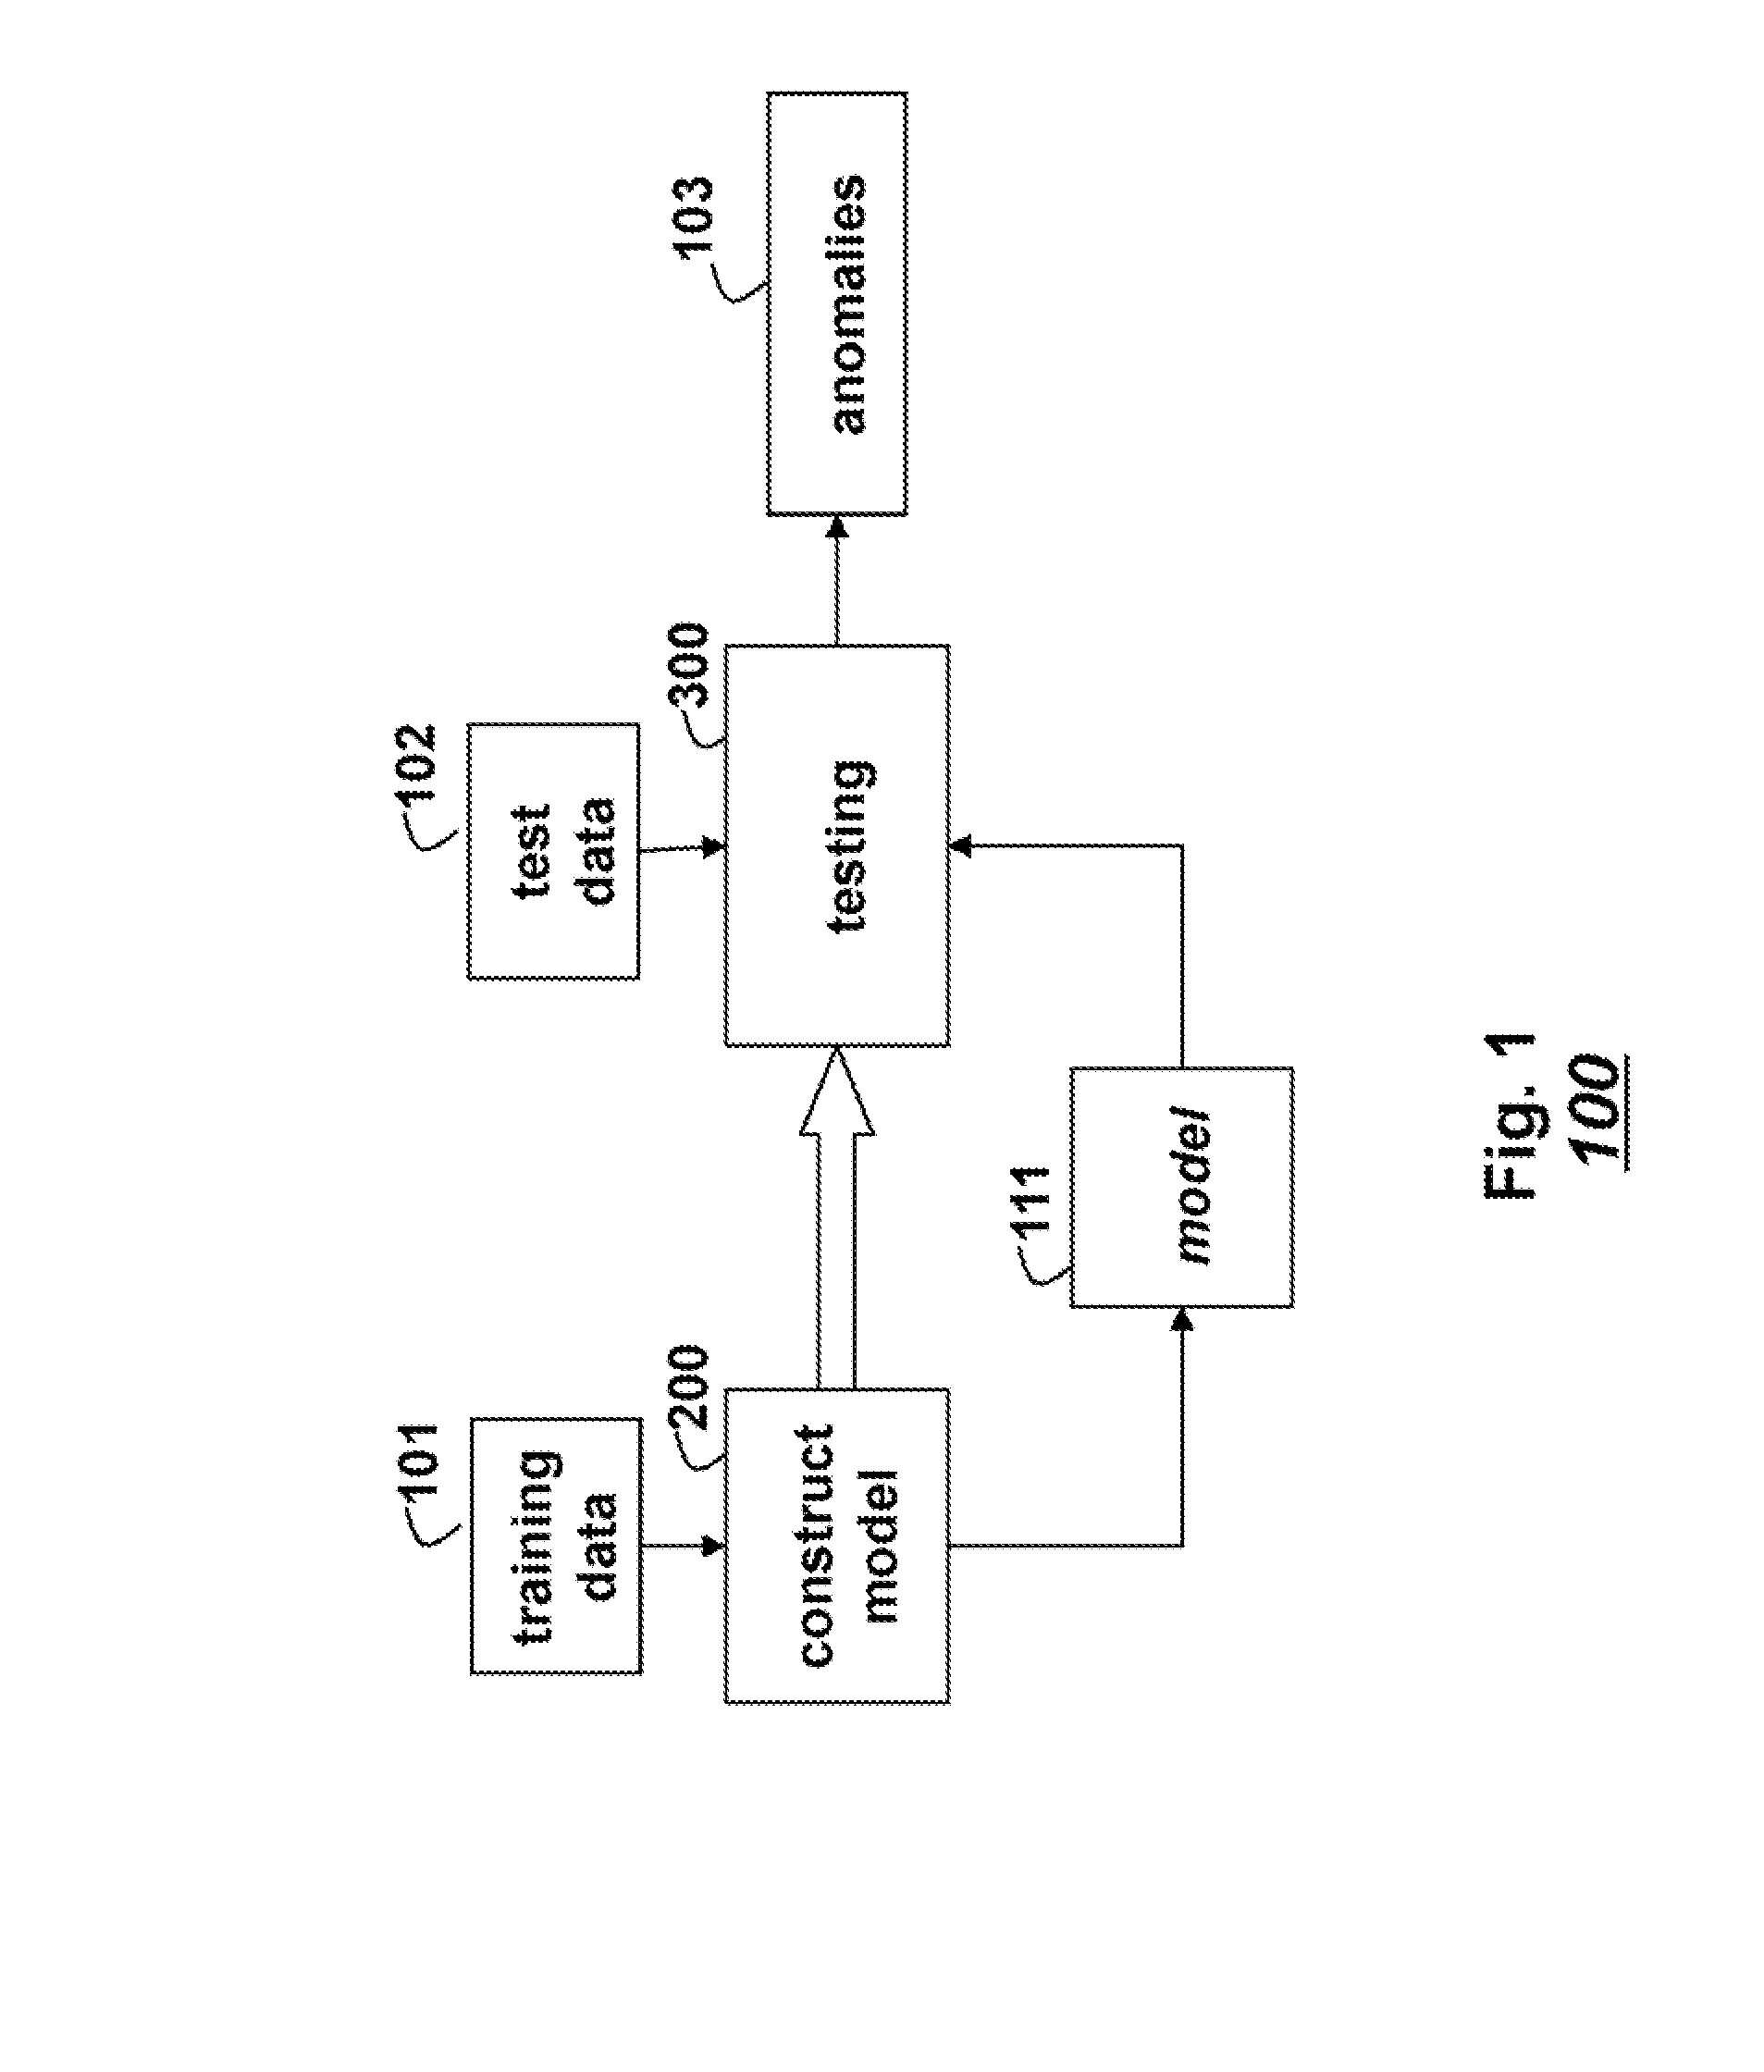
[0010]The embodiments of our invention provide a method for detecting anomalies in multivariate time series data. Specifically, time series data acquired by sensors of equipment. Multivariate time series arise in many different applications. We are particularly interested in monitoring equipment condition.

[0011]Equipment condition monitoring is the process of analyzing signals from various sensors attached to equipment, such as pumps, condensors, fans, etc., to determine if the equipment is operating normally, or not. The sensors, such as vibration sensors, pressure sensors, temperature sensors, etc., output a series of sensor data, which is called a time series. When data from multiple sensor are available, the time series is a multivariate time series. Each dimension of the multivariate time series contains data from one sensor.

[0012]The goal of equipment monitoring is to analyze the time series data from equipment sensors to automatically detect if the equipment has failed, or, p...


PUM


Abstract

A method detects anomalies in time series data, wherein the time series data is multivariate, by partitioning time series training data into partitions. A representation for each partition in each time window is determined to form a model of the time series training data, wherein the model includes representations of distributions of the time series training data. The representations obtained from partitions of time series test data are compared to the model to obtain anomaly scores.

Description

FIELD OF THE INVENTION[0001]This invention relates generally to processing time series data, and more particularly to determine anomalies during operation of equipment from time series data acquired by sensors.BACKGROUND OF THE INVENTION[0002]Equipment monitoring can avoid costly repairs. This can be done by analyzing time series data acquired by sensors. One method treats each multivariate data point at time t independently. That method does not use sliding windows over time. Because that method does not analyze data in time windows, the method cannotdetect “collective anomalies,” which are anomalies in the dynamics of a variable, i.e., changes over time. That method does not compute any feature vectors, or representation of the data. The method simply compares raw time series test data with raw training data.[0003]Another method assumes multivariate time series can be modeled locally as a vector autoregressive (AR) model. This is a fairly restrictive assumption. That method first ...

Claims


Application Information

Patent Timeline
IPC IPC(8): G06F15/18G06F11/07G06N20/00
CPCG06F11/07G06N99/005G06K9/6256G05B23/02G05B23/0243G06N20/00G06F18/214
Inventor JONES, MICHAEL JEFFREYNIKOVSKI, DANIEL NIKOLAEV
Owner MITSUBISHI ELECTRIC RES LAB INC
Why Eureka
Try Eureka