Synchronization of time between different simulation models
What is AI technical title?
AI technical title is built by Patsnap AI team. It summarizes the technical point description of the patent document.
a technology of synchronizing time and simulation models, applied in the field of simulation modeling, can solve problems such as complicated planning of such modeling and analysis
Inactive Publication Date: 2014-07-31
IBM CORP
View PDF7 Cites 9 Cited by
Summary
Abstract
Description
Claims
Application Information
AI Technical Summary
This helps you quickly interpret patents by identifying the three key elements:
Problems solved by technology
Method used
Benefits of technology
Benefits of technology
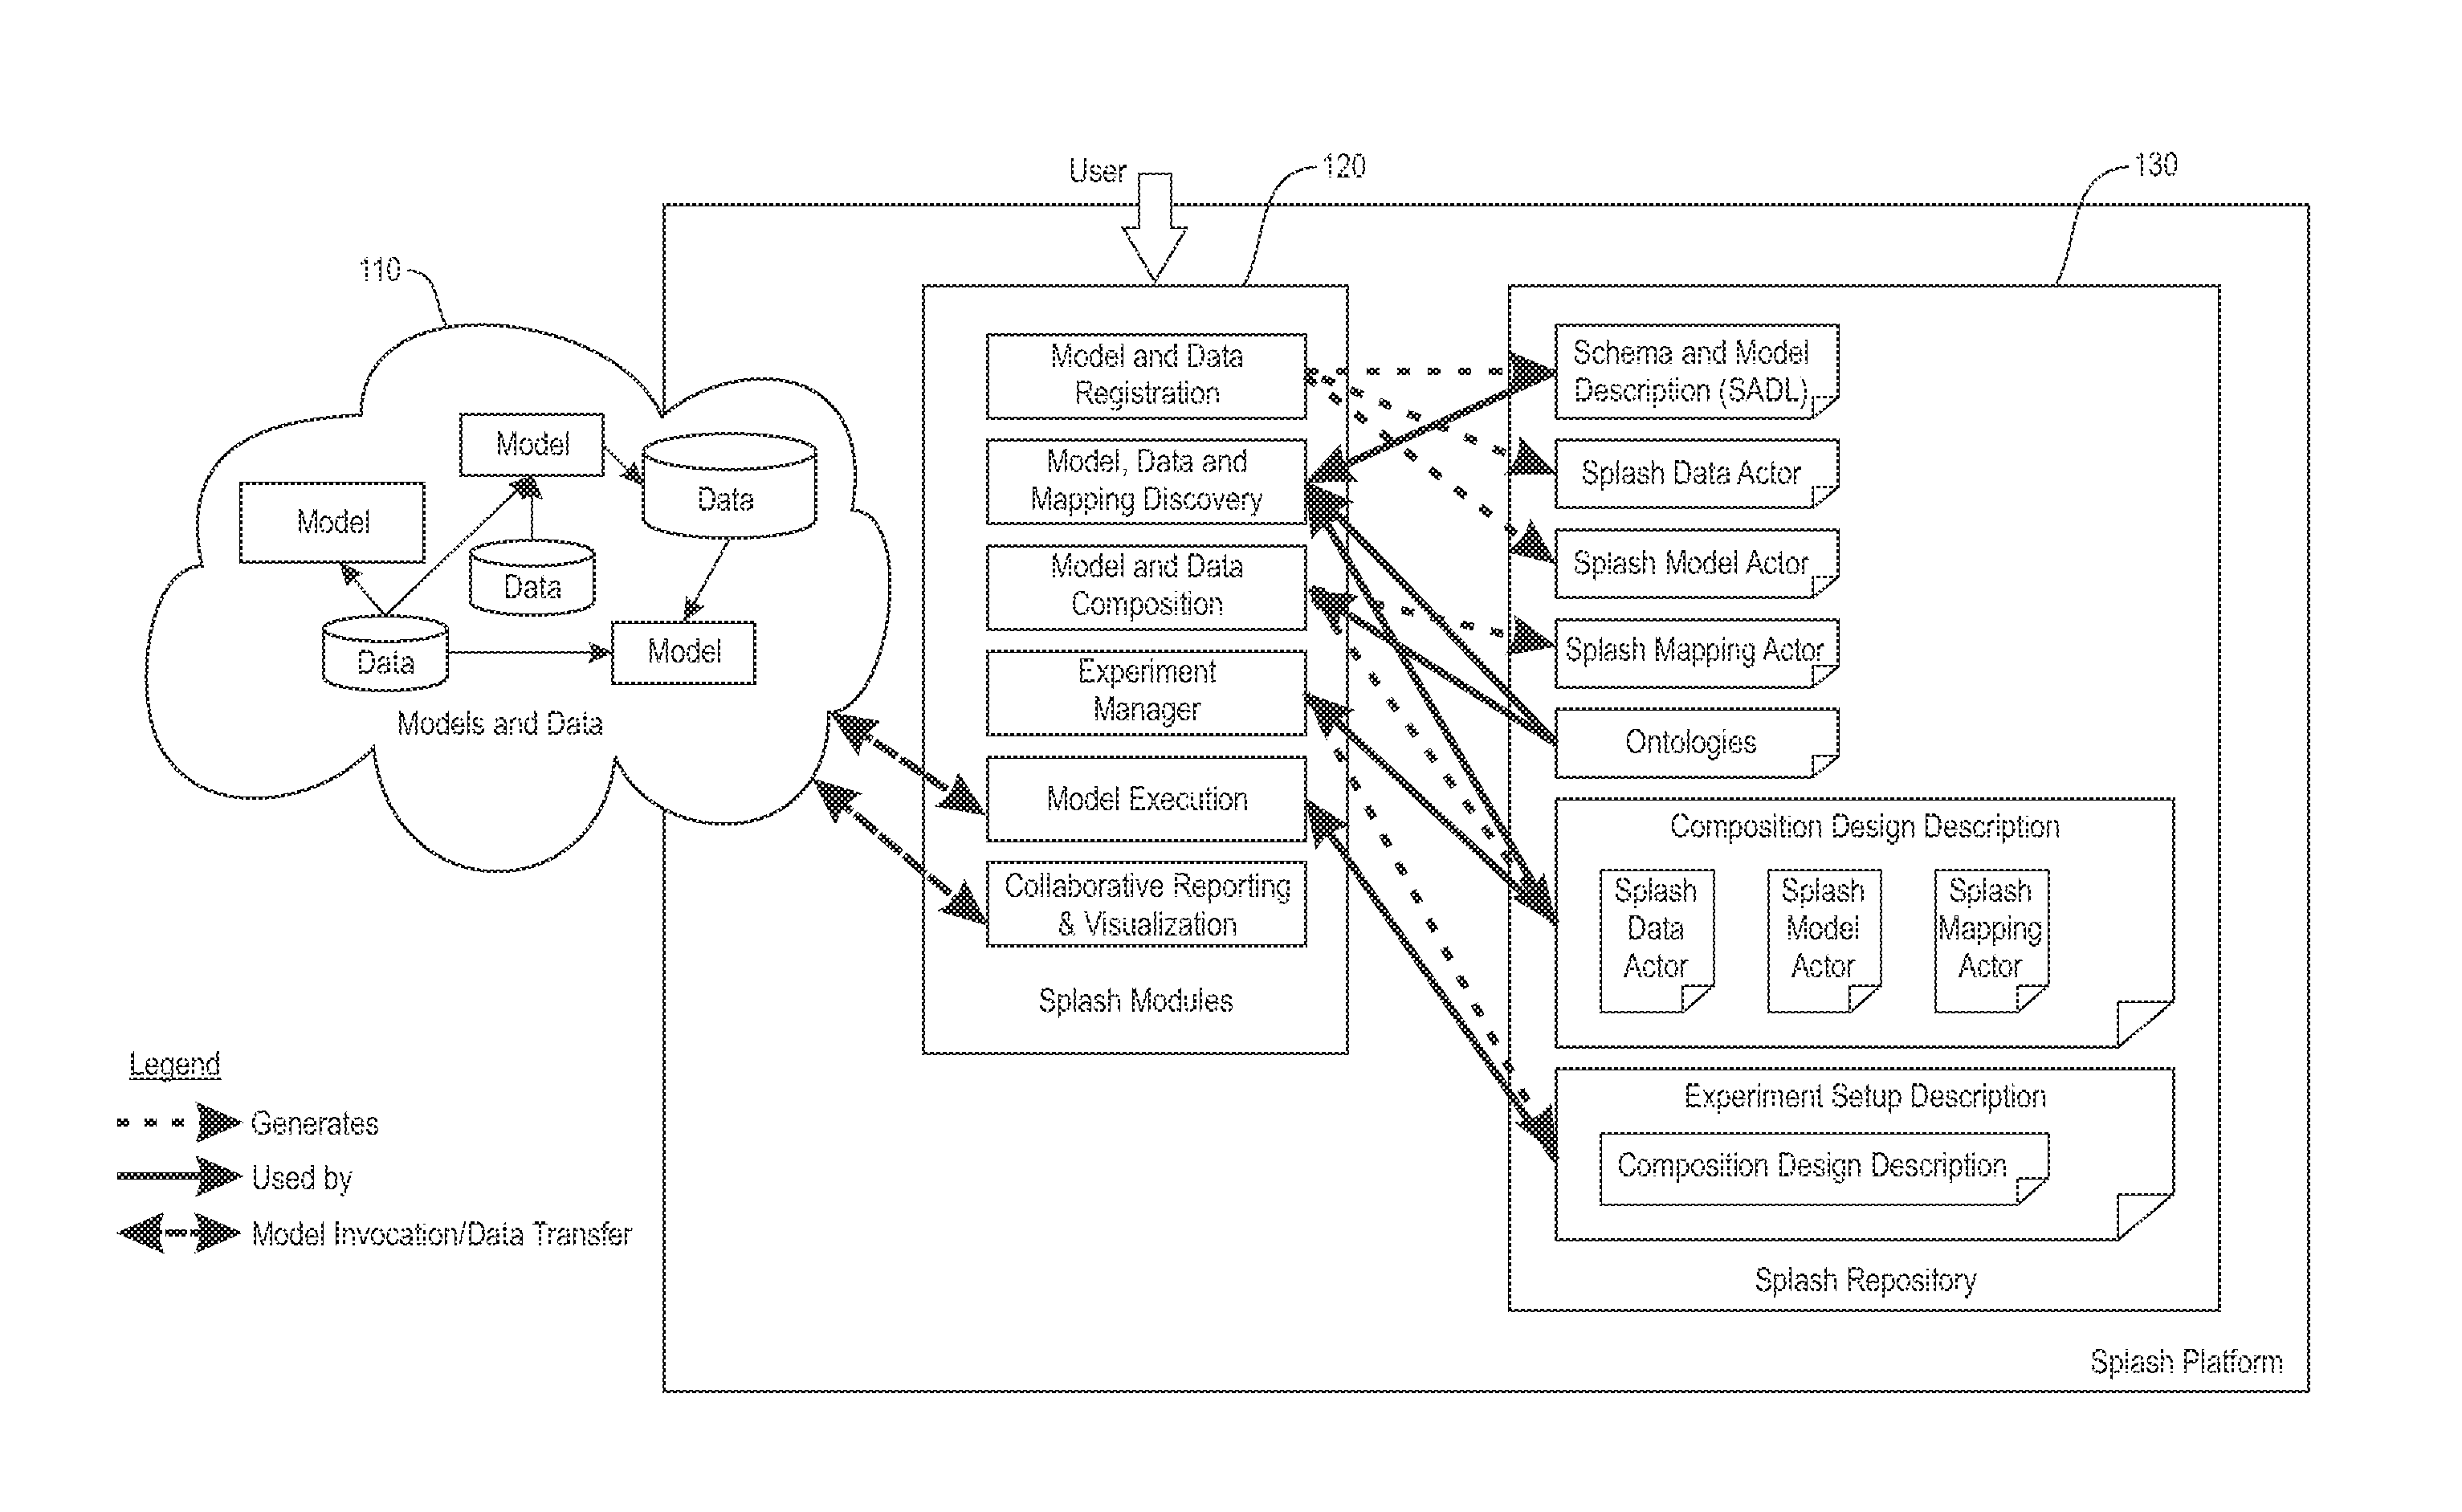
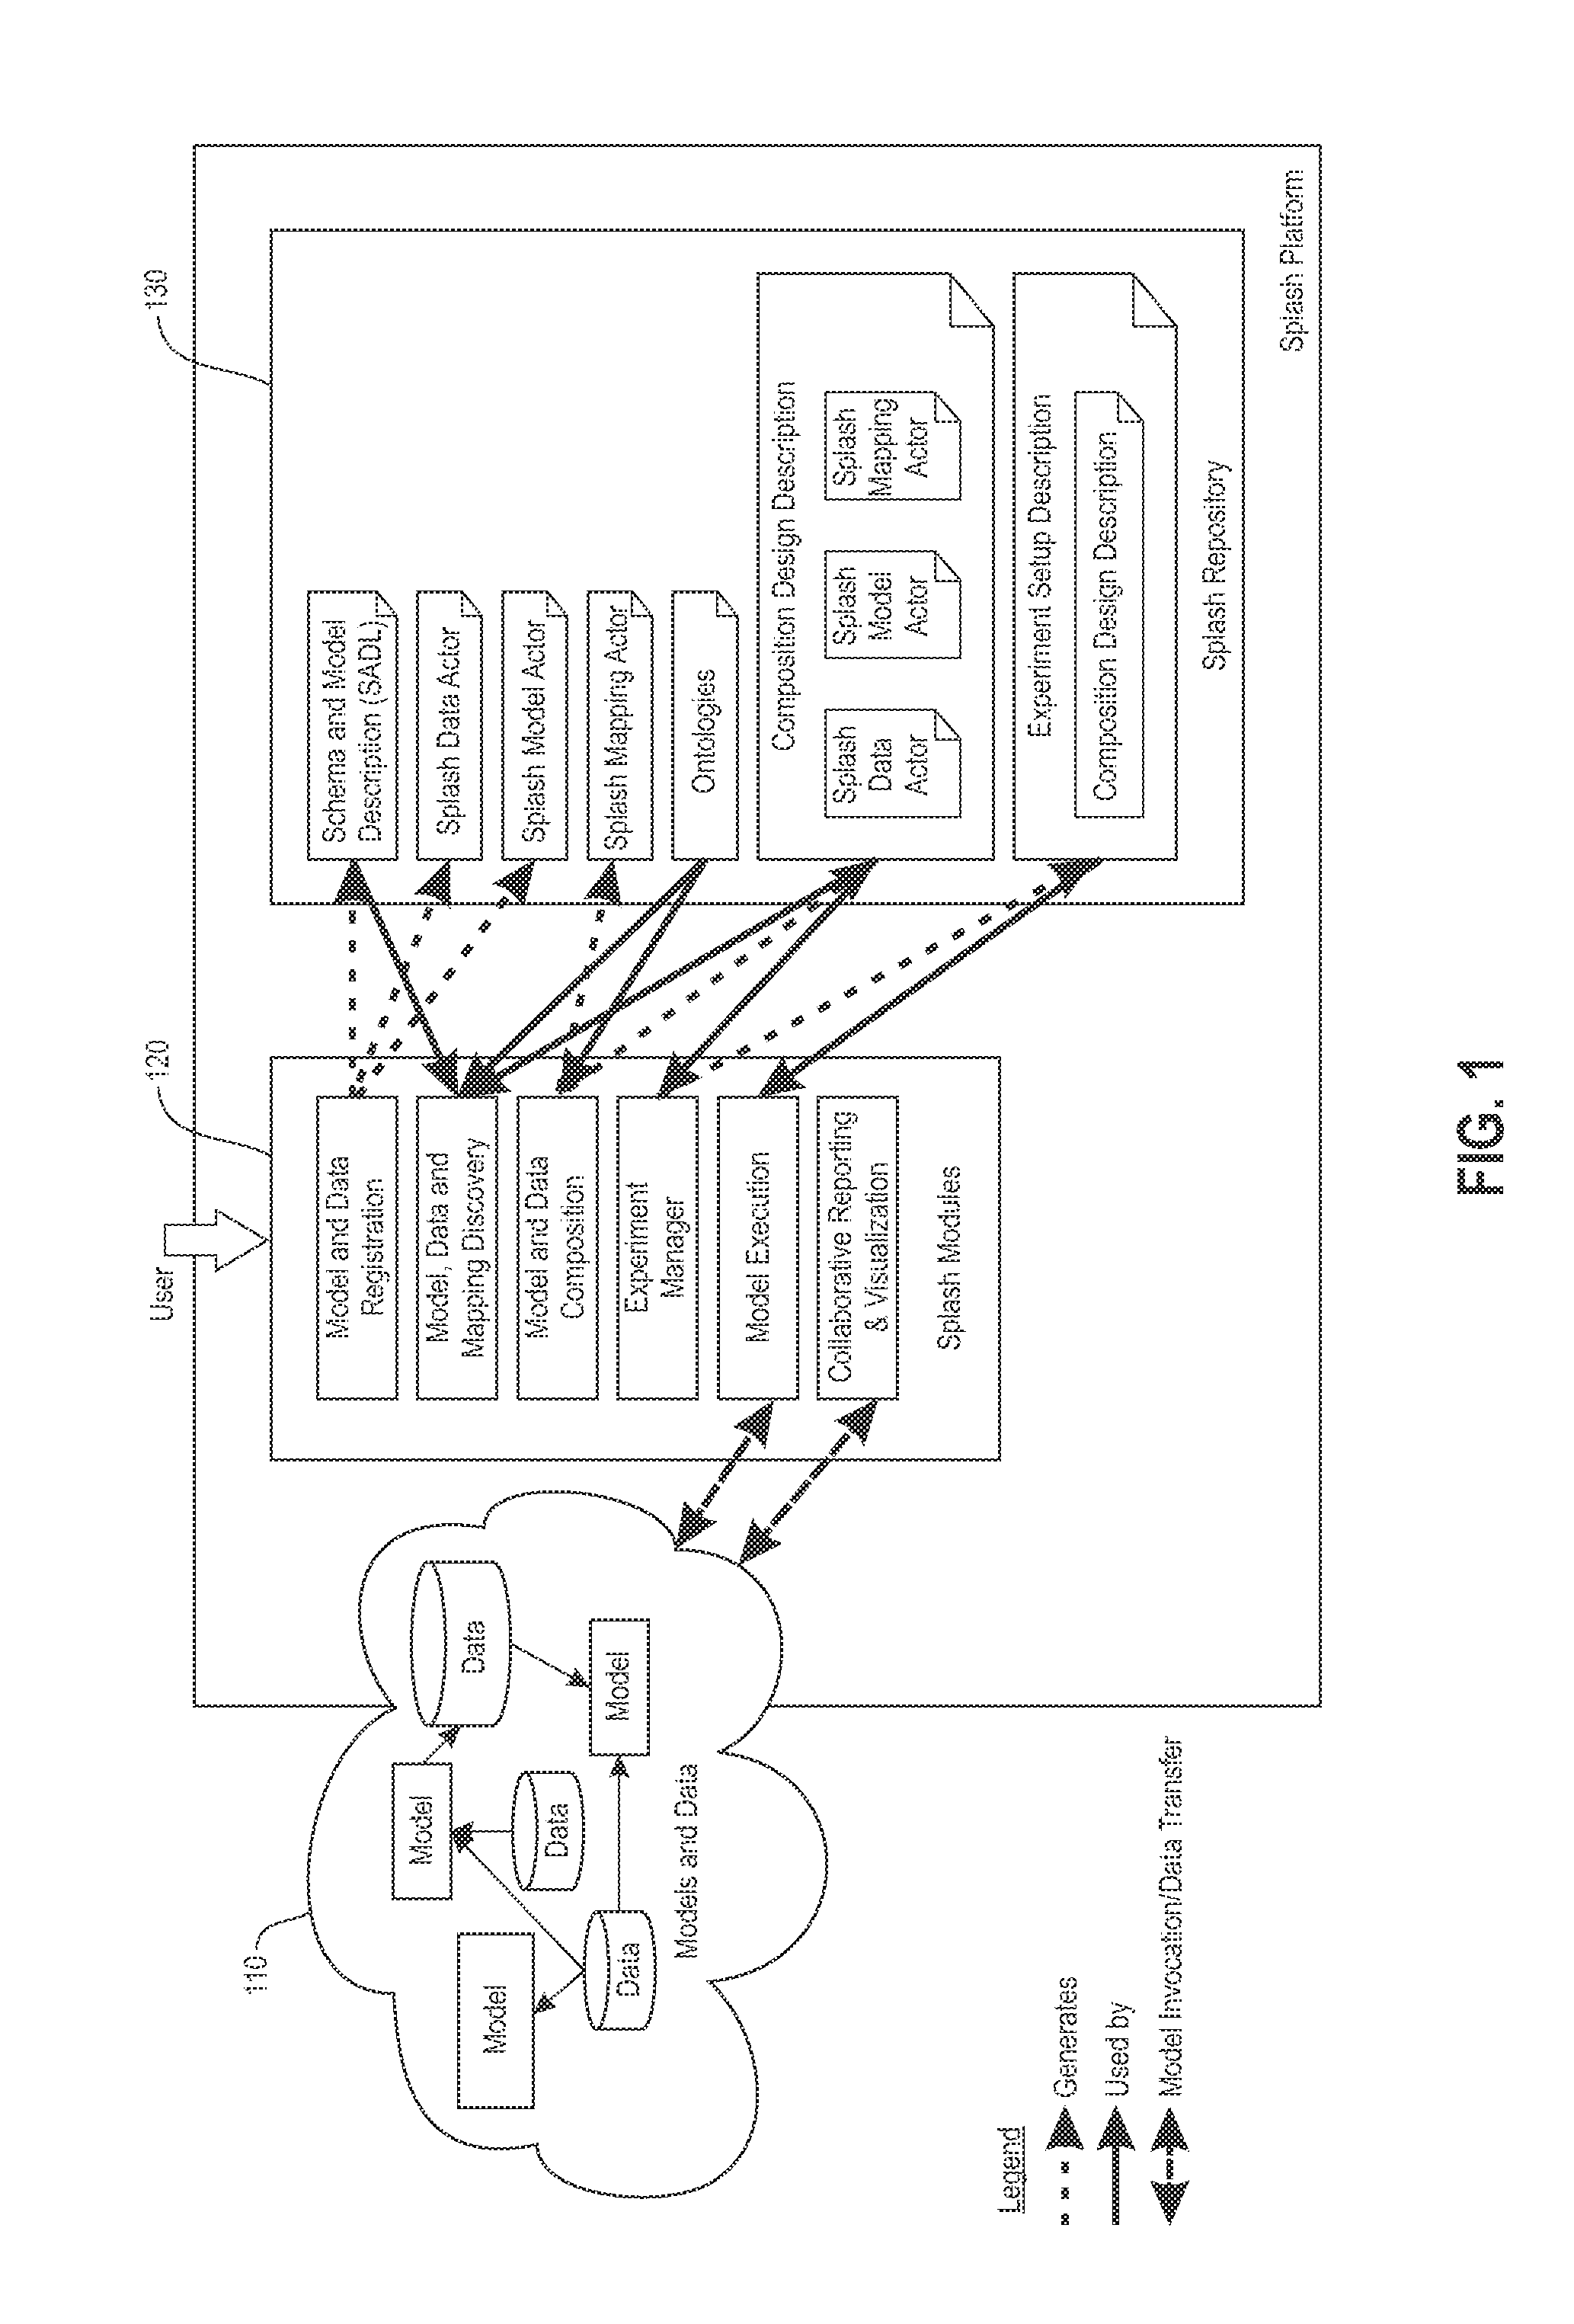
The patent describes a system for creating a composite simulation model by combining different time-series data sets. The system can automatically determine if the data sets are aligned in time and convert the data accordingly. This allows for the creation of more accurate and reliable models for simulating various scenarios. Another embodiment of the patent describes a system that automatically determines the specifics of a new time domain for a given model and inputs requirements. Overall, the patent provides techniques for improving the efficiency and accuracy of creating and using simulation models.
Problems solved by technology
Planning such modeling and analysis is complicated because high level decisions frequently require understanding of multilayered interactions relating to diverse systems across a great many domains and disciplines.
Method used
Image
Click on the blue label to locate the original text in one second.
Reading with bidirectional positioning of images and text.
Examples
case 1
[0063]Aggregation-since-start: First consider measurements that represent the SUM of some quantity since the start of the measurement period, e.g., the start of the simulation. The window for a target time ti is:
Wio(sj,dj),(sj+1,dj+1)
As
[0064]before, j=max{n:sn≦ti}, so that sj≦tij+1. The alignment function sets
d~i=dj+(dj+1-dj)ti-sjsj+1-sj.(1)
[0065]To estimate the AVERAGE of some quantity since the start of measurement, use the same window but with the following alignment function:
d~i=1ti[Dj+(Dj+1-Dj)ti-sjsi+1-si],
[0066]This formula is obtained by multiplying each pertinent cumulative-average data point di in the source by si to convert it to a cumulative sum, then applying (1) to estimate the cumulative sum at time ti, and finally converting this cumulative sum to a cumulative average via division by ti.
case 2
[0067]Aggregation-since-last: when the source measurements represent the SUM since the last (source) tick, the estimation formulas become more complicated. The window is
Wi=(sj,dj),(sj+1,dj+1), . . . ,(sj+k,dj+k)[0068]where j=max{n:sn≦ti−1} and k=min{n:sj+n≧ti}. Thus sj is the greatest source time point less than or equal to ti−1 and sn+k is the smallest source time point greater than or equal to to; see FIG. 6. For 1≦i≦nt, the alignment formula is then
When the target time points are denser on the time axis than the source time points, use of the estimation formula (2) results in the allocation method discussed. Thus allocation can be viewed as a special case of aggregation. Recall that t0=0 by assumption. When i=0, the convention is adopted that
od0=d0 if t0=s0o
If, on the other hand:
s0<ot0<s1o, then {tilde over (d)}0o
is computed from (2), usin...
PUM
Abstract
An aspect of synchronization of time between simulation models includes receiving a specification request for generating a set of target time-series data using a set of source time-series data, obtaining specification information relating to the set of source time-series data, obtaining specification information relating to the set of target time-series data and obtaining the source time-series data; comparing the source specification information and the target specification information to determine if the set of source time-series data are time-aligned with the set of target time-series data, and converting the set of source time-series data to the set of target time-series data upon determination that time alignment is needed.
Description
CROSS REFERENCE TO RELATED APPLICATION[0001]This application is a continuation of U.S. patent application Ser. No. 13 / 750,789, filed Jan. 25, 2013, the disclosure of which is incorporated by reference herein in its entirety.BACKGROUND[0002]The present disclosure relates generally to simulation modeling and more particularly to synchronization of time between different simulation models.[0003]Modern policy, planning, and investment decisions are often made in the context of a complex system. Making good policy and investment decisions requires not just the gathering, mining, statistical analysis, and visualization of data, but also the use of simulation models that can predict future behaviors. This is to help analyze the potential impacts of alternative decisions on future outcomes. Planning such modeling and analysis is complicated because high level decisions frequently require understanding of multilayered interactions relating to diverse systems across a great many domains and d...
Claims
Application Information
Patent Timeline
Application Date:The date an application was filed.
Publication Date:The date a patent or application was officially published.
First Publication Date:The earliest publication date of a patent with the same application number.
Issue Date:Publication date of the patent grant document.
PCT Entry Date:The Entry date of PCT National Phase.
Estimated Expiry Date:The statutory expiry date of a patent right according to the Patent Law, and it is the longest term of protection that the patent right can achieve without the termination of the patent right due to other reasons(Term extension factor has been taken into account ).
Invalid Date:Actual expiry date is based on effective date or publication date of legal transaction data of invalid patent.
Patent Type & AuthorityApplications(United States)
IPC IPC(8): G06F17/30
CPCG06F17/30575G06F16/275G06F16/27
InventorHAAS, PETER J.LI, YINANMAK, RONALDTAN, WANG-CHIEWTERRIZZANO, IGNACIO

