Key indicators view

a key indicator and view technology, applied in the field of data processing and management systems, can solve the problems of specific structure, laborious machine data mining for analytic insights, and tools to efficiently opera

Active Publication Date: 2013-11-28
SPLUNK INC
View PDF22 Cites 395 Cited by
  • Summary
  • Abstract
  • Description
  • Claims
  • Application Information

AI Technical Summary

Benefits of technology

[0005]Systems and computer-implemented methods are provided for displaying a configurable metric relating to an environment in a graphical display along with a value of the metric calculated over a configurable time period. The metric is used to identify

Problems solved by technology

Unfortunately, however, a lack of tools to efficiently process and analyze heterogeneous datasets makes it tedious to mine the machine data for analytic insights.
While the machine data may have some loosely implied structure, the specific structure varies across systems and environments, and is subject to frequent and unexpected changes.
Due to the large scale and temporal organization of log entries, traditional analysis techniques are often unsuitable for these datasets.
But once this data is summarized and stored in these predefined database fields, the underlying data is discarded and cannot be later analyzed or used as a basis for new search queries based on different fields or different combinations of fields.
Thus despite being goldmines of information, these machine logs as well as other machine data are rarely explored and often deleted to

Method used


Image

  • Key indicators view
  • Key indicators view
  • Key indicators view

Examples


Embodiment Construction

[0020]Throughout this description for the purposes of explanation, numerous specific details are set forth in order to provide a thorough understanding of the present invention. It will be apparent, however, to one skilled in the art that the present invention may be practiced without some of these specific details. In other instances, well-known structures and devices are shown in block diagram form to avoid obscuring the underlying principles of the described embodiments.

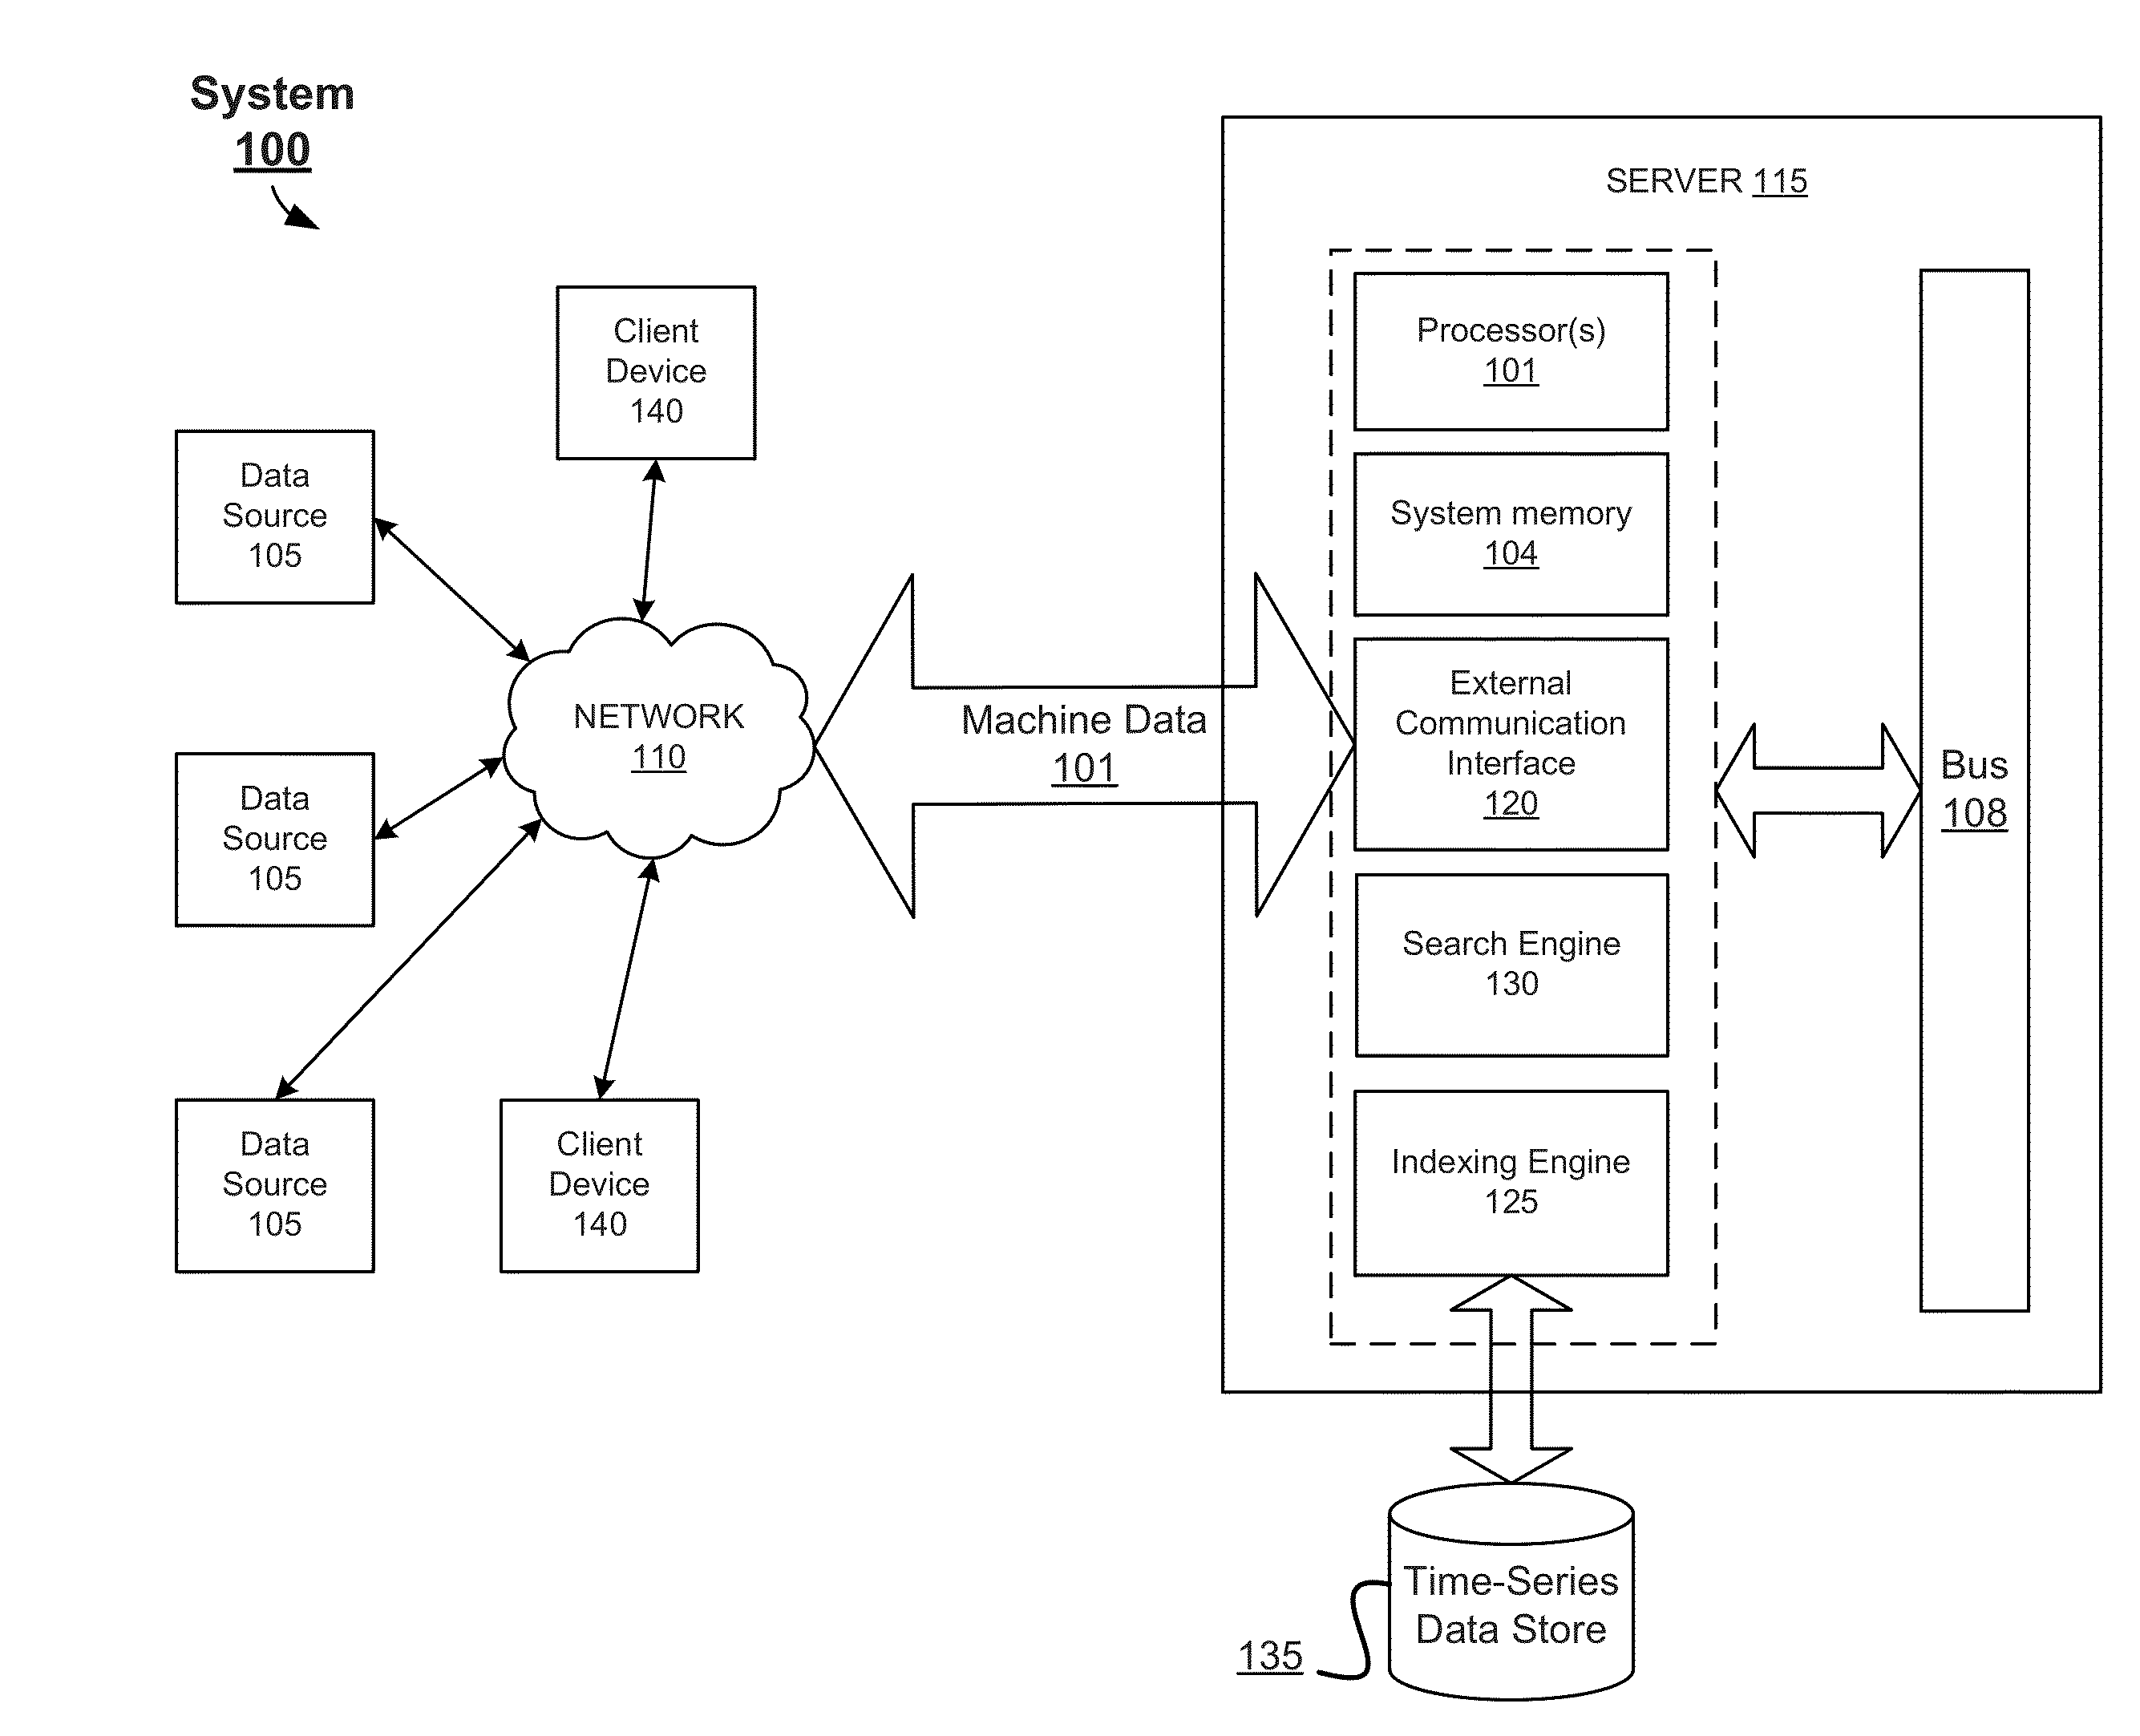
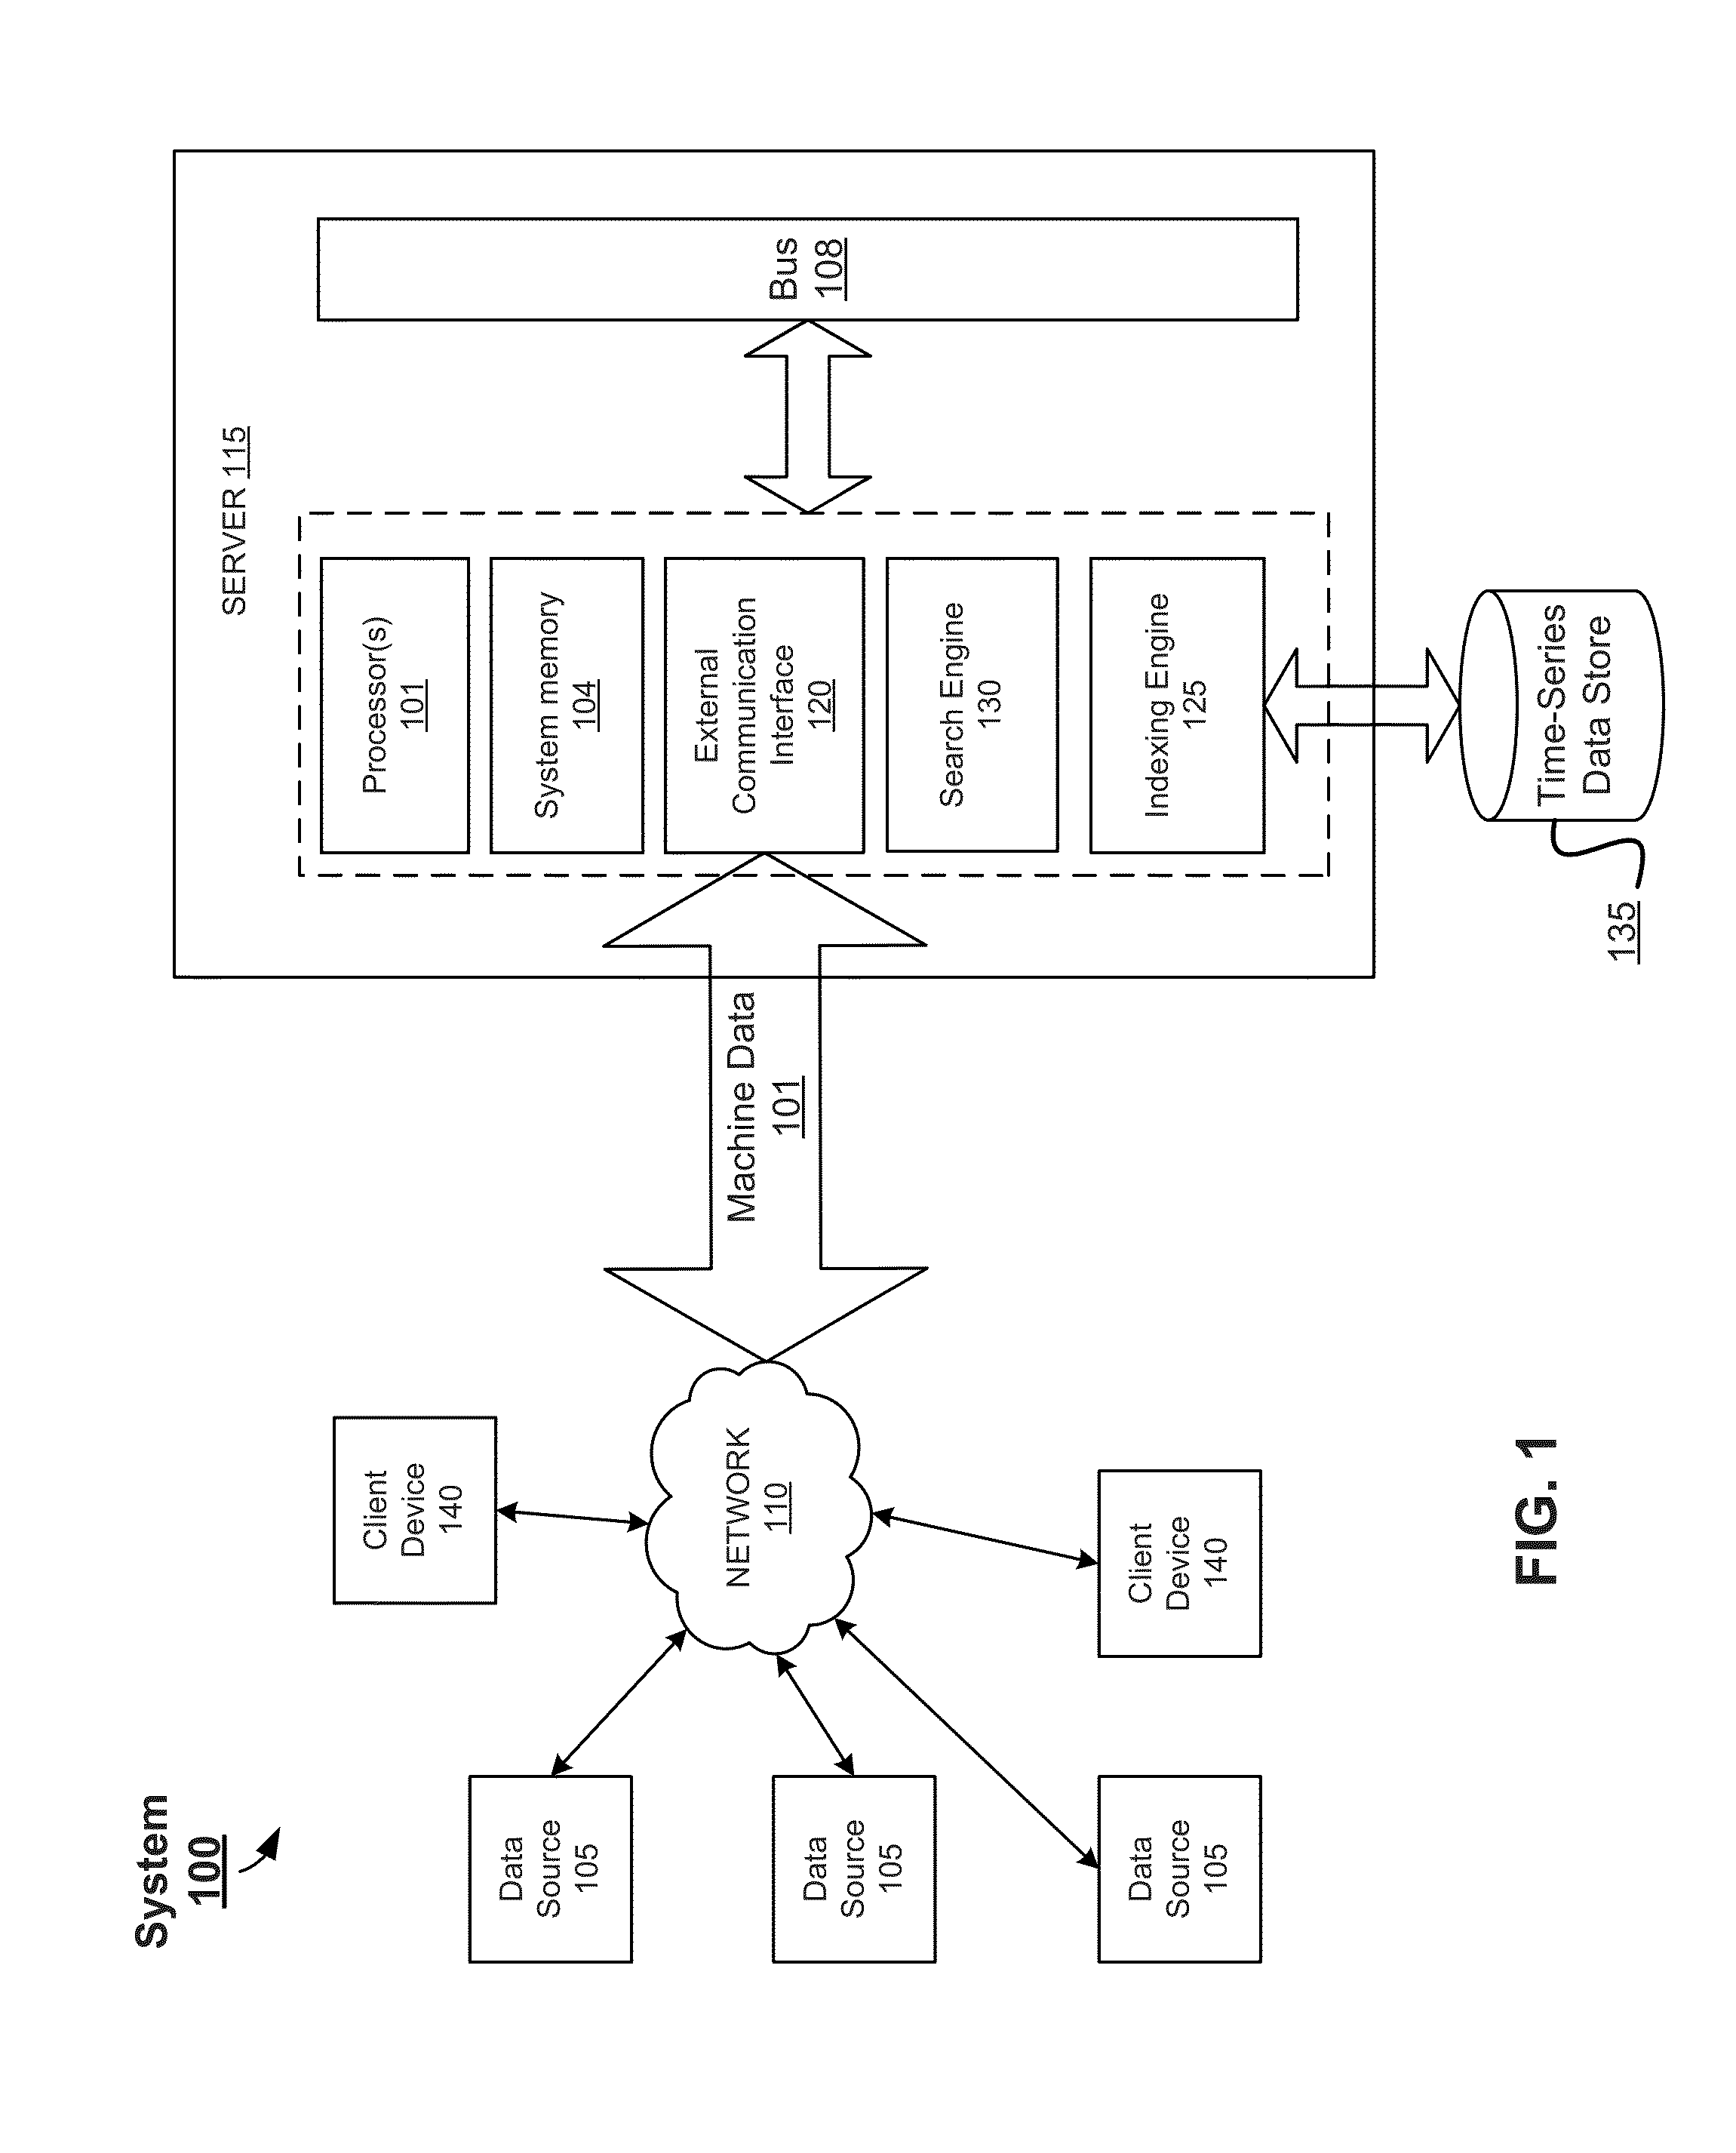
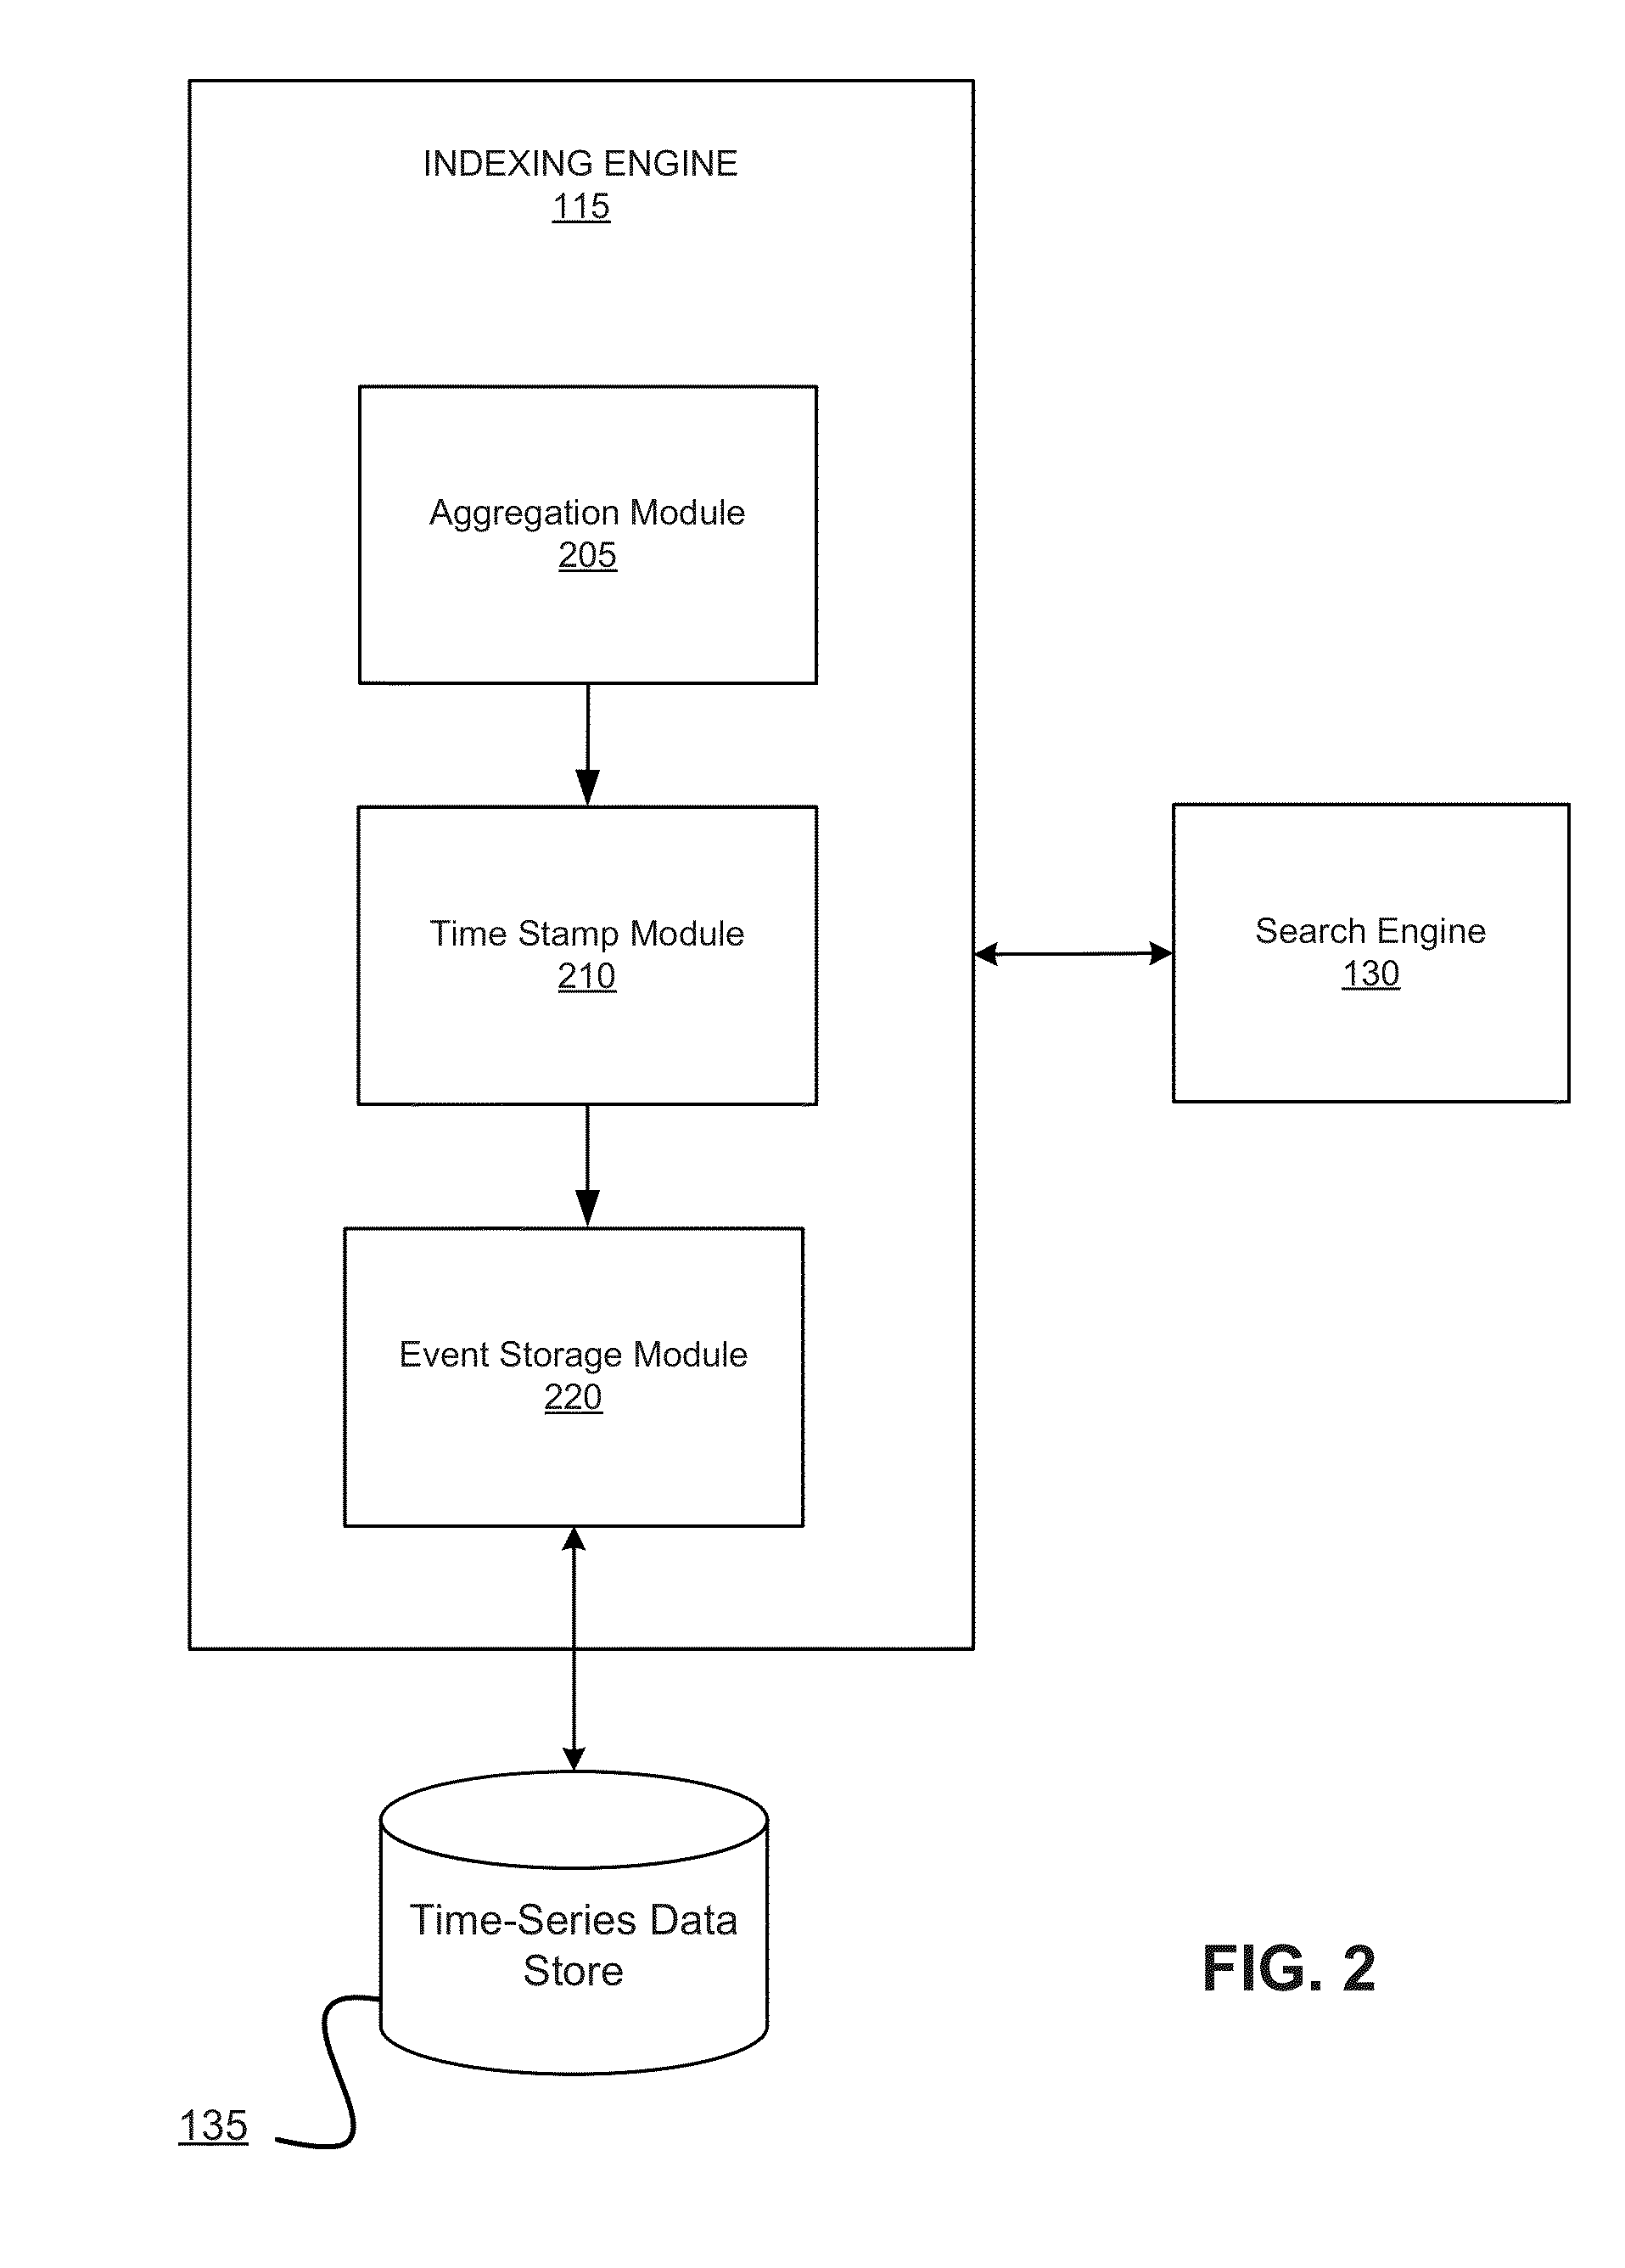
[0021]At least certain embodiments described herein relate to a graphical display of events matching one or more metrics on security data as well as trends in those events over a configurable time period. The graphical display can include a dashboard of metrics on things of interest in an environment. The graphical display allows selection from a list of pre-packaged or pre-defined security metrics and display a corresponding value for each selected metrics on a dashboard display. Selection can be made from a seri...


PUM


Abstract

A system and computer-implemented is provided for displaying a configurable metric relating to an environment in a graphical display along with a value of the metric calculated over a configurable time period. The metric is used to identify events of interest in the environment based on processing real time machine data from one or more sources. The configurable metric is selected and a corresponding value is calculated based on the events of interest over the configurable time period. The value of the metric may be continuously updated in real time based on receiving additional real-time machine data and displayed in a graphical interface as time progresses. Statistical trends in the value of the metric may also be determined over the configurable time period and displayed in the graphical interface as well as an indication if the value of the metric exceeds a configurable threshold value. Further, a selection of one or more thresholds for the value of the metric may be applied and an indication displayed indicating if the threshold(s) have been exceeded.

Description

FIELD OF THE INVENTION[0001]The embodiments described herein relate generally to data processing and management systems. More particularly, embodiments relate to calculating and displaying metrics on real-time data in an environment.BACKGROUND OF THE INVENTION[0002]Information systems generate vast amounts and wide varieties of machine data such as activity logs, configuration files, network messages, database records, etc. This machine data can be useful in troubleshooting systems, detecting operation trends, catching security problems, and measuring business performance. Unfortunately, however, a lack of tools to efficiently process and analyze heterogeneous datasets makes it tedious to mine the machine data for analytic insights. Most machine data such as generated logs, such as syslog and web-server logs, are unstructured text files. While the machine data may have some loosely implied structure, the specific structure varies across systems and environments, and is subject to fr...

Claims


Application Information

Patent Timeline
IPC IPC(8): H04L12/26
CPCH04L43/045H04L41/22G06F16/383G06F16/31G06F16/33G06F16/1734G06F2201/86
Inventor COATES, JOHNMURPHEY, LUCASHANSEN, JAMESHAZEKAMP, DAVID
Owner SPLUNK INC
Why Eureka
Try Eureka