Methods of disease activity profiling for personalized therapy management
- Summary
- Abstract
- Description
- Claims
- Application Information
AI Technical Summary
Benefits of technology
Problems solved by technology
Method used
Image
Examples
example 1
Disease Activity Profiling for Identifying Responders and Non-Responders to Anti-TNFα Biologics
[0412]This example describes methods for personalized therapeutic management of a TNFα-mediated disease in order to optimize therapy or monitor therapeutic efficacy in a subject using the disease activity profiling of the present invention to identify subjects as responders or non-responders to anti-TNF drug therapy.
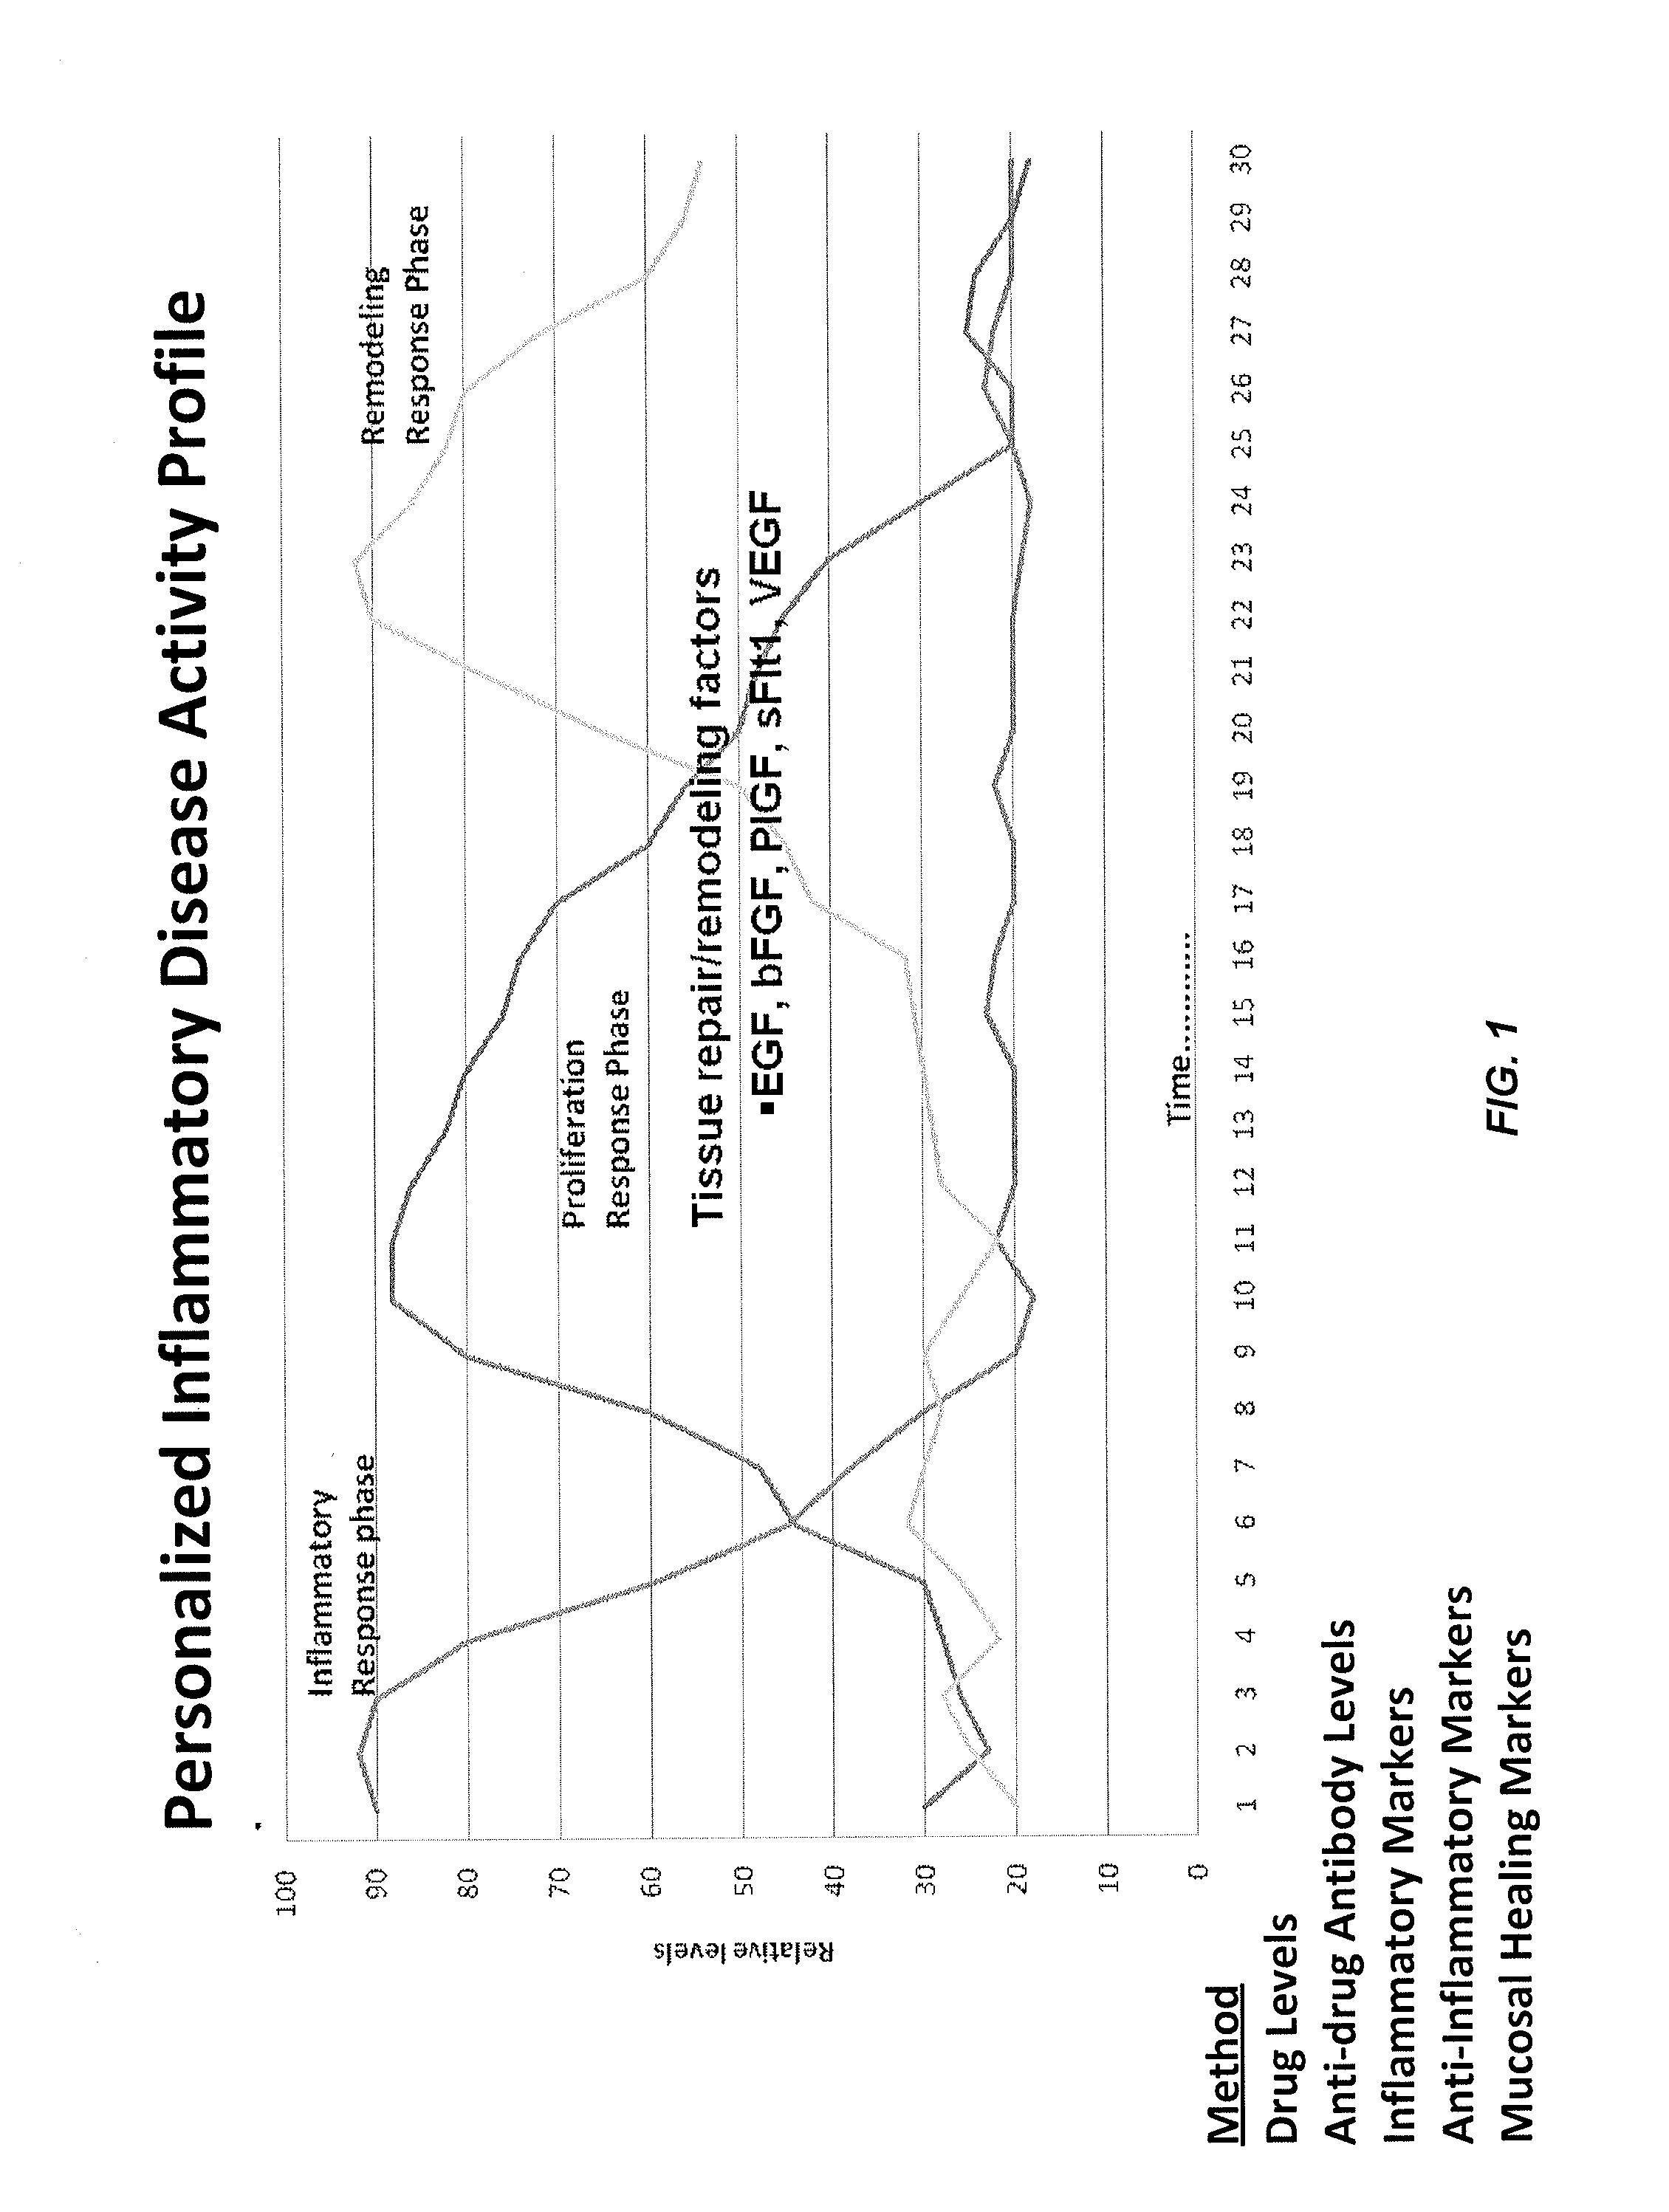
[0413]FIG. 1 illustrates an exemplary IBD wound response profile in which wound progression is divided into inflammatory, proliferative, and remodeling phases. As non-limiting examples, inflammatory response phase markers tested include: anti-TNF drugs such as Remicade (infliximab); anti-drug antibodies (ADA) such as HACA; inflammatory markers such as GM-CSF, IFN-γ, IL-1β, IL-2, IL-6, IL-8, TNF-α, and sTNF RII; and anti-inflammatory markers such as IL-12p70 and IL-10. Non-limiting examples of proliferation response phase markers tested include tissue repair / remodeling factors (...
example 2
Disease Activity Profiling Modeling
[0423]An exemplary 3-dimensional graph rendering of the disease activity profile (DAP) of the present invention includes each of the different markers present in the array of markers on the x-axis, normalized marker levels on the y-axis, and time on the z-axis (e.g., time points wherein samples are taken and marker levels measured). An exemplary topographic map of the DAP of the present invention (also referred to herein as a personalized disease profile) includes each of the different markers present in the array of markers the y-axis, time on the x-axis (e.g., time points wherein samples are taken and marker levels measured), and relative marker levels in grayscale.
[0424]The 3D models described herein represent a novel paradigm for treatment because they are individualized and titratable such that dose adjustments are made in a personalized manner. For example, marker panels including markers such as inflammatory, proliferative, and remodeling ma...
example 3
Infliximab Non-Detection
[0425]This example represents a model for “time-to-event.” In other words, this example uses the Cox Proportional-Hazards Model (CPHM) to model the time it takes for “an event” to occur and the risk of such an event happening. The model is a regression analysis with “time-to-event” on the Y axis, which is a response variable, and “predictor variables” on the X axis. In this example, the non-detection of infliximab (i.e., the concentration of infliximab falling below a detection threshold) is the event, with the potential predictors of such an event being biomarkers: e.g., CRP, IL-2, VEGF, and the like and or clinical information such as age, MTX treatment, gender, and the like.
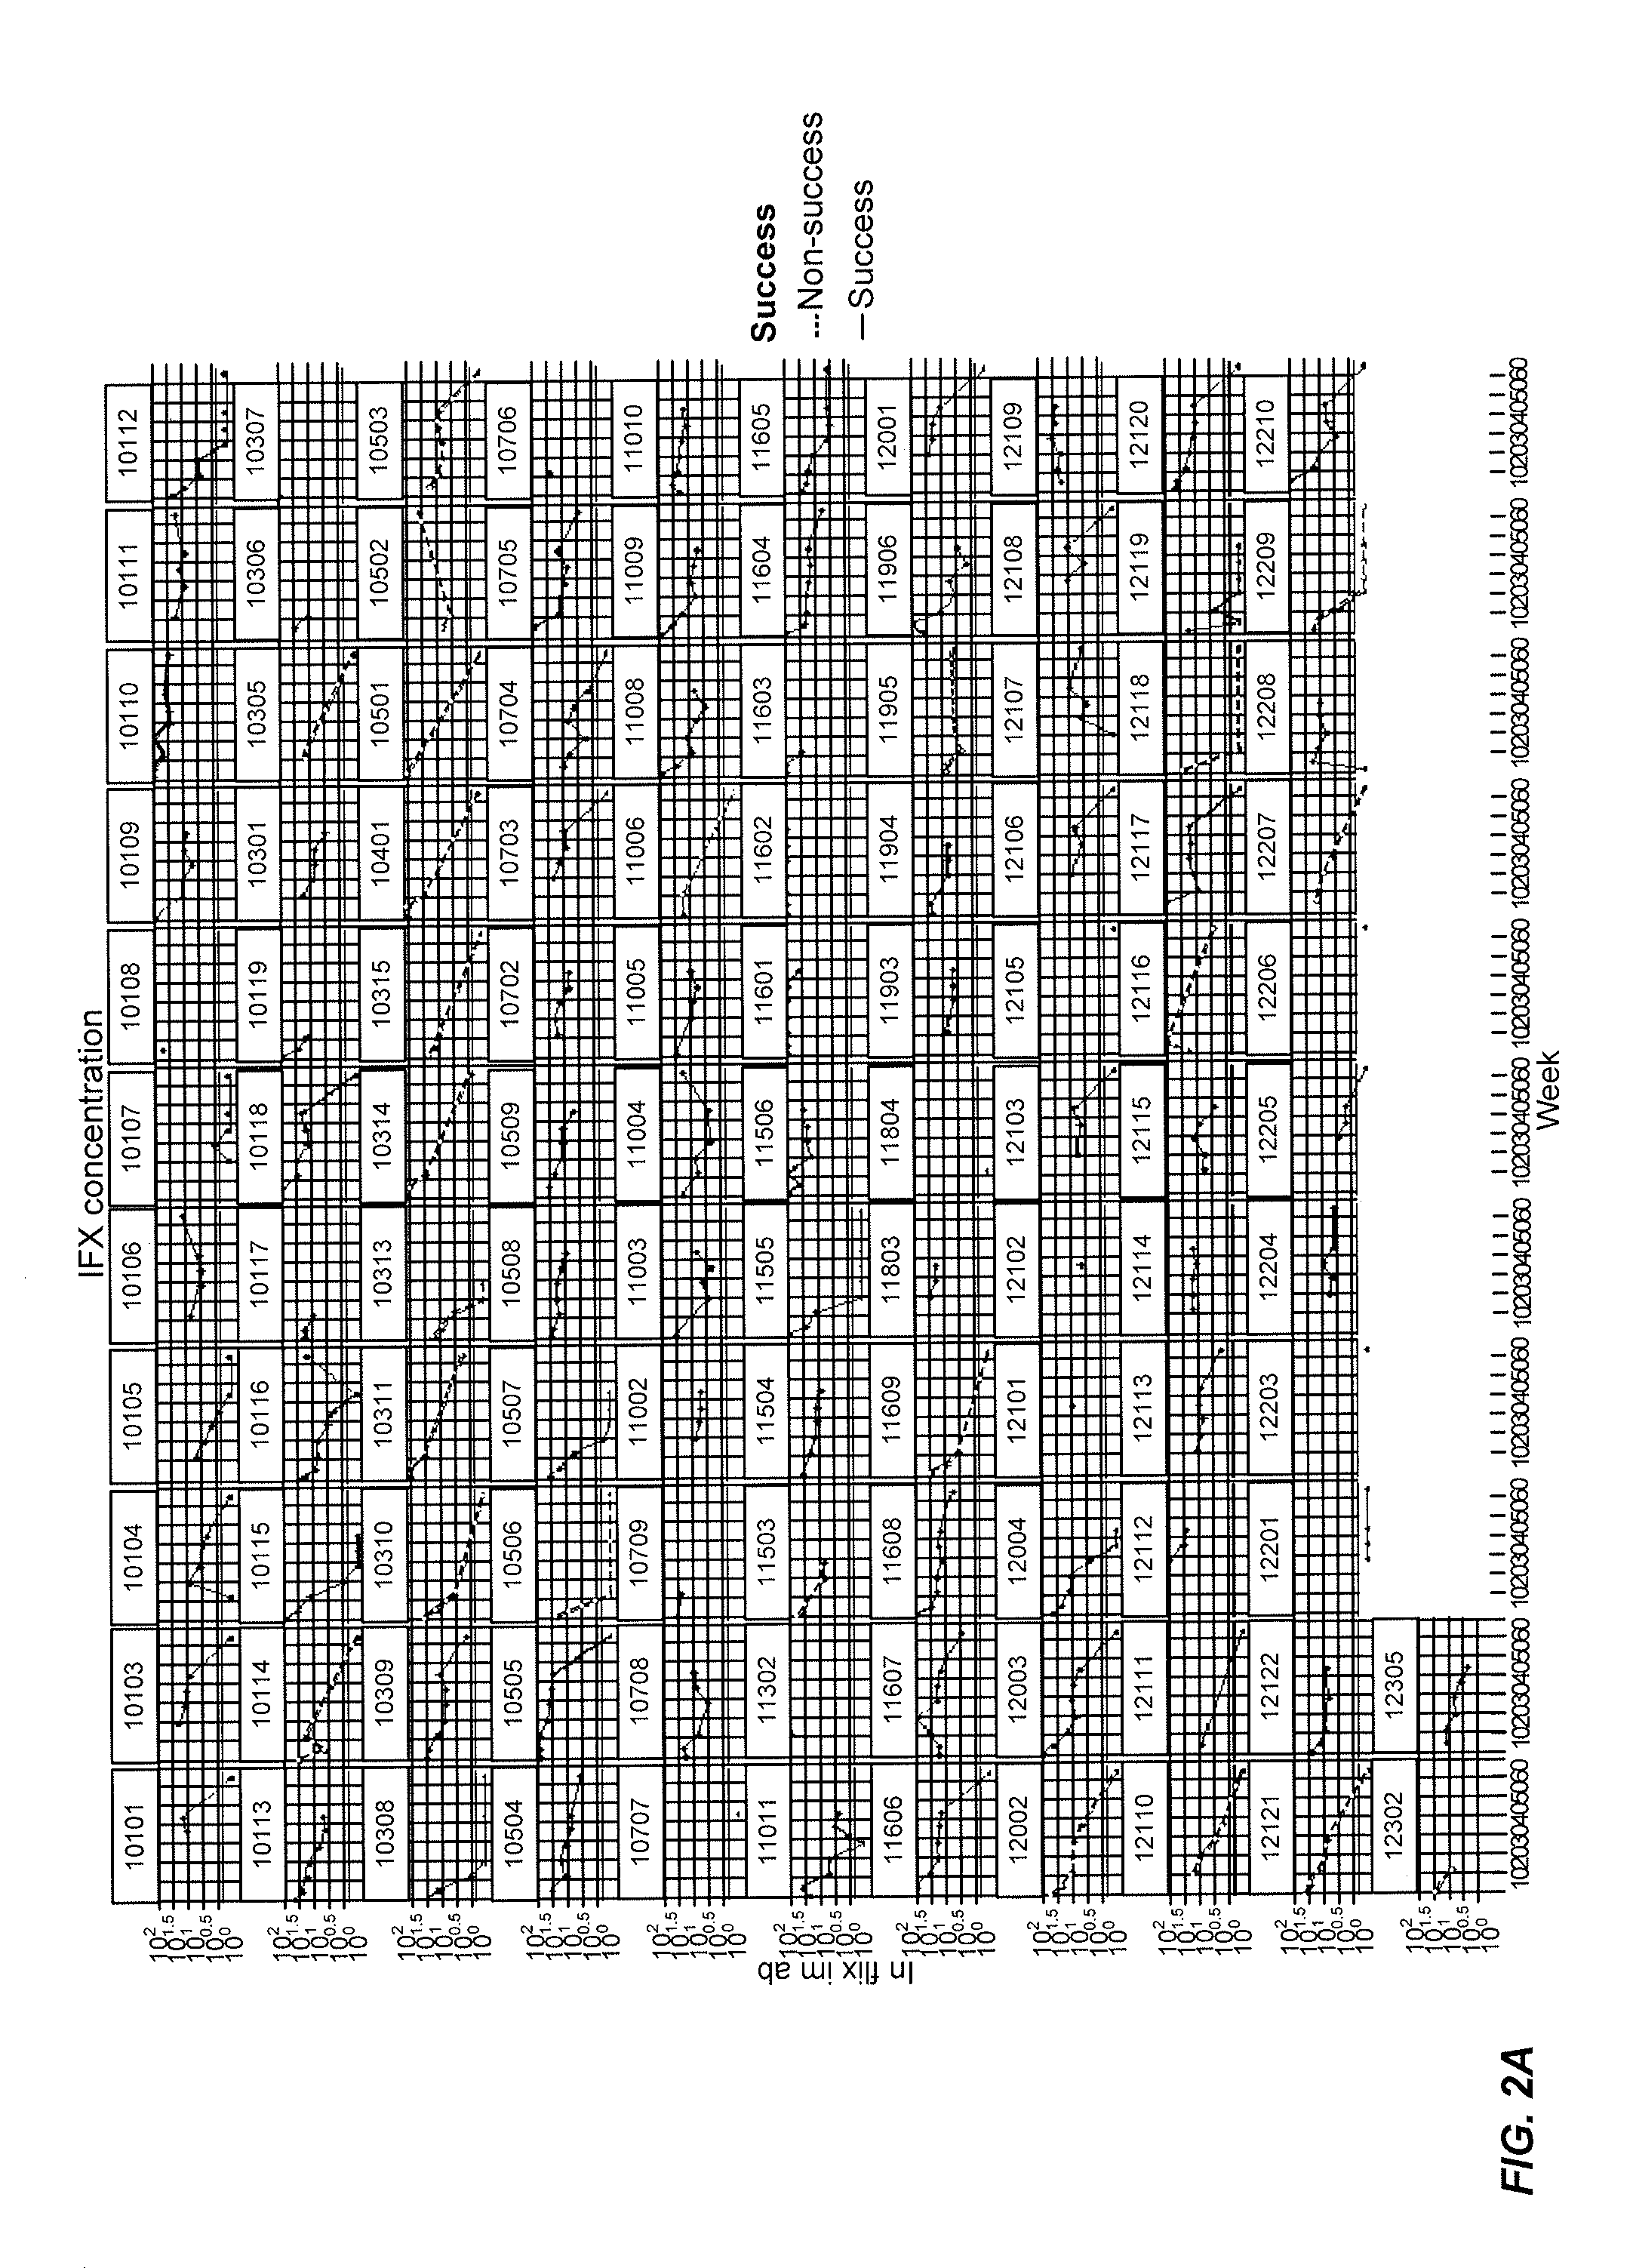
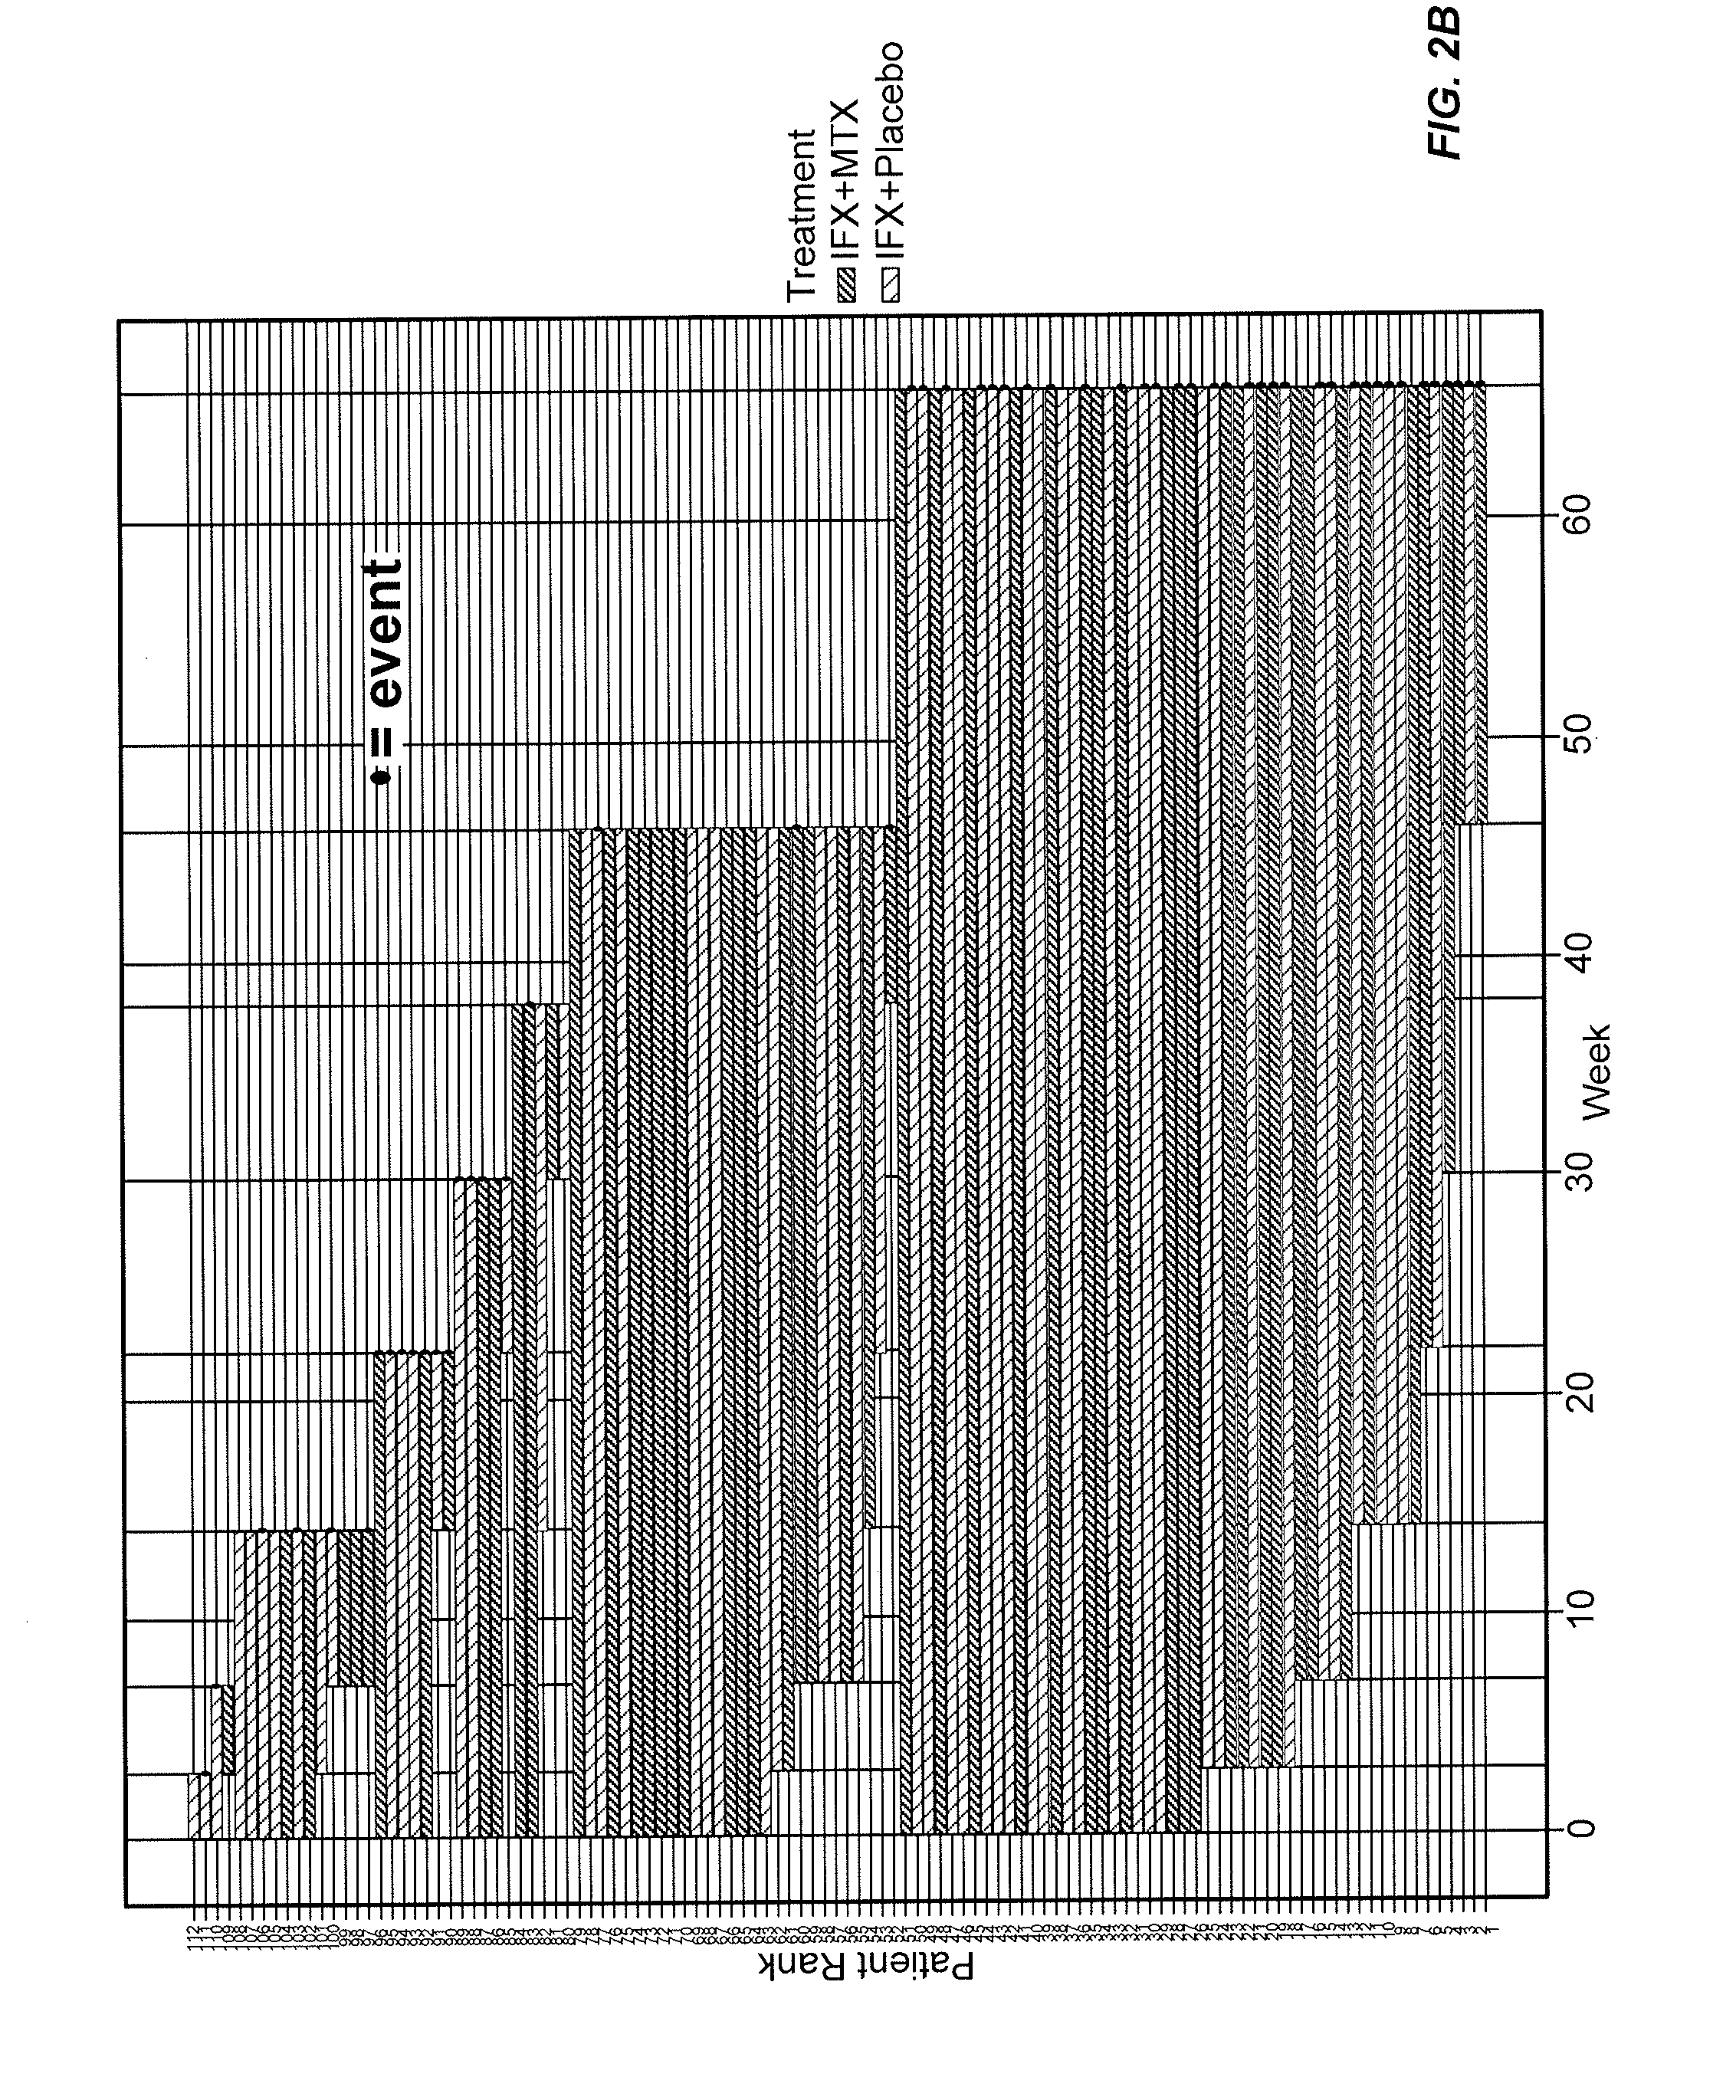
[0426]In this example, the “Hazard” is the risk of infliximab not being detected (e.g., non-detection) by an analytical assay such as a mobility shift assay. For example, FIG. 11 shows infliximab concentration levels for various patients during their course of treatment. An event occurs...
PUM
| Property | Measurement | Unit |
|---|---|---|
| Therapeutic | aaaaa | aaaaa |
| Toxicity | aaaaa | aaaaa |
Abstract
Description
Claims
Application Information
 - R&D
- Intellectual Property
- Life Sciences
- Materials
- Tech Scout
- Unparalleled Data Quality
- Higher Quality Content
- 60% Fewer Hallucinations
Browse by: Latest US Patents, China's latest patents, Technical Efficacy Thesaurus, Application Domain, Technology Topic, Popular Technical Reports.
© 2025 PatSnap. All rights reserved.Legal|Privacy policy|Modern Slavery Act Transparency Statement|Sitemap|About US| Contact US: help@patsnap.com


